

17β-Estradiol protects female rats from bilateral oophorectomy-induced nonalcoholic fatty liver disease induced by improving linoleic acid metabolism alteration and gut microbiota disturbance
- PMID: 38601573
- PMCID: PMC11004821
- DOI: 10.1016/j.heliyon.2024.e29013
17β-Estradiol protects female rats from bilateral oophorectomy-induced nonalcoholic fatty liver disease induced by improving linoleic acid metabolism alteration and gut microbiota disturbance
Abstract
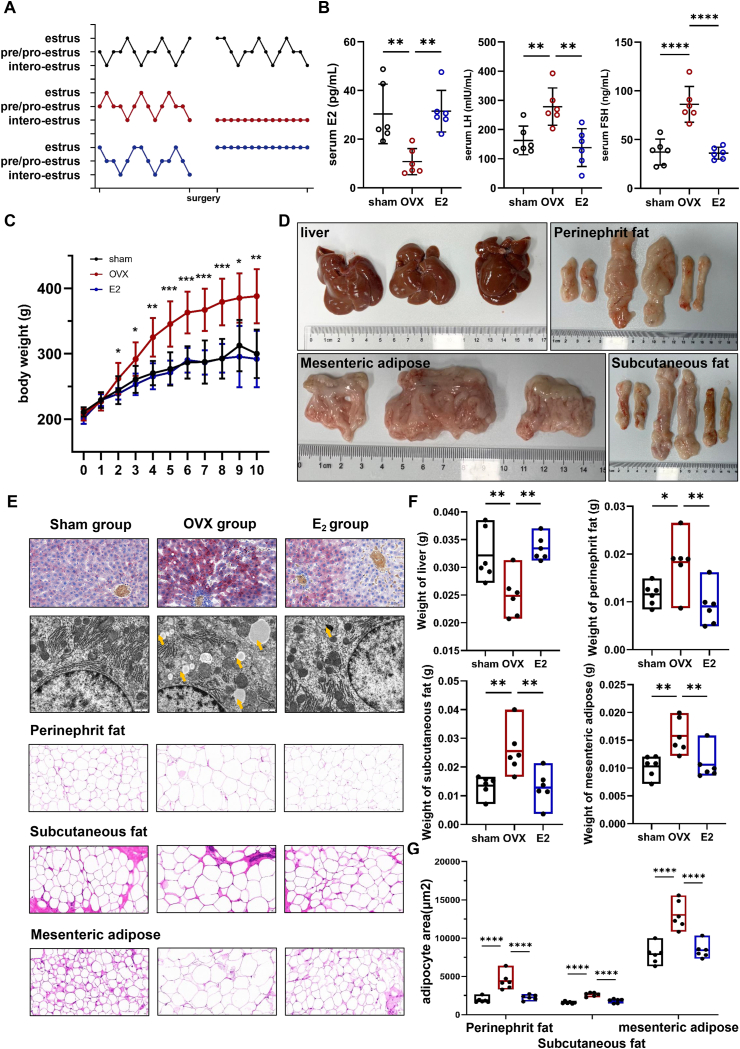
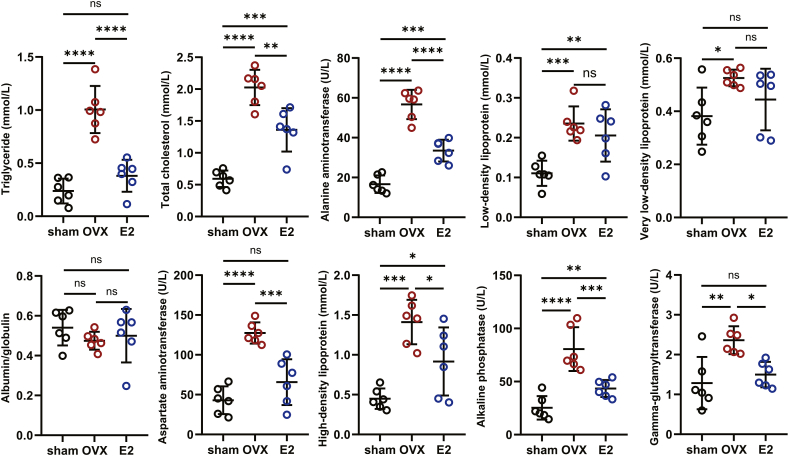
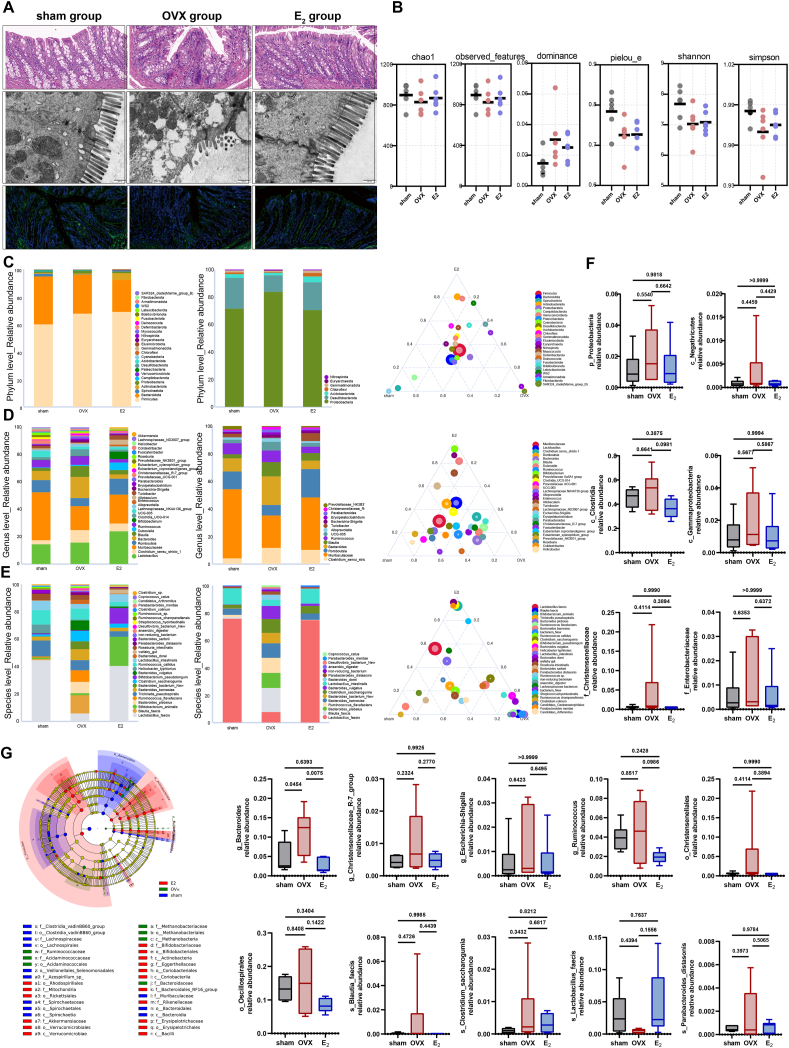
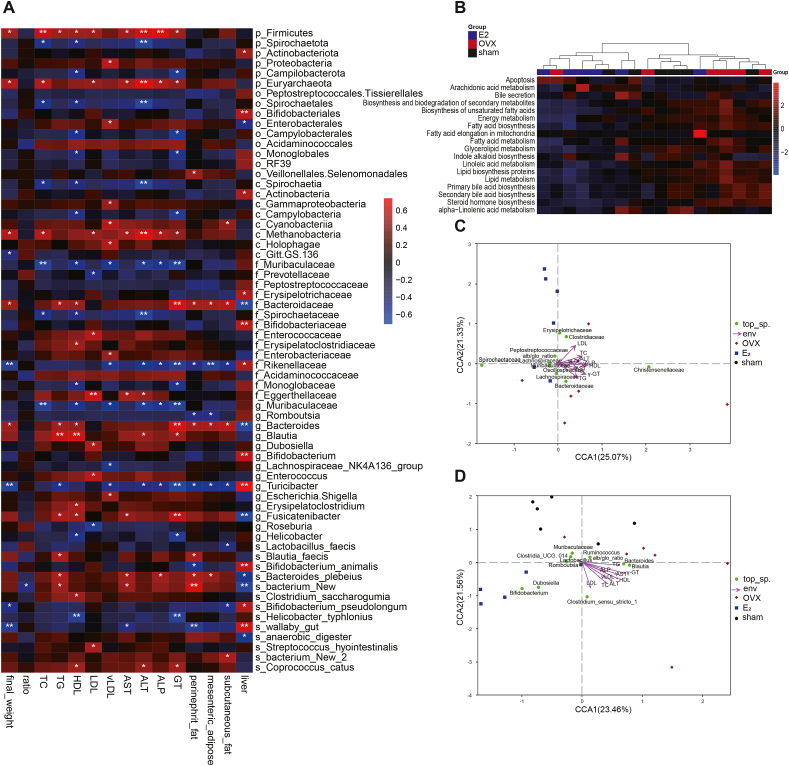
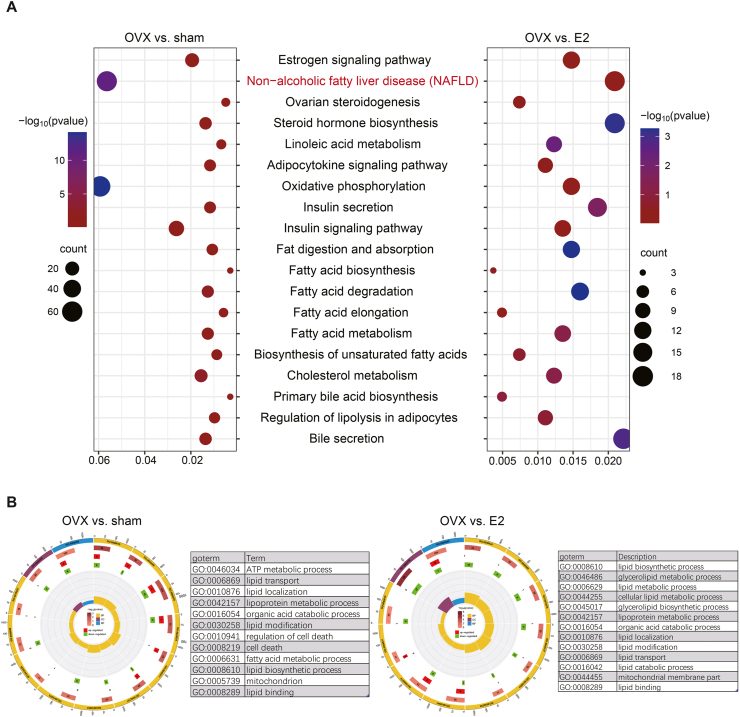
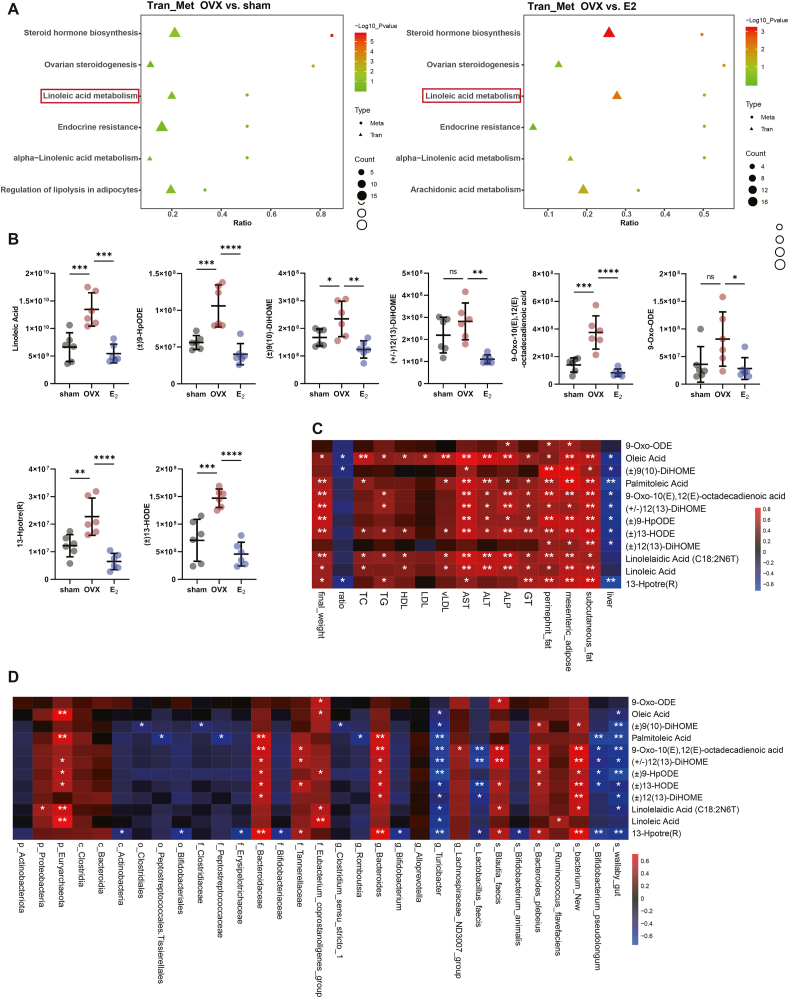
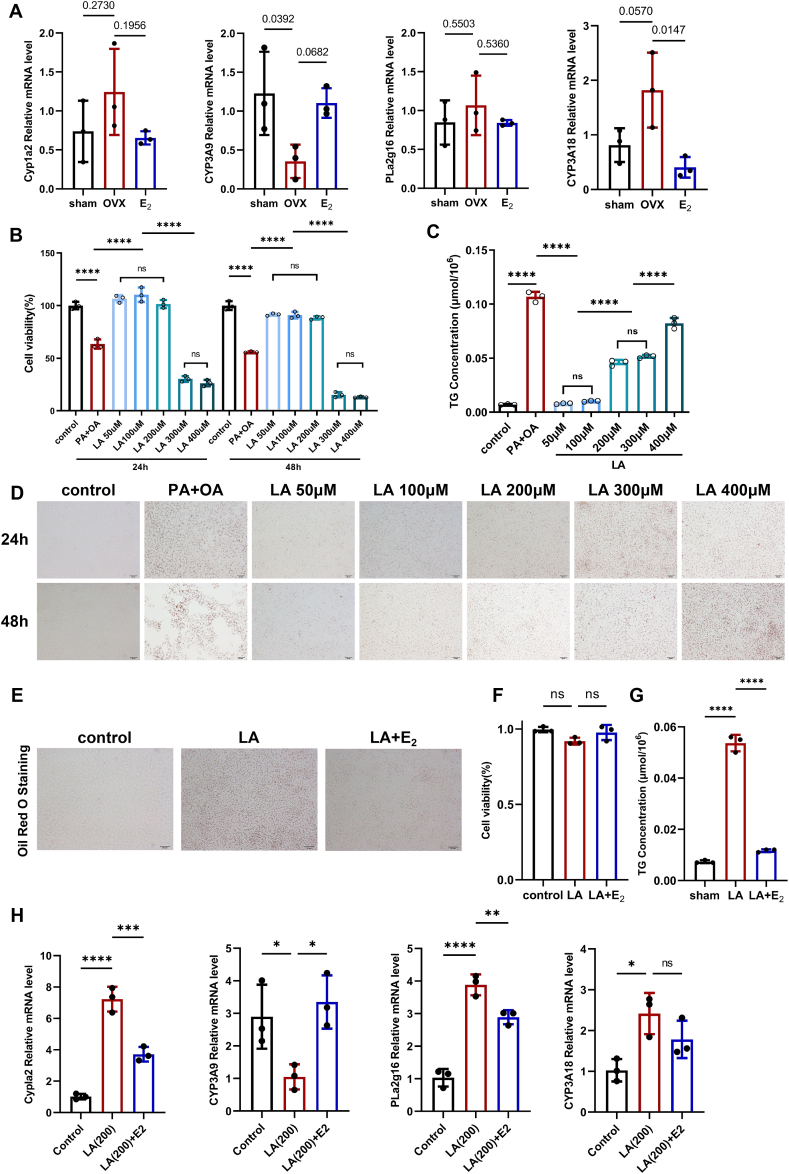
After surgical or natural menopause, women face a high risk of nonalcoholic fatty liver disease (NAFLD), which can be diminished by hormone replacement therapy (HRT). The gut microbiota is subject to modulation by various physiological changes and the progression of diseases. This microbial ecosystem coexists symbiotically with the host, playing pivotal roles in immune maturation, microbial defense mechanisms, and metabolic functions essential for nutritional and hormone homeostasis. E2 supplementation effectively prevented the development of NAFLD after bilateral oophorectomy (OVX) in female rats. The changes in the gut microbiota such as abnormal biosynthetic metabolism of fatty acids caused by OVX were partially restored by E2 supplementation. The combination of liver transcriptomics and metabolomics analysis revealed that linoleic acid (LA) metabolism, a pivotal pathway in fatty acids metabolism was mainly manipulated during the induction and treatment of NAFLD. Further correlation analysis indicated that the gut microbes were associated with abnormal serum indicators and different LA metabolites. These metabolites are also closely related to serum indicators of NAFLD. An in vitro study verified that LA is an inducer of hepatic steatosis. The changes in transcription in the LA metabolism pathway could be normalized by E2 treatment. The metabolic perturbations of LA may directly and secondhand impact the development of NAFLD in postmenopausal individuals. This research focused on the sex-specific pathophysiology and treatment of NAFLD, providing more evidence for HRT and calling for the multitiered management of NAFLD.
Keywords: Hormone replacement therapy; Linoleic acid; Nonalcoholic fatty liver disease; Surgical menopause.
© 2024 Published by Elsevier Ltd.
Conflict of interest statement
The authors declare that they have no known competing financial interests or personal relationships that could have appeared to influence the work reported in this paper.
Figures
Similar articles
-
17β-Estradiol (E2) Upregulates the ERα/SIRT1/PGC-1α Signaling Pathway and Protects Mitochondrial Function to Prevent Bilateral Oophorectomy (OVX)-Induced Nonalcoholic Fatty Liver Disease (NAFLD).Antioxidants (Basel). 2023 Dec 12;12(12):2100. doi: 10.3390/antiox12122100. Antioxidants (Basel). 2023. PMID: 38136219 Free PMC article.
-
Gut microbiota and butyrate contribute to nonalcoholic fatty liver disease in premenopause due to estrogen deficiency.PLoS One. 2022 Feb 2;17(2):e0262855. doi: 10.1371/journal.pone.0262855. eCollection 2022. PLoS One. 2022. PMID: 35108315 Free PMC article.
-
Da-Chai-Hu Decoction Ameliorates High Fat Diet-Induced Nonalcoholic Fatty Liver Disease Through Remodeling the Gut Microbiota and Modulating the Serum Metabolism.Front Pharmacol. 2020 Nov 27;11:584090. doi: 10.3389/fphar.2020.584090. eCollection 2020. Front Pharmacol. 2020. PMID: 33328987 Free PMC article.
-
Food and Gut Microbiota-Derived Metabolites in Nonalcoholic Fatty Liver Disease.Foods. 2022 Sep 5;11(17):2703. doi: 10.3390/foods11172703. Foods. 2022. PMID: 36076888 Free PMC article. Review.
-
Gut dysbiosis in nonalcoholic fatty liver disease: pathogenesis, diagnosis, and therapeutic implications.Front Cell Infect Microbiol. 2022 Nov 8;12:997018. doi: 10.3389/fcimb.2022.997018. eCollection 2022. Front Cell Infect Microbiol. 2022. PMID: 36425787 Free PMC article. Review.
Cited by
-
Excess cardiovascular mortality in men with non-alcoholic fatty liver disease: A cause for concern!World J Cardiol. 2024 Jul 26;16(7):380-384. doi: 10.4330/wjc.v16.i7.380. World J Cardiol. 2024. PMID: 39086893 Free PMC article.
-
Role of plasma metabolome in mediating the effect of plasma lipidome on NAFLD: a Mendelian randomization study.Front Endocrinol (Lausanne). 2025 Jan 23;15:1436827. doi: 10.3389/fendo.2024.1436827. eCollection 2024. Front Endocrinol (Lausanne). 2025. PMID: 39916753 Free PMC article.
References
LinkOut - more resources
Full Text Sources
