

Where east meets west: Phylogeography of the high Arctic North American brant goose
- PMID: 38601857
- PMCID: PMC11004662
- DOI: 10.1002/ece3.11245
Where east meets west: Phylogeography of the high Arctic North American brant goose
Abstract
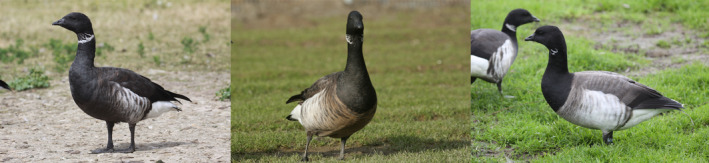
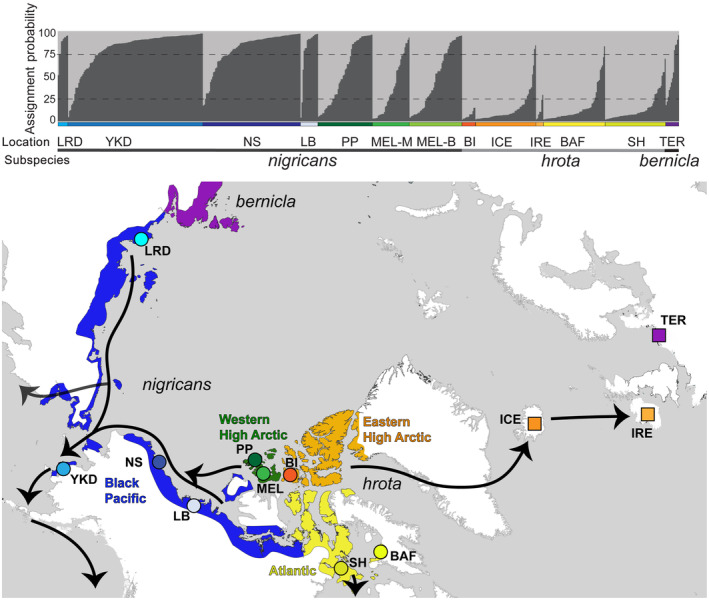
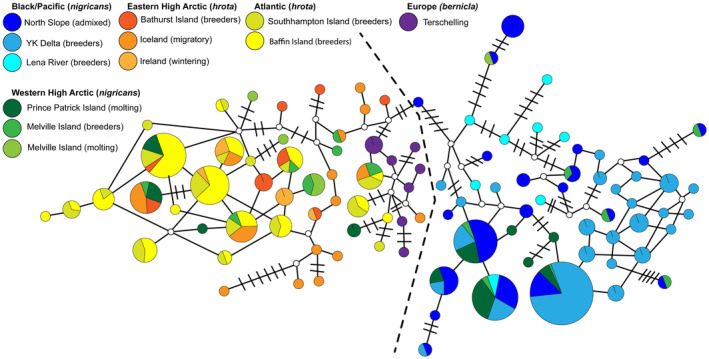
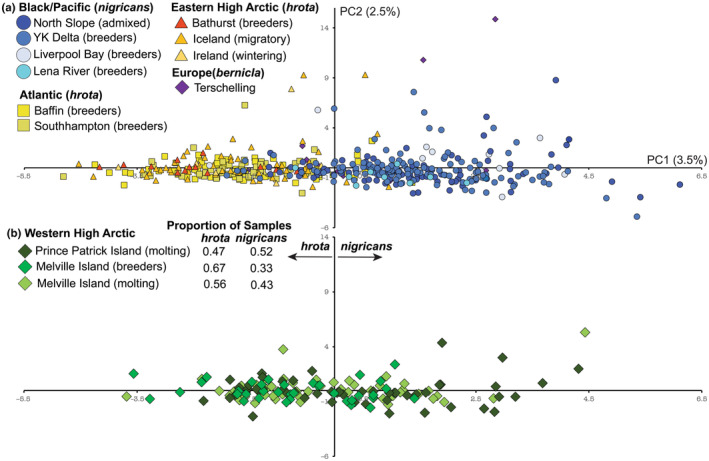
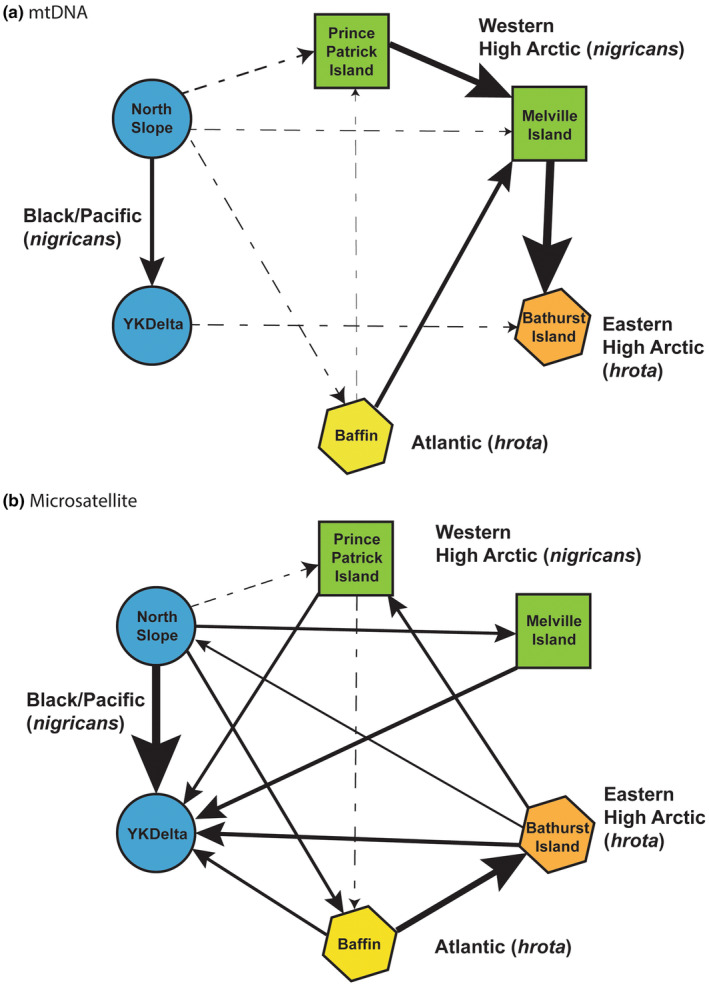
Genetic variation in Arctic species is often influenced by vicariance during the Pleistocene, as ice sheets fragmented the landscape and displaced populations to low- and high-latitude refugia. The formation of secondary contact or suture zones during periods of ice sheet retraction has important consequences on genetic diversity by facilitating genetic connectivity between formerly isolated populations. Brant geese (Branta bernicla) are a maritime migratory waterfowl (Anseriformes) species that almost exclusively uses coastal habitats. Within North America, brant geese are characterized by two phenotypically distinct subspecies that utilize disjunct breeding and wintering areas in the northern Pacific and Atlantic. In the Western High Arctic of Canada, brant geese consist of individuals with an intermediate phenotype that are rarely observed nesting outside this region. We examined the genetic structure of brant geese populations from each subspecies and areas consisting of intermediate phenotypes using mitochondrial DNA (mtDNA) control region sequence data and microsatellite loci. We found a strong east-west partition in both marker types consistent with refugial populations. Within subspecies, structure was also observed at mtDNA while microsatellite data suggested the presence of only two distinct genetic clusters. The Western High Arctic (WHA) appears to be a secondary contact zone for both Atlantic and Pacific lineages as mtDNA and nuclear genotypes were assigned to both subspecies, and admixed individuals were observed in this region. The mtDNA sequence data outside WHA suggests no or very restricted intermixing between Atlantic and Pacific wintering populations which is consistent with published banding and telemetry data. Our study indicates that, although brant geese in the WHA are not a genetically distinct lineage, this region may act as a reservoir of genetic diversity and may be an area of high conservation value given the potential of low reproductive output in this species.
Keywords: Branta bernicla; brant geese; contact zones; genetic structure; refugia.
© 2024 His Majesty the King in Right of Canada and The Authors. Ecology and Evolution published by John Wiley & Sons Ltd. Reproduced with the permission of the Minister of Environment And Climate Change Canada. This article has been contributed to by U.S. Government employees and their work is in the public domain in the USA.
Conflict of interest statement
The authors declare no conflicts of interest.
Figures
References
-
- Abbott, R. J. , Smith, L. C. , Milne, R. I. , Crawford, R. M. M. , Wolff, K. , & Balfour, J. (2000). Molecular analysis of plant migration and refugia in the arctic. Science, 289, 1343–1346. - PubMed
-
- Alisauskas, R. T. , Calvert, A. M. , Leafloor, J. O. , Rockwell, R. F. , Drake, K. L. , Kellett, D. K. , Brook, R. W. , & Abraham, K. F. (2022). Subpopulation contributions to a breeding metapopulation of migratory arctic herbivores: Survival, fecundity and asymmetric dispersal. Ecography, 7, e05653.
-
- Baldassare, G. (2014). Ducks, geese, and swans of North America. John Hopkins Press.
-
- Bandelt, H.‐J. , Forster, P. , & Röhl, A. (1999). Median‐joining networks for inferring intraspecific phylogenies. Molecular Biology and Evolution, 16, 37–48. - PubMed
-
- Barry, T. W. (1962). Effect of late seasons on Atlantic Brant reproduction. The Journal of Wildlife Management, 26, 19–26.
LinkOut - more resources
Full Text Sources
