. 2024 Mar 27:15:1343891.
doi: 10.3389/fmicb.2024.1343891. eCollection 2024.

Lacticaseibacillusparacasei BNCC345679 revolutionizes DSS-induced colitis and modulates gut microbiota

Affiliations

Lacticaseibacillusparacasei BNCC345679 revolutionizes DSS-induced colitis and modulates gut microbiota

Waqar Ahmad et al. Front Microbiol. .

Abstract

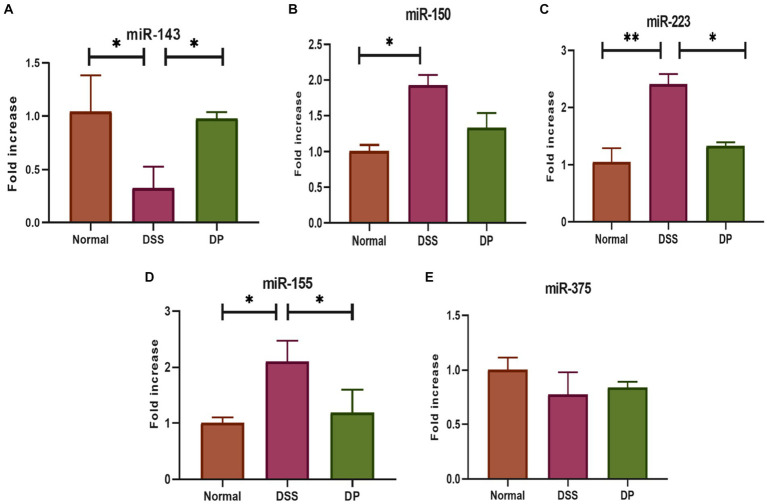
The gut microbiota plays an important role in the disease progression of inflammatory bowel disease. Although probiotics are effective against IBD, not many studies have investigated their effects on gut microbiota composition and immunomodulation in mouse colitis models. Our study aimed at the therapeutic effects of Lacticaseibacillus paracasei BNCC345679 for the first time and explored its impact on gut microbiome dysbiosis, inflammatory cytokines, related miRNAs, VCAM-1, oxidative stress, intestinal integrity, and mucus barrier. We found that oral intervention of L. paracasei BNCC345679 affects recovering beneficial microbial taxa, including lactobacillus spp. and akkermansia spp., followed by improved body weight, DAI score, and inflammatory cytokines. L. paracasei BNCC345679 mitigated oxidative stress and increased the expression of intestinal integrity proteins MUC2 and ZO-1. These results suggested that L. paracasei BNCC345679 has the capacity to reduce DSS-induced colitis and has the potential as a supplement for the mitigation of IBD.

Keywords: DSS-induced colitis; Lacticaseibacillus paracasei BNCC345679; dysbiosis; gut inflammation; gut microbiota; microRNA; probiotics.


Conflict of interest statement

The authors declare that the research was conducted in the absence of any commercial or financial relationships that could be construed as a potential conflict of interest. The author(s) declared that they were an editorial board member of Frontiers, at the time of submission. This had no impact on the peer review process and the final decision.

Figures

Figure 1
Figure 1
Attenuation of clinical manifestations in DSS-induced colitis by L. paracasei BNCC34567 (Aa) division of groups showing 1-week assimilation time followed by 21 days of water, 3% DSS, and 3% DSS + probiotic treatment leading to euthanization of mice on 28th day. (Ab) Body weight percentage change relative to original weight prior to the induction of DSS induction. Body weight was recorded daily throughout the experiment. (B) DAI assessment in DSS-induced colitis, and the entire colon was collected on day 7. (C,D) Colon length was measured. This was quantified as disease severity indicator. (E) Measurement of the histological score is as per (Supplementary Table S2). (F) Histopathological assessment of colonic inflammation. H/E staining was carried out to check disease severity in the distal portion of colon. Scale bar: 500 μm. The data were subjected to analysis of variance (ANOVA) to determine the statistical significance. The degree of significance was indicated by the notation *p = 0.05, **p = 0.001, and ***p = 0.0001, while the absence of any notation indicated lack of statistical significance (n = 7). DSS, dextran sulfate sodium; DAI, disease activity index; H/E, hematoxylin and eosin.
Figure 2
Figure 2
Anti-oxidant activity via RT-qPCR assessment of oxidative stress-associated genes. (A) Superoxide dismutase 1 (SOD-1). (B) Superoxide dismutase 2 (SOD-2). (C) Catalase. (D) Glutathione peroxidase 2. (E) Nuclear factor erythroid 2-related factor 2. (F) Activity of superoxide dismutase (SOD) as indicators of the antioxidant defense system. (G) Quantification of myeloperoxidase (MPO) activity in colonic tissue. (H) Levels of malondialdehyde (MDA) in colon tissue. The data were subjected to analysis of variance (ANOVA) to determine the statistical significance. The degree of significance was indicated by the notation *p = 0.05, **p = 0.001; and ***p = 0.0001, while the absence of any notation indicated lack of statistical significance (n = 7).
Figure 3
Figure 3
Real-time quantitative polymerase chain reaction (qPCR) analysis of pro-inflammatory cytokines. The mRNA expression of pro-inflammatory cytokines. (A) Interleukin-1 beta (IL-1β). (B) Interleukin-6 (IL-6). (C) Tumor necrosis factor-alpha (TNF-α). Assessment of pro-inflammatory cytokines through Enzyme-Linked Immunosorbent Assay (ELISA) to evaluate inflammatory response. (D) Quantification of Interleukin-1 beta (IL-1α). (E). Quantification of Interleukin-6 (IL-6). (F) Quantification of Tumor Necrosis Factor-alpha (TNF-α). Assessment of anti-Inflammatory Cytokines through real time quantitative polymerase chain reaction (qPCR) analysis. The mRNA expression of anti-inflammatory cytokines (G) IL-10: Interleukin-10. (H) Peroxisome Proliferator-Activated Receptor Gamma (PPARα). The data was subjected to analysis of variance (ANOVA) to determine the statistical significance. The degree of significance was indicated by the notation *P=0.05, **P=0.001, ***P=0.0001, while the absence of any notation indicated lack of statistical significance. (n=7).
Figure 4
Figure 4
Effect of L. paracasei BNCC345679 on chosen miRNA gene expression using real-time quantitative polymerase chain reaction (qPCR) and was compared among different groups. (A) miRNA 143, (B) miRNA 150, (C) miRNA 223, (D) miRNA 155, and (E) miRNA 375. The data were subjected to analysis of variance (ANOVA) to determine the statistical significance. The degree of significance was indicated by the notation *p = 0.05, **p = 0.001, and ***p = 0.0001, while the absence of any notation indicated lack of statistical significance (n = 7).
Figure 5
Figure 5
Important gene mucin 2 responsible for the formation of mucin layer was checked through RT-qPCR (A) MUC2 expression analysis. (B) Alcian blue staining of colonic tissue for mucin assessment demonstrated distinctive variations in mucin and crypt morphology among the three experimental groups. The images showed a prominent presence of mucin and intact crypt shape in the normal group, deteriorated crypt morphology and mucin depletion in the DSS group, and notable recovery of mucin content and crypt morphology in the DP group. Images presenting the prominent mucoprotective role of L. paracasei BNCC345679. (C) Representative images of immunofluorescence staining from colon sections for distribution of mucin 2. Images provided visual insight into the presence of MUC2 in each group. The normal group exhibited continues MUC2 pattern among the colonic epithelium which was deteriorated and disrupted in the DSS group. Intriguingly, the L. paracasei BNCC345679-treated DP group demonstrated a trend toward mucin layer restoration and MUC2 normal expression. Scale bar: 500 μm (magnification = 10x). Normal: normal control group; DSS: dextran sulfate sodium-induced colitis group; DP: L. paracasei BNCC345679-treated group.
Figure 6
Figure 6
Important intestinal integrity-related genes. (A) Occludin, (B) zonula occludens-1 (ZO-1), and (C) E-Cadherin-1 gene expression was checked using real-time quantitative polymerase chain reaction (qPCR) and was compared among different groups. (D) Representative images of immunofluorescence staining from colon sections for distribution of ZO-1 involved in maintaining epithelial barrier integrity and (E) occludin, an important tight junction protein. Images provide insight into ZO-1 and occludin distribution and localization within the tissue of three experimental groups. The L. paracasei BNCC345679-treated DP group appeared to restore the concentration of both Zo-1 and occludin which is deteriorated in the DSS group showing compromised barrier function, while the normal group exhibits its undisturbed form. Scale bar: 500 μm. Normal: normal control group; DSS: dextran sulfate sodium-induced colitis group; DP: L. paracasei BNCC345679-treated group.
Figure 7
Figure 7
(A) VCAM-1, also known as vascular cell adhesion molecule-1. The examination of the expression levels was conducted using the real-time quantitative polymerase chain reaction (qPCR) technique. (B,C) Western blot analysis was employed to examine the protein expression levels of VCAM-1 in colonic tissues among the three experimental groups. The normal group demonstrated lower level of VCAM-1 expression which is elevated in the DSS group indicating inflammation. In contrast, the DP group exhibited ameliorated VCAM-1 expression suggesting a potential anti-inflammatory effect of L. paracasei BNCC345679. (C) Representative images of immunofluorescence staining from colon sections to evaluate VCAM-1 expression. The normal group demonstrated minimal VCAM-1 staining, while the DSS group displayed enhanced VCAM-1 expression speculating inflammation. In contrast, the DP group exhibit reduced VCAM-1 fluorescence indicating a potential amelioration of inflammation due to L. paracasei BNCC345679 intervention. Scale bar: 500 μm. Normal: normal control group; DSS: dextran sulfate sodium-induced colitis group; DP: L. paracasei BNCC345679-treated group.
Figure 8
Figure 8
Effect of L. paracasei BNCC345679 on gut microbiome diversity in DSS-induced colitis. (A) Alpha diversity metrics, Shannon index on the phylum level demonstrated that the DSS group is least divers among the three experimental groups, while remarkably DP is highly diversifies group. (B) Alpha diversity InvSimpson index on the phylum level confirmed the previous result trend. (C) All three groups having shared and unique OTUs. (D) Microbial taxa structure is significantly varied among the three experimental groups as per community bar plot analysis on the phylum level. (E) Principal component analysis plot of fecal microbiota structure based on Bray–Curtis distances. (F) Community bar plot analysis on the genus level showed relative bacterial abundance on the genus level (n = 5).

References

    1. Alemany-Cosme E., Sáez-González E., Moret I., Mateos B., Iborra M., Nos P., et al. . (2021). Oxidative stress in the pathogenesis of Crohn's disease and the interconnection with immunological response, microbiota, external environmental factors, and epigenetics. Antioxidants (Basel) 10:64. doi: 10.3390/antiox10010064, PMID: - DOI - PMC - PubMed
    1. Algieri F., Garrido-Mesa J., Vezza T., Rodríguez-Sojo M. J., Rodríguez-Cabezas M. E., Olivares M., et al. . (2021). Intestinal anti-inflammatory effects of probiotics in DNBS-colitis via modulation of gut microbiota and microRNAs. Eur. J. Nutr. 60, 2537–2551. doi: 10.1007/s00394-020-02441-8, PMID: - DOI - PubMed
    1. Almagro-Moreno S., Boyd E. F. (2009). Sialic acid catabolism confers a competitive advantage to pathogenic vibrio cholerae in the mouse intestine. Infect. Immun. 77, 3807–3816. doi: 10.1128/iai.00279-09, PMID: - DOI - PMC - PubMed
    1. Al-Sadi R., Ye D., Boivin M., Guo S., Hashimi M., Ereifej L., et al. . (2014). Interleukin-6 modulation of intestinal epithelial tight junction permeability is mediated by JNK pathway activation of claudin-2 gene. PLoS One 9:e85345. doi: 10.1371/journal.pone.0085345, PMID: - DOI - PMC - PubMed
    1. Aziz T., Khan A. A., Tzora A., Voidarou C. C., Skoufos I. (2023). Dietary implications of the bidirectional relationship between the gut microflora and inflammatory diseases with special emphasis on irritable bowel disease: current and future perspective. Nutrients 15:956. doi: 10.3390/nu15132956, PMID: - DOI - PMC - PubMed