. 2024 Jun;44(6):1265-1282.
doi: 10.1161/ATVBAHA.124.320671. Epub 2024 Apr 11.

Endothelial Cell Flow-Mediated Quiescence Is Temporally Regulated and Utilizes the Cell Cycle Inhibitor p27

Affiliations

Endothelial Cell Flow-Mediated Quiescence Is Temporally Regulated and Utilizes the Cell Cycle Inhibitor p27

Natalie T Tanke et al. Arterioscler Thromb Vasc Biol. 2024 Jun.

Abstract

Background: Endothelial cells regulate their cell cycle as blood vessels remodel and transition to quiescence downstream of blood flow-induced mechanotransduction. Laminar blood flow leads to quiescence, but how flow-mediated quiescence is established and maintained is poorly understood.

Methods: Primary human endothelial cells were exposed to laminar flow regimens and gene expression manipulations, and quiescence depth was analyzed via time-to-cell cycle reentry after flow cessation. Mouse and zebrafish endothelial expression patterns were examined via scRNA-seq (single-cell RNA sequencing) analysis, and mutant or morphant fish lacking p27 were analyzed for endothelial cell cycle regulation and in vivo cellular behaviors.

Results: Arterial flow-exposed endothelial cells had a distinct transcriptome, and they first entered a deep quiescence, then transitioned to shallow quiescence under homeostatic maintenance conditions. In contrast, venous flow-exposed endothelial cells entered deep quiescence early that did not change with homeostasis. The cell cycle inhibitor p27 (CDKN1B) was required to establish endothelial flow-mediated quiescence, and expression levels positively correlated with quiescence depth. p27 loss in vivo led to endothelial cell cycle upregulation and ectopic sprouting, consistent with loss of quiescence. HES1 and ID3, transcriptional repressors of p27 upregulated by arterial flow, were required for quiescence depth changes and the reduced p27 levels associated with shallow quiescence.

Conclusions: Endothelial cell flow-mediated quiescence has unique properties and temporal regulation of quiescence depth that depends on the flow stimulus. These findings are consistent with a model whereby flow-mediated endothelial cell quiescence depth is temporally regulated downstream of p27 transcriptional regulation by HES1 and ID3. The findings are important in understanding endothelial cell quiescence misregulation that leads to vascular dysfunction and disease.

Keywords: blood circulation; cell cycle; cell cycle checkpoints; endothelial cells; zebrafish.


Conflict of interest statement

Disclosures None.

Figures

Figure 1.
Figure 1.. Laminar flow-mediated quiescence is transcriptionally distinct.
(A) Quantification of epithelial quiescence score in HUVEC scRNA dataset by cluster (previously defined). Flow-M, flow maintenance (laminar flow (15d/cm2/72h)). Static cells were visually checked for subconfluence and collected 48h post-seeding. (B) Quantification of endothelial quiescence score in HUVEC scRNA dataset by cluster. (C) Endothelial quiescence score on bulk RNA seq data of HUVEC exposed to indicated stimuli, n= 3 replicates. (D-E) Heatmaps showing relative expression of cell cycle proliferation markers (green font) and inhibitors (red font) plotted using bulk RNAseq data of HUVEC under indicated conditions, n=3 replicates. Statistics, one-way ANOVA with Tukey’s multiple comparison test.
Figure 2.
Figure 2.. Endothelial cell flow maintenance quiescence stimulus leads to shallow quiescence depth.
(A) Representative images of HUVEC under static (non-flow) or Flow-M (flow maintenance) conditions with EdU incorporation and fixation at indicated times post Flow-M release. Cultures stained for DAPI (white, nuclear mask) and EdU (red, S-phase) or pRB (blue, interphase). Scale bar, 50 μm. White arrow, flow direction. (B) Quantification of percent EdU+ cells with indicated conditions. n=3 replicates, 5 images per condition per replicate. (C) Quantification of percent pRB+ cells with indicated conditions. n=3 replicates, 5 images per condition per replicate. (D) Representative images of HUVEC under indicated density conditions with EdU incorporation and fixation at indicated times post high-density release. Cultures stained for DAPI (white, nuclear mask) and EdU (red, S-phase) or pRB (blue, interphase). Scale bar, 50 μm. (E) Quantification of percent EdU+ cells with indicated conditions. n=3 replicates, 6 images per condition per replicate. (F) Quantification of percent pRB+ cells with indicated conditions. n=3 replicates, 6 images per condition per replicate. Statistics, one-way ANOVA with Tukey’s multiple comparisons test.
Figure 3.
Figure 3.. Cell cycle inhibitor p27 expression levels vary with endothelial quiescence stimulus.
(A) RT-qPCR for CDKN1B levels under indicated conditions. n=3 replicates. (B) Representative images of HUVEC under indicated conditions stained for p27 (green) and DAPI (white, nuclear mask). Scale bar, 50 μm. White arrow, flow direction. (C) Quantification of HUVEC p27+ cells under indicated conditions. n=3 replicates, 5 images per condition per replicate. (D) RT-qPCR for CDKN1B levels under indicated conditions. n=3 replicates. (E) Representative images of HUVEC under indicated conditions stained for p27 (green) and DAPI (white, nuclear mask). Scale bar, 50 μm. (F) Quantification of HUVEC p27+ cells under indicated conditions. n=3 replicates, 5 images per condition per replicate. Statistics, student’s two-tailed t-test.
Figure 4.
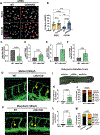
Figure 4.. p27 establishes quiescence in endothelial cells and regulates cell cycle and vascular expansion in vivo.
(A) Representative images of HUVEC with indicated siRNA treatments and conditions. after EdU incorporation (red, S-phase) and staining with DAPI (white, nuclear mask). Scale bar, 50 μm. White arrow, flow direction. (B) Quantification of EdU+ cells with indicated conditions. n=3 replicates, 5 images per condition per replicate. (C-F) RT-qPCR of FACs sorted 24 hpf zebrafish endothelial cells from Tg(fli:LifeAct-GFP) (green, endothelial cell marker) embryos of indicated genotypes for cdkn1bb (C), mki67 (D), pcna (E), and ccnd1 (F) levels. n=3 replicates. (G) Representative images of 36hpf Tg(fli:LifeAct-GFP) (green, endothelial cell marker) embryos that were also WT or cdkn1bb−/−. Yellow arrows, ectopic sprouts. Scale bar, 50 μm. (H) Quantification of ectopic sprouts per embryo. n=3 replicates, 5 images per condition per replicate. (I) Diagram defining regions for ectopic sprout quantification in embryonic zebrafish. (J) Quantification of % ectopic sprouts in Tg(fli:LifeAct-GFP) (green, endothelial cell marker) embryos and of indicated genotypes per region. n=3 replicates, 5 images per condition per replicate. (K) Representative images of 36hpf Tg(fli:LifeAct-GFP) embryos injected with control (NT) or cdkn1bb MO at the one-cell stage. Yellow arrows, ectopic sprouts. Scale bar, 50 μm. (L) Quantification of ectopic sprouts per embryo. n=3 replicates, 5 images per condition per replicate. (M) Quantification of % ectopic sprouts in Tg(fli:LifeAct-GFP) (green, endothelial cell marker) and with indicated MO injection per region. n=3 replicates, 5 images per condition per replicate. Statistics, student’s two-tailed t-test (C-F, H, L), two-way ANOVA with Tukey’s multiple comparisons test (B), and Γ2 test (J, M).
Figure 5.
Figure 5.. Endothelial quiescence depth varies with laminar flow exposure time and positively correlates with p27 expression levels.
(A) Representative images of HUVEC with indicated conditions and stained for p27 (inhibitor), p21 (inhibitor), Ki67 (proliferation marker), and DAPI (nucleus) in white. Scale bar, 50 μm. White arrow, flow direction. (B-D) Quantification of percent p27+ (B), p21+ cells (C), or Ki67+ cells (D). n=3 replicates, 5 images per condition per replicate. (E) Representative images of HUVEC under indicted conditions and after EdU incorporation (red, S-phase) and stained for pRB (blue, interphase) and with DAPI (white, nuclear mask), Flow-E, flow establishment (15d/cm2, 16h); Flow-M, flow maintenance (15d/cm2, 72h). Scale bar, 50 μm. White arrow, flow direction. (F) Quantification of EdU+ cells under indicated conditions. n=3 replicates, 5 images per condition per replicate. (G) Quantification of pRB+ cells under indicated conditions. n=3 replicates, 5 images per condition per replicate. (H) Representative images of HUVEC with indicated siRNA treatments and conditions after EdU incorporation (red, S-phase) and staining with DAPI (white, nuclear mask). Scale bar, 50 μm. White arrow, flow direction. (I) Quantification of EdU+ cells with indicated conditions. n=3 replicates, 5 images per condition per replicate. Statistics, one-way ANOVA with Tukey’s multiple comparisons test (B-D, F, G) and two-way ANOVA with Tukey’s multiple comparisons test (I).
Figure 6.
Figure 6.. BMP and NOTCH regulated p27 repressors HES1 and ID3 regulate p27 levels and flow-mediated quiescence depth.
(A) Representative images of HUVEC under indicated conditions and with indicated siRNA treatment. Cells stained for p27 (green) and DAPI (white, nuclear mask). Scale bar, 50 μm. White arrow, flow direction. (B) Quantification of p27+ cells under indicated conditions and treatments. n=3 replicates, 5 images per condition per replicate. (C-D) RT-qPCR for HES1 (C) and ID3 (D) levels under indicated conditions. n=3 replicates. (E) Representative images of HUVEC under indicated conditions and siRNA treatments. Cells were labeled with EdU (red, S-phase) and stained for pRB (blue, interphase) and DAPI (white, nuclear mask). Scale bar, 50 μm. White arrow, flow direction. (F) Quantification of EdU+ cells with indicated conditions. n=3 replicates, 5 images per condition per replicate. (G) Quantification of pRB+ cells with indicated conditions. n=3 replicates, 5 images per condition per replicate. (H) Representative images of HUVEC under indicated conditions and siRNA treatments. Cells were labeled with EdU (red, S-phase) and stained for pRB (blue, interphase) and DAPI (white, nuclear mask). Scale bar, 50 μm. White arrow, flow direction. (I) Quantification of EdU+ cells under indicated conditions. n=3 replicates, 5 images per condition per replicate. (J) Quantification of pRB+ cells under indicated conditions. n=3 replicates, 5 images per condition per replicate. Statistics, student’s two-tailed t-test (C-D), one-way ANOVA with Tukey’s multiple comparisons test (F-G, I-J) and two-way ANOVA with Tukey’s multiple comparisons test (B).
Figure 7.
Figure 7.. Endothelial cells establish and maintain deep quiescence under venous flow and express elevated p27 levels in vivo.
(A) Representative images of HUVEC under indicated conditions (Flow-MV (5d/cm2, 72h)) stained for p27 (green) and DAPI (white, nuclear mask). Scale bar, 50 μm. White arrow, flow direction. (B) Quantification of HUVEC p27+ cells under indicated conditions, n=3 replicates, 5 images per condition per replicate. (C) RT-qPCR for CDKN1B levels in indicated conditions. n=3 replicates. (D) Representative images of HUVEC under static (non-flow) or Flow-EV (5d/cm2, 16h) conditions with EdU incorporation and fixation at indicated times post Flow-EV release. Cells stained for DAPI (white, nuclear mask) and EdU (red, S-phase), Scale bar, 50 μm. White arrow, flow direction. (E) Quantification of EdU+ cells with indicated conditions. n=3 replicates, 5 images per condition per replicate. (F) Representative images of HUVEC under static (non-flow) or Flow-MV conditions (5d/cm2, 72h) with EdU incorporation and fixation at indicated times post Flow-MV release. Cells stained for DAPI (white, nuclear mask) and EdU (red, S-phase), Scale bar, 50 μm. White arrow, flow direction. (G) Quantification of EdU+ cells with indicated conditions. n=3 replicates, 5 images per condition per replicate. (H) UMAP grouping of artery, vein, and capillary endothelial cell clusters enriched from neonatal mouse ear skin. (I) UMAP overlaid with Cdkn1b (p27) expression. (J) Dot plot of Cdkn1b expression by endothelial sub-type. (K) UMAP grouping of endothelial artery, vein, and capillary clusters reanalyzed from 24hpf embryonic zebrafish. (L) UMAP overlaid with cdkn1bb (p27) expression. (M) Dot plot of Cdkn1b expression by endothelial sub-type. Statistics, student’s two-tailed t-test (B-C, J-M) and one-way ANOVA with Tukey’s multiple comparisons test (E, G).
Figure 8.
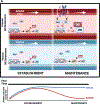
Figure 8.. Model of endothelial cell flow-mediated quiescence depth.
Proposed model for dynamic regulation of endothelial cell flow-mediated quiescence depth with flow exposure time and magnitude. In the first 16h (Flow-E, arterial flow establishment) of laminar flow, a deep quiescence is established accompanied by high levels of cell cycle inhibitor p27, independent of flow magnitude. With time under arterial flow (Flow-M, flow maintenance), HES1 and ID3 transcription factors are upregulated downstream of flow-mediated Notch and BMP signaling, and they repress p27 transcription leading to a shallow quiescence depth. Deep quiescence and high p27 levels characterize venous flow establishment at 16h (Flow-EV, venous flow establishment), and this deep quiescence perdures with time under venous flow (Flow-MV).

Update of

Similar articles

Cited by

References

    1. Privratsky JR, Newman PJ. PECAM-1: regulator of endothelial junctional integrity. Cell Tissue Res. 2014;355:607–619. doi:10.1007/s00441-013-1779-3 - DOI - PMC - PubMed
    1. Baeyens N, Schwartz MA. Biomechanics of vascular mechanosensation and remodeling. Mol Biol Cell. 2016;27:7–11. doi:10.1091/mbc.E14-11-1522 - DOI - PMC - PubMed
    1. Sluysmans S, Vasileva E, Spadaro D, Shah J, Rouaud F, Citi S. The role of apical cell-cell junctions and associated cytoskeleton in mechanotransduction. Biol Cell. 2017;109:139–161. doi:10.1111/boc.201600075 - DOI - PubMed
    1. Levesque MJ, Sprague EA, Schwartz CJ, Nerem RM. The Influence of Shear Stress on Cultured Vascular Endothelial Cells: The Stress Response of an Anchorage-Dependent Mammalian Cell. Biotechnol Prog. 1989;5:1–8. doi:10.1002/btpr.5420050105 - DOI
    1. Levesque MJ, Nerem RM, Sprague EA. Vascular endothelial cell proliferation in culture and the influence of flow. Biomaterials. 1990;11:702–707. doi:10.1016/0142-9612(90)90031-k - DOI - PubMed

MeSH terms