. 2024 May 10;10(5):1725-1738.
doi: 10.1021/acsinfecdis.4c00086. Epub 2024 Apr 11.

Bosutinib Stimulates Macrophage Survival, Phagocytosis, and Intracellular Killing of Bacteria

Affiliations

Bosutinib Stimulates Macrophage Survival, Phagocytosis, and Intracellular Killing of Bacteria

Ronni A G da Silva et al. ACS Infect Dis. .

Abstract

Host-acting compounds are emerging as potential alternatives to combating antibiotic resistance. Here, we show that bosutinib, an FDA-approved chemotherapeutic for treating chronic myelogenous leukemia, does not possess any antibiotic activity but enhances macrophage responses to bacterial infection. In vitro, bosutinib stimulates murine and human macrophages to kill bacteria more effectively. In a murine wound infection with vancomycin-resistant Enterococcus faecalis, a single intraperitoneal bosutinib injection or multiple topical applications on the wound reduce the bacterial load by approximately 10-fold, which is abolished by macrophage depletion. Mechanistically, bosutinib stimulates macrophage phagocytosis of bacteria by upregulating surface expression of bacterial uptake markers Dectin-1 and CD14 and promoting actin remodeling. Bosutinib also stimulates bacterial killing by elevating the intracellular levels of reactive oxygen species. Moreover, bosutinib drives NF-κB activation, which protects infected macrophages from dying. Other Src kinase inhibitors such as DMAT and tirbanibulin also upregulate expression of bacterial uptake markers in macrophages and enhance intracellular bacterial killing. Finally, cotreatment with bosutinib and mitoxantrone, another chemotherapeutic in clinical use, results in an additive effect on bacterial clearance in vitro and in vivo. These results show that bosutinib stimulates macrophage clearance of bacterial infections through multiple mechanisms and could be used to boost the host innate immunity to combat drug-resistant bacterial infections.

Keywords: Src kinases targeting; antibiotic resistance; immunomodulation; macrophages; phagocytosis; wound infection.


Conflict of interest statement

The authors declare no competing financial interest.

Figures

Figure 1
Figure 1
BOS enhances macrophage killing of intracellular bacteria in vitro and in vivo. (A) Comparison of VRE CFU in RAW264.7, BMDM, THP-1, and HMDM cells treated with BOS for 15 h after initial infection of 3 h (0.52 μg/mL). (B) Comparison of VRE CFU in overnight BOS-pretreated RAW264.7 and BMDM cells. (A, B) Data shown (mean ± SEM) are summary of at least three independent experiments. (C) Comparison of VRE (left) or MRSA (right) CFU per infected wound from animals treated with a single IP injection of either vehicle (DMSO) or BOS (5 mg/kg in 30 μL of DMSO). (D) Comparison of VRE CFU per infected wound treated with five topical doses of vehicle (PBS) or BOS (0.52 μg/mL). (E) Comparison of VRE CFU per wound treated with five topical doses of vehicle or BOS with or without macrophage depletion with Clop-A. Each symbol represents one mouse, with the median indicated by the horizontal line. Data were from two independent experiments with two to five mice per experiment. Statistical analysis was performed using unpaired t test with (A, B) Welch’s corrections, (C, D) the nonparametric Mann–Whitney test to compare ranks (C, D), and (E) Kruskal–Wallis test with uncorrected Dunn’s posttest (E). For all analyses, NS denotes not significant; *P ≤ 0.05 and **P ≤ 0.01.
Figure 2
Figure 2
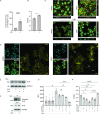
BOS stimulates macrophage phagocytosis of bacteria through actin remodeling.(A) Comparison of uptake of SYTO9-labeled VRE by RAW264.7 macrophages with or without BOS pretreatment. RAW264.7 macrophages with or without BOS pretreatment were infected for 1 h with SYTO9-labeled VRE, followed by quenching extracellular fluorescence with trypan blue, and fluorescence intensity measurement by a plate reader. (B) Comparison of VRE CFU after 1 h infection of RAW264.7 macrophages with or without BOS pretreatment. (A, B) Data (mean ± SEM) are a summary of at least three independent experiments. (C) Representative CLSM images and orthogonal views of SYTO9-labeled VRE (pink) infected RAW264.7 macrophages with and without BOS pretreatment. CytD (40 μM) was added 30 min prior to infection. Samples were stained with phalloidin for actin visualization and Hoechst 33342 for DNA visualization. (D) Representative CLSM images of DMSO (left panels) or BOS (right panels) treated RAW264.7 macrophages that were stained with phalloidin (actin) and Hoechst 33342 (no infection). White arrows point to examples of cell projections. (C, D) Images are maximum intensity projections of the optical sections (0.64 μm z-volume) and are representative of three independent experiments. Scale bar: 20 μm. (E) Western blotting analysis of SLK levels in whole-cell lysates. RAW264.7 cells with (+) and without (−) VRE infection were treated with BOS (+) or left untreated (−), and the lysates were subjected to Western blotting with anti–SLK and anti-GAPDH antibodies. (F) Immunoprecipitation of phosphorylated SLK in RAW264.7 cells following BOS treatment. RAW264.7 cells were treated with BOS (+) or left untreated (−), and cell lysates were precipitated with anti-SLK antibody, followed by Western blotting with antiphosphoserine/threonine antibody (top). Whole-cell lysates used for immunoprecipitation were subjected to Western blotting with anti–SLK and anti-GAPDH antibodies (bottom). (G) Inhibition of BOS-stimulated phagocytosis was investigated by various inhibitors. RAW264.7 macrophages with and without BOS pretreatment were infected for 1h with SYTO9-labeled VRE in the presence or absence of various inhibitors. Samples were quenched with trypan blue followed by flow cytometry. Mean fluorescence intensity (MFI) is shown for samples that were not treated (DMEM) or pretreated overnight with BOS (0.52 μg/mL), SLKi (1 μM), FMK (50 μM) alone, or in combination. CytD (40 μM) was added 30 min prior to VRE infection. (H) Inhibition of BOS-stimulated phagocytosis by various inhibitors. RAW264.7 cells were infected with VRE in the presence of BOS (0.52 μg/mL), SLKi (1 μM), and FMK (50 μM) alone or in combination. Intracellular bacterial CFU was quantified after 18h. Data (mean ± SEM) are a summary of at least three independent experiments. Statistical analysis was performed using an unpaired t test with (A, B) Welch’s corrections, using ordinary one-way ANOVA, followed by (G, H) Tukey’s multiple comparison test; NS, P > 0.05; *P ≤ 0.05, **P ≤ 0.01, and ****P ≤ 0.0001.
Figure 3
Figure 3
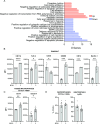
BOS induces macrophage expression of genes involved in bacterial uptake. (A) Functional enrichment analysis of DEGs induced in RAW264.7 cells after 15 h of treatment with BOS. (B, C) Comparison of mean fluorescence intensity (MFI) of CD11b, TLR4, CD36, CD206, CD14, and Dectin-1 staining gating on CD45+ RAW264.7 macrophages with or without (B) BOS treatment and CD14 and Dectin-1 on CD45+ CD11b+ F4/80+ macrophages from wounds of mice treated with an IP injection of vehicle (−) or (C) BOS (+). (B, C) Data (mean ± SEM) are a summary of at least two independent experiments with two to four mice per experiment. (D) Relative levels of macrophages and neutrophils recovered from wounds of animals following IP injection with vehicle or BOS. Data (mean ± SEM) are a summary of at least two independent experiments. Each dot represents one mouse. Statistical analysis was performed using an unpaired test with Welch’s corrections. NS, P > 0.05; *P ≤ 0.05, **P ≤ 0.01, and ***P ≤ 0.001.
Figure 4
Figure 4
BOS stimulates macrophage killing of bacteria via ROS. (A) ROS levels as measured by flow cytometry of DHR123 fluorescence. RAW264.7 macrophages were treated with BOS alone or in combination with NAC (5 mM) overnight, followed by flow cytometry. (B) ROS levels as measured by a plate reader of DCFAD fluorescence. RAW264.7 macrophages were left untreated or treated with BOS or tert-butyl hydroperoxide (TBHP, 100 μM, positive control), with or without VRE infection for 3 h. (C, D) BOS-stimulated bacterial killing by macrophages is abolished by the neutralization of ROS. RAW264.7 cells were infected with VRE in the presence of BOS (0.52 μg/mL), NAC (5 nM), or TEMPO (50 μM), alone or in combination. Intracellular bacterial CFU was quantified after 15 h. Data (mean ± SEM) are a summary of at least three independent experiments. Statistical analysis was performed using ordinary one-way ANOVA, followed by Tukey’s multiple comparison test; NS, P > 0.05; *P ≤ 0.05, **P ≤ 0.01, and ***P ≤ 0.001.
Figure 5
Figure 5
BOS promotes survival of infected macrophages. (A) Functional enrichment analysis of DEGs induced by BOS treatment of VRE-infected RAW264.7 cells. (B, C) Comparison of percentages of annexin V+ and PI+ (B) and pMLKL+ (C) cells. RAW264.7 cells were not infected or infected with VRE in the presence or absence of BOS. Cell viability was assayed by annexin V and PI staining, and expression of pMLKL was assayed by intracellular staining followed by flow cytometry. (D) NF-κB activation measurement. RAW267.4 macrophages were untreated or treated with BOS or LPS (100 ng/mL) or IL-4 (10 ng/mL) and IL-13 (10 ng/mL) for 18h prior to measurement of NF-κB-driven SEAP reporter activity. When the effect of VRE infection in RAW234.7 cells was evaluated, NF-κB-driven SEAP reporter activity was measured at the end of the intracellular infection assay with BOS treatment performed at the time of infection or prior to the start of the experiment (pretreatment). Data (mean ± SEM) are a summary of at least three independent experiments. Statistical analysis was performed using ordinary one-way ANOVA, followed by Tukey’s multiple comparison test; NS, P > 0.05; *P ≤ 0.05, **P ≤ 0.01, ***P ≤ 0.001, and ****P ≤ 0.0001.
Figure 6
Figure 6
Other SFK inhibitors also stimulate macrophage killing of bacteria.(A) Comparison of VRE CFU in RAW264.7 cells untreated or treated with various Src kinase inhibitors. Src kinase inhibitors used were: DMAT (1 μM), SARA (1 μM), DASA (1 μM), or TIR (0.33 μM). Data (mean ± SEM) are a summary of at least three independent experiments. (B) Comparison of VRE CFU in HMDM that were treated with vehicle, DMAT (1 μM), or TIR (0.33 μM). (C) Comparison of VRE CFU per infected wound of animals treated with an IP injection of DMSO, DMAT (5 mg/kg), or TIR (5 mg/kg). Data were from two independent experiments with two to three mice per experiment. Each symbol represents one mouse, with the median indicated by the horizontal line. (D) Phagocytosis of SYTO9-labeled VRE by RAW264.7 macrophages in the presence or absence of various inhibitors. Data (mean ± SEM) are a summary of at least three independent experiments. (E, F) Comparison of MFI of CD14 and Dectin-1 staining of CD45+ RAW264.7 macrophages nontreated or treated with Src kinase inhibitors. Data (mean ± SEM) are a summary of at least three independent experiments. Statistical analysis was performed using ordinary one-way ANOVA, followed by (A, E, F) the Tukey’s multiple comparison test, or using the Kruskal–Wallis test with (C) uncorrected Dunn’s posttest or (D) using unpaired t test with Welch’s corrections; NS, P > 0.05; *P ≤ 0.05, **P ≤ 0.01, and ****P ≤ 0.0001. (G, H) Comparison of (E) VRE and (F) MRSA CFU in RAW264.7 that were treated with BOS or MTX (0.515 μg/mL) or in combination. (I) Comparison of VRE CFU per infected wound of animals treated with five IP injections of vehicle (DMSO) or BOS alone or in combination with five topical treatments of MTX (0.515 μg/mL). Data were from two independent experiments with two to three mice per experiment. Each symbol represents one mouse, with the median indicated by the horizontal line. Statistical analysis was performed using ordinary one-way ANOVA, followed by (G, H) the Tukey’s multiple comparison test or using Kruskal–Wallis test with (I) uncorrected Dunn’s posttest. NS, P > 0.05; *P ≤ 0.05, **P ≤ 0.01, and ****P ≤ 0.0001.

References

    1. da Silva R. A. G.; Wong J. J.; Antypas H.; Choo P. Y.; Goh K.; Jolly S.; Liang C.; Tay Kwan Sing L.; Veleba M.; Hu G.; Chen J.; Kline K. A. Mitoxantrone targets both host and bacteria to overcome vancomycin resistance in Enterococcus faecalis. Sci. Adv. 2023, 9 (8), eadd9280.10.1126/sciadv.add9280. - DOI - PMC - PubMed
    1. Baxt L. A.; Garza-Mayers A. C.; Goldberg M. B. Bacterial subversion of host innate immune pathways. Science. 2013, 340 (6133), 697–701. 10.1126/science.1235771. - DOI - PubMed
    1. Thakur A.; Mikkelsen H.; Jungersen G. Intracellular Pathogens: Host Immunity and Microbial Persistence Strategies. J. Immunol Res. 2019, 2019, 1356540.10.1155/2019/1356540. - DOI - PMC - PubMed
    1. Rosales C.; Uribe-Querol E. Phagocytosis: A Fundamental Process in Immunity. Biomed Res. Int. 2017, 2017, 9042851.10.1155/2017/9042851. - DOI - PMC - PubMed
    1. Freeman S. A.; Grinstein S. Phagocytosis: receptors, signal integration, and the cytoskeleton. Immunol Rev. 2014, 262 (1), 193–215. 10.1111/imr.12212. - DOI - PubMed

Publication types