. 2024 Jun;11(23):e2307963.
doi: 10.1002/advs.202307963. Epub 2024 Apr 11.

Tumor Biomechanics Alters Metastatic Dissemination of Triple Negative Breast Cancer via Rewiring Fatty Acid Metabolism

Affiliations

Tumor Biomechanics Alters Metastatic Dissemination of Triple Negative Breast Cancer via Rewiring Fatty Acid Metabolism

Elysse C Filipe et al. Adv Sci (Weinh). 2024 Jun.

Abstract

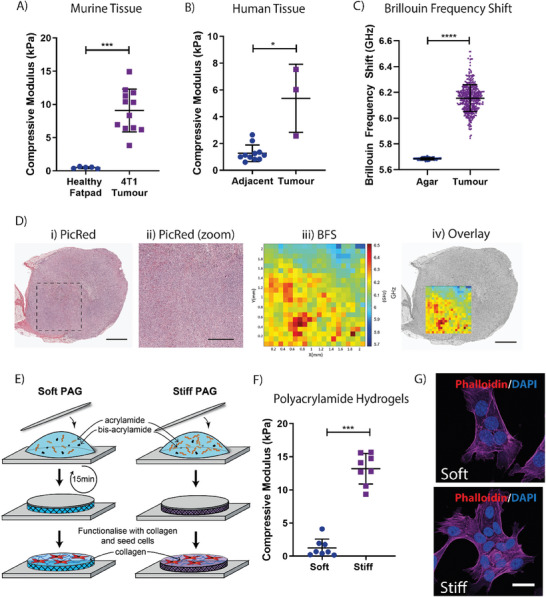
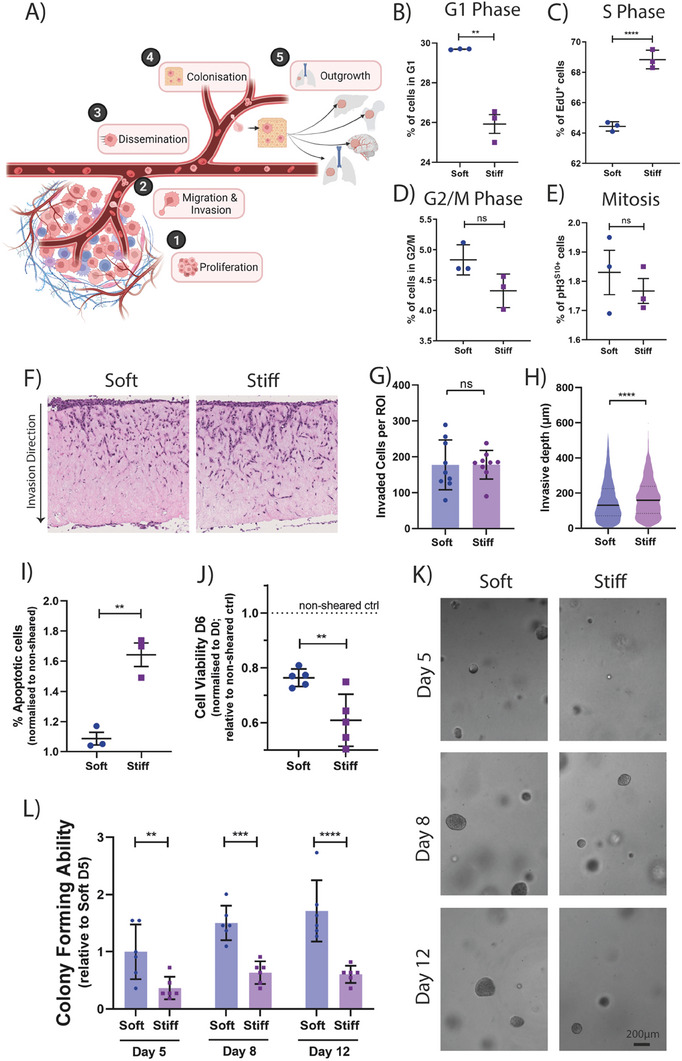
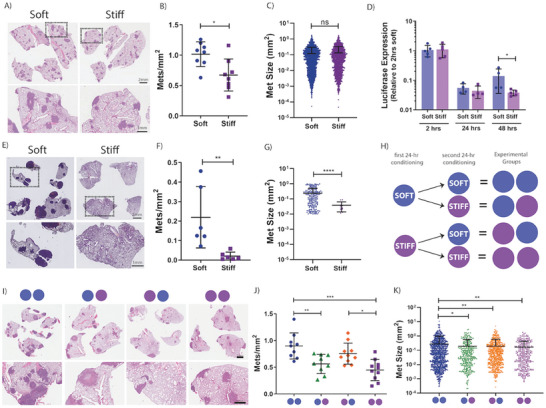
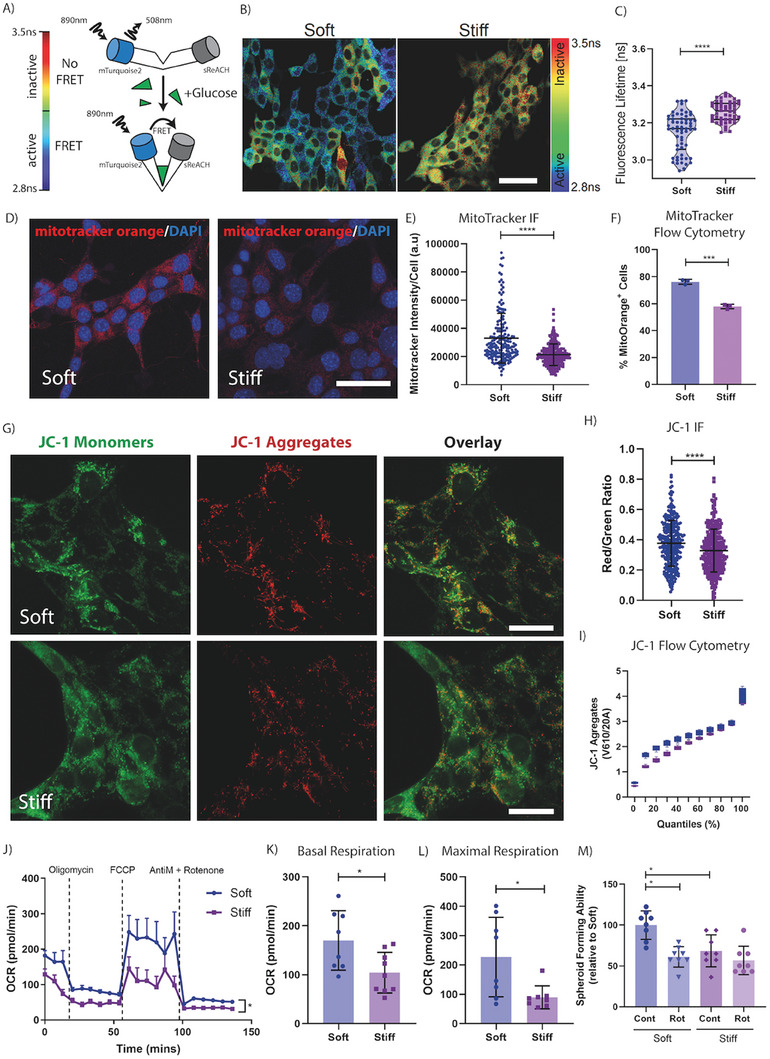
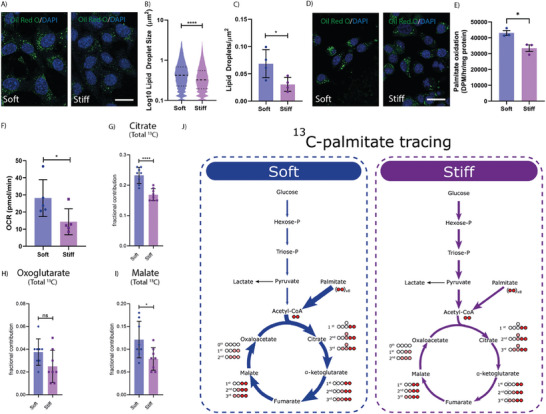
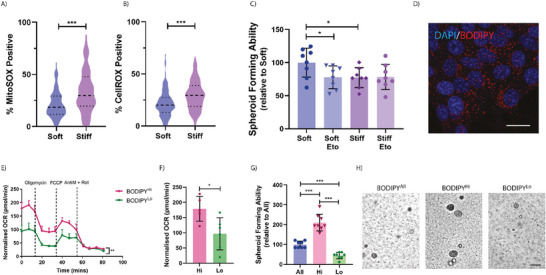
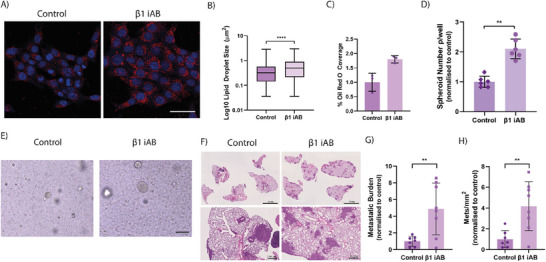
In recent decades, the role of tumor biomechanics on cancer cell behavior at the primary site has been increasingly appreciated. However, the effect of primary tumor biomechanics on the latter stages of the metastatic cascade, such as metastatic seeding of secondary sites and outgrowth remains underappreciated. This work sought to address this in the context of triple negative breast cancer (TNBC), a cancer type known to aggressively disseminate at all stages of disease progression. Using mechanically tuneable model systems, mimicking the range of stiffness's typically found within breast tumors, it is found that, contrary to expectations, cancer cells exposed to softer microenvironments are more able to colonize secondary tissues. It is shown that heightened cell survival is driven by enhanced metabolism of fatty acids within TNBC cells exposed to softer microenvironments. It is demonstrated that uncoupling cellular mechanosensing through integrin β1 blocking antibody effectively causes stiff primed TNBC cells to behave like their soft counterparts, both in vitro and in vivo. This work is the first to show that softer tumor microenvironments may be contributing to changes in disease outcome by imprinting on TNBC cells a greater metabolic flexibility and conferring discrete cell survival advantages.

Keywords: biomechanics; breast cancer; extracellular matrix; metabolism; metastasis.


Conflict of interest statement

The authors declare no conflict of interest.

Figures

Figure 1
Figure 1
Mimicking the biomechanical properties of healthy and tumor tissues in vitro. A) Biomechanical profiling of healthy murine fat pads and 4T1 murine mammary carcinoma cell generated orthotopic tumors. n = 5–12. B) Biomechanical profiling of human tumor tissues, alongside adjacent, healthy tissue. n = 3 tumor tissues, with 3–4 matched healthy tissues per patient. C) Brillouin Frequency Shift within a single 2mm2 tumor section, when compared to the control material, agar. D) i) Histological staining of mouse mammary tumor used for Brillouin Microscopy (scale bar = 1 mm); ii) zoom in of the region measured by Brillouin Microscopy (scale bar = 500 µm); iii) 2D mapping of the Brillouin frequency shift across the surface of the tumor and iv) overlay of the mapped region onto the histological cross section of the tumor (scale bar = 1 mm). Images representative of 1 tumor sample E) Schematic of polyacrylamide hydrogel pipeline, depicting the generation of soft and stiff hydrogels. F) Biomechanical profiling of the polyacrylamide hydrogels using unconfined compression. n = 8. G) Immunocytochemical staining of the actin cytoskeleton in 4T1 murine mammary carcinoma cells with Phalloidin (Magenta) and 4',6‐diamidoino‐2‐phenylindole (DAPI; Blue) seeded onto soft and stiff hydrogels. Scale bar = 50 µm. Statistical testing throughout performed using the Mann‐Whitney U test, * = p < 0.05, *** = p<0.001, **** = p < 0.0001.
Figure 2
Figure 2
Microenvironmental stiffness affects mammary carcinoma cell behavior in vitro A) Schematic of the metastatic cascade, depicting the 5 main stages of disease progression. Created with BioRender.com. B) Respective quantifications of the proportion of cells in G1, C) S Phase, D) G2/M, and E) Mitosis as measured by EdU incorporation after a single 1h pulse with EdU monomer or proportion of pHistone3 positive cells while on soft or stiff conditions. n = 3 biological repeats. F) Representative bright field image of stiffness conditioned cells invading into an organotypic collagen plug. Respective quantification of G) Number of invaded cells per region of interest (ROI) and H) Invasive depth of cells. Graphs depict one biological repeat, representative of n = 4 biological repeats. I) Proportion of apoptotic cells post shearing after conditioning on soft and stiff, normalized to the non‐sheared controls. n = 3 biological repeats. J) Cell viability of sheared cells at 6 days post shearing, normalized to day 0 cell number and relative to non‐sheared controls. Graph depicts one biological repeat, representative of n = 3 biological repeats. K) Representative bright field images of stiffness preconditioned 4T1 cells embedded in a 3D matrix on day 5, 8, and 12 of culture. Scale bar = 500 µm. L) Relative quantification of the spheroid forming ability of stiffness preconditioned 4T1 cells. Graph depicts one biological repeat, representative of n = 4 biological repeats. Statistical testing performed using Mann‐Whitney U. Statistical testing performed using two‐sided unpaired t‐tests throughout, unless specified otherwise ** = p < 0.01, *** = p < 0.001, **** = p < 0.0001.
Figure 3
Figure 3
Biomechanical properties of the microenvironment affect metastatic capacity in vivo. A) Representative hematoxylin & eosin (H&E) image of murine lungs, 3 weeks after intravenous injection of stiffness preconditioned 4T1 mammary carcinoma cells. B) Quantification of the number of metastatic lesions/mm2 of lung tissue. Quantification from 3 stepped sections per mouse, n = 8 mice per group. C) Distribution plot of metastatic lesion size. D) Relative cancer cell abundance in the lungs of mice at 2 h, 24 h, and 48 h post intravenous injection of stiffness preconditioned 4T1 mammary carcinoma cells, as measured by multiplex quantitative polymerase chain reaction (qPCR). n = 4–5 mice per group, per time point. E) Representative H&E image of murine lungs, 3 weeks after intravenous injection of stiffness preconditioned E0771 cells. F) Quantification of the number of metastatic lesions/mm2 of lung tissue. Quantification from 3 stepped sections per mouse, n = 6 mice per group. G) Distribution plot of metastatic lesion size. H) Visual representation of the experimental design from our flip‐stiffness study. I) Representative H&E image of murine lungs, 3 weeks after intravenous injection of stiffness preconditioned 4T1 mammary carcinoma cells, as per experimental design in H). J) Quantification of the number of metastatic lesions/mm2 of lung tissue. Statistical testing performed using a one‐way ANOVA. Quantification from 3 stepped sections per mouse, n = 9‐10 mice per group. K) Distribution plot of metastatic lesion size. Statistical testing performed using a one‐way ANOVA. Statistical testing performed using the Mann‐Whitney U test throughout, unless indicated otherwise * = p<0.05, ** = p < 0.01, *** = p < 0.001, **** = p < 0.0001.
Figure 4
Figure 4
Biomechanical properties of the microenvironment affect mitochondrial respiration. A) Schematic of the glucose biosensor transfected into our 4T1 cell line, representing the active and inactive conformations and their respective heatmap ranges, with blue/green cells indicating high glucose uptake and yellow/red indicative of low glucose levels. B) Representative fluorescence lifetime imaging (FLIM)‐FRET image of our 4T1 cells cultured directly on the soft and stiff microenvironments. Scale bar = 50 µm. C) Quantification of the fluorescence lifetime of each cell on the soft or stiff microenvironments. Graph depicts one biological repeat, representative of n = 3 biological repeats. D) Representative fluorescence image of 4T1 cells, stained with MitoTracker orange, on soft and stiff microenvironments. Scale bar = 50 µm. E) Quantification of MitoTracker orange intensity/cell from the immunofluorescent images. Graph depicts one biological repeat, representative of n = 2 biological repeats. F) Quantification of MitoTracker positivity as measured by flow cytometry. Graph depicts one biological repeat, representative of n = 2 biological repeats. Statistical testing performed using a two‐sided unpaired t‐test with Welches correction. G) Representative images of 4T1 cells on soft or stiff microenvironments, stained with mitochondrial dye JC‐1. Imaging of JC‐1 monomers (Green), aggregates (Red) and overlayed. Scale bar = 25 µm. H) Quantification of the red/green JC‐1 ratio per cell from the immunofluorescence images. Graph depicts one biological repeat, representative of n = 2 biological repeats. I) Quantification of JC‐1 aggregate+ population as measured by flow cytometry with cells binned into quantiles based on the JC‐1 aggregate levels. Graph depicts one biological repeat, representative of n = 2 biological repeats. Statistical testing performed using the Kolmogorov‐Smirnov test, with p < 1E‐10. J) Seahorse bioanalyzer plot for 4T1 mammary carcinoma cells, preconditioned on soft or stiff microenvironments with equal numbers embedded in a 3D alginate hydrogel bead. Statistical testing performed with a two‐way ANOVA. Including quantification of K) Basal respiration and L) Maximal respiration values. M) Relative quantification of spheroid forming ability of stiffness preconditioned 4T1 cells, with and without oxidative phosphorylation inhibitor Rotenone (Rot). Graph depicts one biological repeat, representative of n = 3 biological repeats. Statistical testing performed using the Mann‐Whitney U test throughout, unless indicated otherwise * = p < 0.05, *** = p < 0.001, **** = p < 0.0001.
Figure 5
Figure 5
Cells on soft have altered cellular metabolism. A) Representative Oil Red O staining of 4T1 cancer cells cultured directly on soft or stiff microenvironments. Oil Red O (Green) and DAPI (Blue), scale bar = 50 µm. Quantification of B) Lipid droplet size and C) Lipid droplet coverage from the immunostaining images, both indicators of the extent of lipid accumulation within the cytoplasm. Graphs depicts one biological repeat, representative of n = 2 biological repeats. D) Representative Oil Red O staining of E0771 cancer cells cultured directly on soft or stiff microenvironments. Oil Red O (Green) and DAPI (Blue), scale bar = 50 µm. E) Radioactive 14C Palmitate experiments demonstrating an increase in palmitate oxidation in the soft primed cells. n = 3 biological repeats. Statistical testing using a two‐sided unpaired t‐test. F) Quantification of basal respiration values between soft and stiff preconditioned cells, during the fatty acid seahorse stress test. Quantification of the Overall 13C enrichment of intermediate abundances of G) Citrate, H) Oxoglutarate, and I) Malate between the soft and stiff conditions. n = 4 biological repeats. Statistical testing using two‐sided unpaired t‐tests. J) Schematic representation of uniformly labeled C13‐Palmitate tracing study results, depicting an increase in citric acid cycle intermediates in the soft condition. Statistical testing performed using the Mann‐Whitney U test throughout, unless stated otherwise * = p < 0.05, **** = p < 0.0001.
Figure 6
Figure 6
Increased spheroid forming capacity is driven by enhanced fatty acid oxidation. Quantification of the percent A) MitoSOX and B) CellROX positive cells within a population of stiffness preconditioned 4T1 cancer cells embedded in a 3D matrix. Graphs depict one biological repeat, representative of n = 3 biological repeats. C) Relative quantification of the spheroid forming ability of stiffness preconditioned 4T1 cells, with and without fatty acid oxidation inhibitor Etomoxir (Eto). Graph depicts one biological repeat, representative of n = 3 biological repeats. D) Representative fluorescence image of cells on soft, stained with BODIPY, and counterstained with DAPI. Scale Bar = 25 µm. E) Seahorse bioanalyzer plot of the lipid stress test on BODIPYHi and BODIPYLo cell populations. Statistical testing performed using a two‐way ANOVA and F) Quantification of the basal respiration values. G) Relative quantification of the spheroid forming ability of the BODIPYHi, BODPYLo, and BODIPYAll populations. Graph depicts one biological repeat, representative of n = 3 biological repeats. H) Representative images of spheroid formation at day 5. Scale Bar = 50 µm. Statistical testing performed using the Mann‐Whitney U test throughout, unless stated otherwise * = p < 0.05, *** = p < 0.001.
Figure 7
Figure 7
Integrin β1 Inhibitory antibody increases metastatic potential. A) Representative Oil Red O Staining of 4T1 cells on stiff microenvironments, when compared to stiff microenvironments with the inhibitory antibody against Integrin β1 (β1 iAB). Oil Red O (Red) and DAPI (Blue). Scale Bar = 25 µm. Quantification of B) Lipid droplet size and C) ORO coverage in these same conditions. Graphs depict one biological repeat, representative of n = 2 biological repeats. D) Quantification of spheroid formation in stiff conditioned cells when compared to stiff conditioned + β1 iAB. Graph depicts one biological repeat, representative of n = 3 biological repeats. Statistical testing performed using Mann‐Whitney U test. E) Representative images of spheroid sizes at day 5, comparing spheroid forming efficiency between stiff conditioned control cells and stiff + β1 iAB. Scale Bar = 50 µm. F) Representative images of murine lungs at 2 weeks post injection of stiff control and stiff + β1 iAB cells. Respective quantification of the G) Metastatic burden and H) Number of metastatic lesions per mm2 of lung tissue. n = 7‐8. Statistical testing performed using two‐sided unpaired t‐tests throughout, unless indicated otherwise ** = p < 0.01, **** = p < 0.0001.

References

    1. Cox T. R., Nat. Rev. Cancer 2021, 21, 217. - PubMed
    1. Butcher D. T., Alliston T., Weaver V. M., Nat. Rev. Cancer 2009, 9, 108. - PMC - PubMed
    1. Er E. E., Tello‐Lafoz M., Huse M., Cancer Res 2022, 82, 3409. - PMC - PubMed
    1. Levental K. R., Yu H., Kass L., Lakins J. N., Egeblad M., Erler J. T., Fong S. F. T., Csiszar K., Giaccia A., Weninger W., Yamauchi M., Gasser D. L., Weaver V. M., Cell 2009, 139, 891. - PMC - PubMed
    1. Boyd N. F., Li Q., Melnichouk O., Huszti E., Martin L. J., Gunasekara A., Mawdsley G., Yaffe M. J., Minkin S., PLoS One 2014, 9, e100937. - PMC - PubMed

LinkOut - more resources