. 2024 Apr 16;121(16):e2318155121.
doi: 10.1073/pnas.2318155121. Epub 2024 Apr 11.

Formation of recurring transient Ca2+-based intercellular communities during Drosophila hematopoiesis

Affiliations

Formation of recurring transient Ca2+-based intercellular communities during Drosophila hematopoiesis

Saar Ben David et al. Proc Natl Acad Sci U S A. .

Abstract

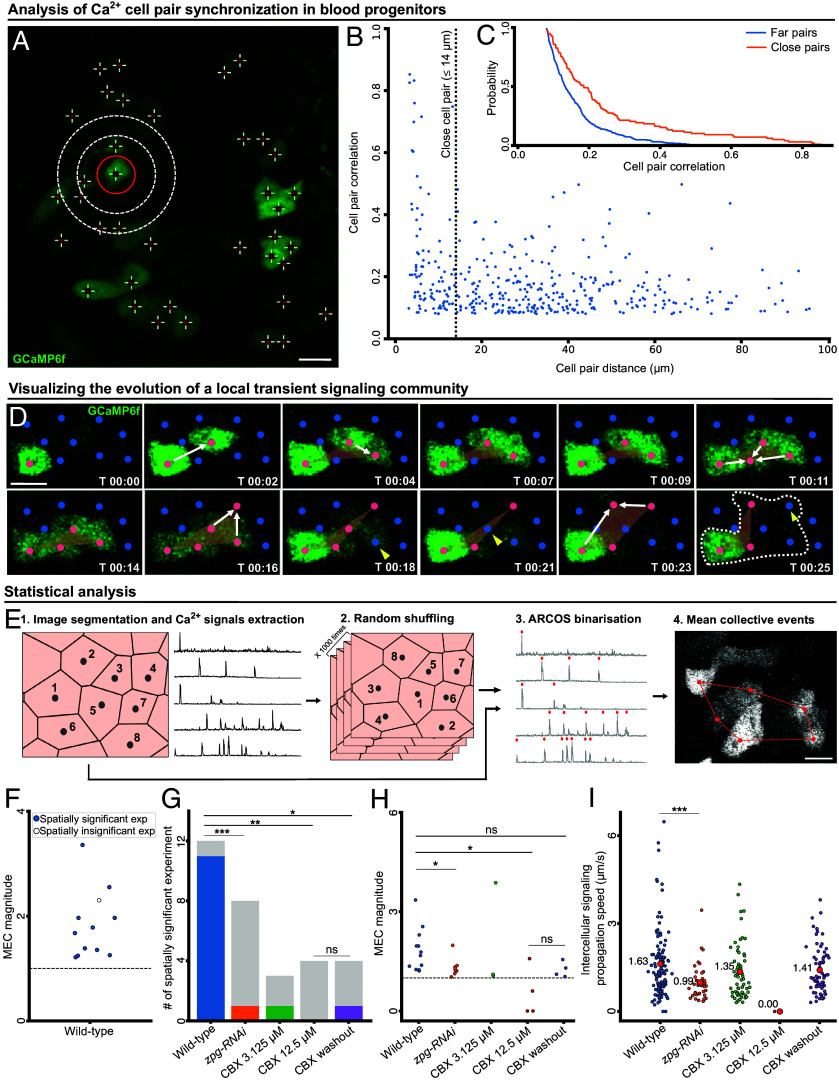
Tissue development occurs through a complex interplay between many individual cells. Yet, the fundamental question of how collective tissue behavior emerges from heterogeneous and noisy information processing and transfer at the single-cell level remains unknown. Here, we reveal that tissue scale signaling regulation can arise from local gap-junction mediated cell-cell signaling through the spatiotemporal establishment of an intermediate-scale of transient multicellular communication communities over the course of tissue development. We demonstrated this intermediate scale of emergent signaling using Ca2+ signaling in the intact, ex vivo cultured, live developing Drosophila hematopoietic organ, the lymph gland. Recurrent activation of these transient signaling communities defined self-organized signaling "hotspots" that gradually formed over the course of larva development. These hotspots receive and transmit information to facilitate repetitive interactions with nonhotspot neighbors. Overall, this work bridges the scales between single-cell and emergent group behavior providing key mechanistic insight into how cells establish tissue-scale communication networks.

Keywords: Drosophila hematopoiesis; calcium signaling; cell–cell communication; multicellular synchronization; quantitative live imaging.


Conflict of interest statement

Competing interests statement:The authors declare no competing interest.

Figures

Fig. 1.
Fig. 1.
Blood progenitor cell–cell communication forms communities of propagative Ca2+ signaling. (A) Representative confocal image showing Ca2+ signaling activities in blood progenitors of a LG visualized using GCaMP6f (in green). Red crosses indicate the center of individual cells. White circles indicate adjacent blood progenitors to the cell marked by the red circle, at distances of 7 µm and 14 µm from it correspondingly (Movie S1). (Scale bar: 10 µm.) (B) Spatial analysis of blood progenitor pairs that showed a statistically significant correlation (P < 0.05) in their temporal Ca2+ signals. Each data point (blue) represents a cell pair. Cell pairs Ca2+ Pearson correlation was correlated with the cell pairs distance. Ncells = 57, Npairs = 385, Pearson correlation between cell pair Ca2+ correlation and distance = −0.244, P-value = 0.003. See also SI Appendix, Fig. S1A for an analysis of all cell pairs. (C) Cumulative distribution of Pearson correlation of the close (orange; N = 98, µ = 0.246, σ = 0.187) and far (blue; N = 287, µ = 0.160, σ = 0.084), significantly Ca2+ correlated blood progenitor pairs (same pairs as in B). Each value Fg(x) in the plot is the probability of a pair in group g to have a Pearson correlation coefficient greater than x. The Kruskal–Wallis statistical test verified a significant difference between the two distributions (P-value < 0.0001). See also SI Appendix, Fig. S1B for an analysis of all cell pairs. (D) Representative confocal images showing a Ca2+ signaling propagation event, detected by ARCOS, which defined a transient community involving six blood progenitors (Results and Materials and Methods). GCaMP6f is labeled in green. The center of each cell is marked in red (active, i.e., showing Ca2+ influx) or blue (inactive). Time (T, in second) is annotated in each frame. Orange polygons visualize the cell centers transiently participating in a community in each frame. White arrows indicate the inclusion of new activated cells in the community, yellow arrowheads indicate the deactivation and exclusion of cells from the community. All the cells that participate in the community throughout its evolution are marked in the last frame (T = 00:25) in a dashed white polygon. (Scale bar: 5 µm.) (E) Schematic of the spatial shuffling analysis (Materials and Methods). (1) Single-cell segmentation and extraction of Ca2+ time series. (2) Random spatial shuffling of the Ca2+ time series of all cells, repeated 1,000 times, correspondingly generating spatially permuted experiments. (3) ARCOS binarization: Ca2+ peak detection (red). (4) ARCOS community detection (red, white is GCaMP6f). Recording of the mean collective events per cell (MEC) and statistical comparison of MEC for observed versus in silico permuted experiments. (Scale bar: 5 µm.) (F) Analysis of MEC magnitude (N = 12 LGs). Ratio between MEC of the observed and the average MEC among its in silico permuted experiments. The ratio of value 1 (dashed horizontal line) implies no change in the magnitude. The bootstrapping significance test showed spatial significance for 11/12 LGs (color-filled circles). The one LG that was deemed insignificant had the fewest cells and transient communities making it more sensitive in terms of the MEC magnitude and the statistical significance. See SI Appendix, Fig. S5 for full analysis of all 12 LGs. (GI) Gap junction inhibition experiments. Wild-type LGs (N = 12), RNAi-mediated zpg knockdown (N = 8), 3.125 µM CBX (N = 3), 12.5 µM CBX (N = 4), and CBX washout (N = 4). Statistical analyses: *P < 0.05, **P < 0.01, ***P < 0.001, ****P < 0.0001. (G) Spatially significant experiments. For each experimental condition, gray indicates the number of insignificant and color indicates the number of significant LGs. Significance was determined using Fisher’s exact test. (H) Analysis of MEC magnitude. Each data point corresponds to one LG. Significance was determined using the Kruskal–Wallis test to evaluate the differences between the wild-type and the other conditions. (I) Analysis of intercellular signaling propagation speed between adjacent cells in a community. Each data point (red) represents the average cell–cell signaling propagation speed calculated according to the relative activation timing between adjacent pairs in each transient community (Materials and Methods). Wild-type (N = 113 communities, mean information spread µ = 1.63 µm/s), RNAi-mediated zpg knockdown (N = 39, µ = 0.99 µm/s), 3.125 µM CBX (N = 62, µ = 1.35 µm/s), 12.5 µM CBX (N = 1, µ = 0 µm/s), and CBX washout (N = 71, µ = 1.41 µm/s). This analysis was performed to experiments that were imaged with temporal resolution of 2.32 to 4 s per frame (Materials and Methods), including 1/4 CBX 12.5 µM experiments (an experiment that did not exhibit communities, and therefore was not appropriate for statistical testing). Statistical significance was determined using the Kruskal–Wallis test to evaluate the differences between the wild-type and the other conditions.
Fig. 2.
Fig. 2.
Recurrent activation of communities forms hotspots that act as local information hubs. (A) Representative time-lapse images showing the formation of hotspots over time. A hotspot is defined by recurring transient communities (Materials and Methods). Top panels: transient communities (marked by colored polygons, red dots mark activated blood progenitors) in a wild-type LG. Bottom panels: the integrated number of transient communities over time. Each white dot represents an individual blood progenitor. Each panel corresponds to its matching Top panel. (Scale bar: 15 µm.) (B) Single-cell Voronoi tessellation, corresponding to the yellow region of interest shown in panels (C) and (D), and illustrating the bootstrapping-based in silico permutation experiment (Materials and Methods). The color of each cell (polygon) reflects the number of activations (i.e., Ca2+spikes) each cell exhibits. Six cells that participate in a hotspot are numbered and dashed color-matched arrows indicate cell swapping. The swapping is performed for cell pairs with similar activation, where one cell is within and the other outside the hotspot (Materials and Methods). (C and D) Representative field of view showing the integrated number of transient communities each cell participated in over time (#ARCOS events) before (C) and after (D) in silico permutation [see (B)]. Green circles: the center location of each blood progenitor. Brighter areas indicate more occurrences of communities. The yellow region of interest marks the hotspot that is also shown in (B). (E) Hotspot statistics. Hotspots were pooled across experiments according to the experimental condition. Dashed line—pooled number of hotspots. Gray—pooled number of hotspots with sufficient data for statistical analysis. Blue—number of statistically significant validated hotspots. Hotspot significance was determined according to 100 to 1,000 different in silico permutation experiments with a bootstrapping significance threshold of 0.05. (F) Time-lapse evolution of a representative hotspot. The hotspot was defined according to the integrated number of transient communities per cell across the experiment (red polygon; see Materials and Methods). Transient communities involve cells within and outside the hotspot. GCaMP6f labeled in green. (Scale bar: 5 µm.) (G) The probability of hotspot cells interacting with cells outside the hotspot through common transient communities as a function of the hotspot’s size (i.e., the number of cells in the hotspot). The analysis included the eight statistically verified hotspots pooled across all wild-type LGs. (H) Histogram of the number of hotspot cells (x-axis) and nonhotspot cells (y-axis) in communities that define the hotspots—each observation used for this histogram is defined by a community. White diagonal (y=x) indicates an equal proportion between hotspot to nonhotspot cells.
Fig. 3.
Fig. 3.
Gradual formation of communication communities during development. (A) LG development throughout Drosophila larval stages (Materials and Methods). Differentiation and mitotic activities of blood progenitors across the three stages are summarized in the table. (BD) Analyses of wild-type LGs from the late-second instar stage (N = 4), early-third instar stage (N = 5), and mid-third instar stage (N = 12). (B) Number of spatially significant experiments. For each experimental condition, gray indicates the number of insignificant and color indicates the number of significant LGs. Significance was determined using Fisher’s exact test. (C) MEC magnitude. Each data point corresponds to a single LG. Significance was determined using the Kruskal–Wallis test to evaluate the differences between the different developmental stages. (D) Hotspots statistics. Dashed line—pooled number of hotspots. Gray—pooled number of hotspots with sufficient data for statistical analysis. Blue—number of statistically significant validated hotspots. Hotspot significance was determined according to 100 to 1,000 different in silico permutation experiments with a bootstrapping significance threshold of 0.05. (EG) Analyses of RNAi-mediated zpg knockdown LGs from late-second instar stage (N = 3), early-third instar stage (N = 4), and mid-third instar stage (N = 8). (E) Quantification of the number of spatially significant experiments in blood progenitors. See (B). (F) Analysis of MEC magnitude. See (C). (G) Number of validated hotspots per developmental stage. See panel (D).

Similar articles

Cited by

References

    1. Julicher F., Eaton S., Emergence of tissue shape changes from collective cell behaviours. Semin. Cell Dev. Biol. 67, 103–112 (2017). - PubMed
    1. Mayor R., Etienne-Manneville S., The front and rear of collective cell migration. Nat. Rev. Mol. Cell Biol. 17, 97–109 (2016). - PubMed
    1. Bassler B. L., How bacteria talk to each other: Regulation of gene expression by quorum sensing. Curr. Opin. Microbiol. 2, 582–587 (1999). - PubMed
    1. Surette M. G., Miller M. B., Bassler B. L., Quorum sensing in Escherichia coli, Salmonella typhimurium, and Vibrio harveyi: A new family of genes responsible for autoinducer production. Proc. Natl. Acad. Sci. U.S.A. 96, 1639–1644 (1999). - PMC - PubMed
    1. Capuana L., Bostrom A., Etienne-Manneville S., Multicellular scale front-to-rear polarity in collective migration. Curr. Opin. Cell Biol. 62, 114–122 (2020). - PubMed

Substances

LinkOut - more resources