

Lung Ultrasound and High-Resolution Computed Tomography in Suspected COVID-19 Patients Admitted to the Emergency Department: A Comparison
- PMID: 38603205
- PMCID: PMC9892814
- DOI: 10.1177/87564793221147496
Lung Ultrasound and High-Resolution Computed Tomography in Suspected COVID-19 Patients Admitted to the Emergency Department: A Comparison
Abstract
Objective: To analyze the diagnostic accuracy of lung ultrasonography (LUS) and high-resolution computed tomography (HRCT), to detect COVID-19.
Materials and methods: This study recruited all patients admitted to the emergency medicine unit, due to a suspected COVID-19 infection, during the first wave of the COVID-19 pandemic. These patients also who underwent a standardized LUS examination and a chest HRCT. The signs detected by both LUS and HRCT were reported, as well as the sensitivity, specificity, positive predictive value, and negative predictive value for LUS and HRCT.
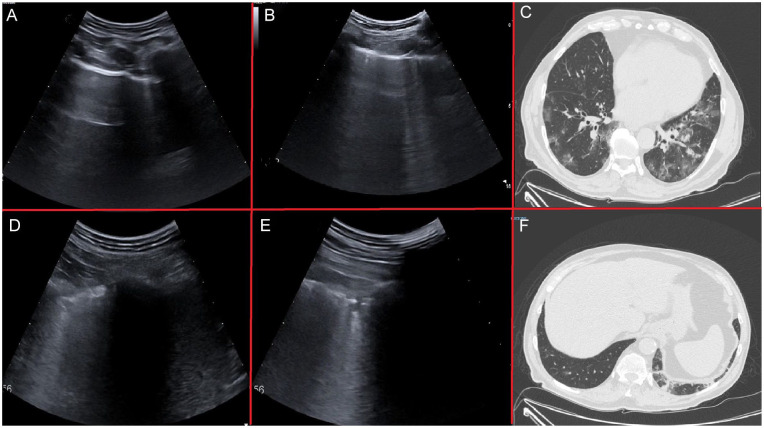
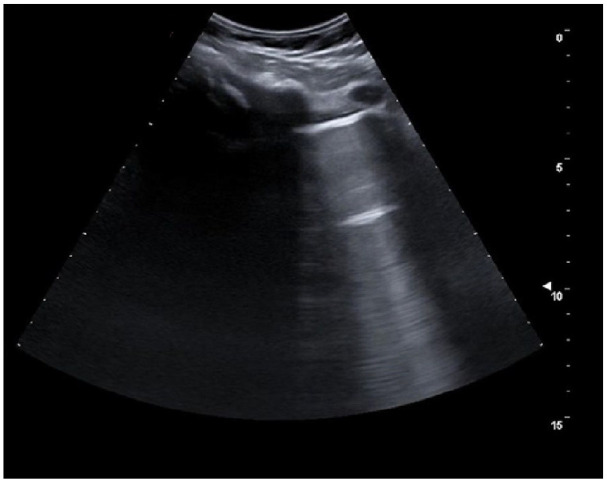
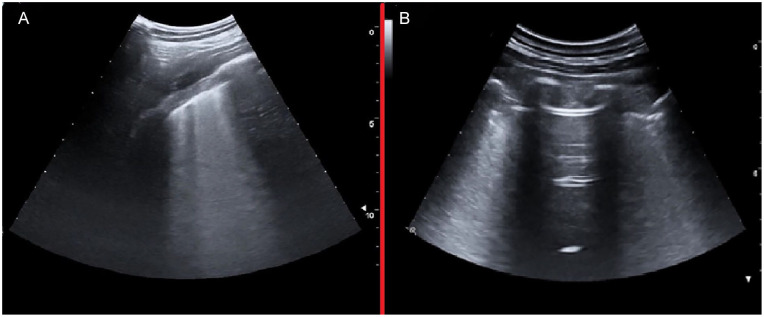
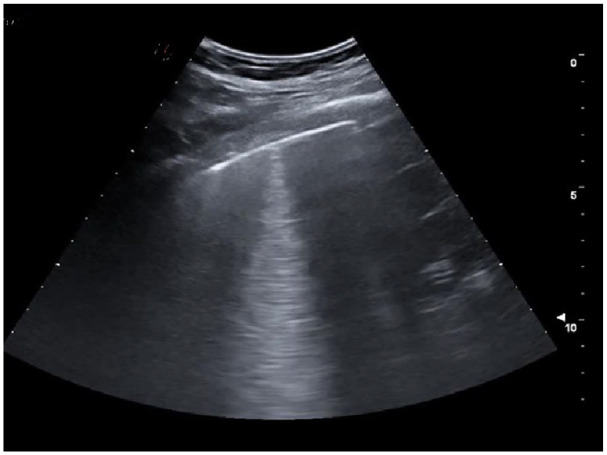
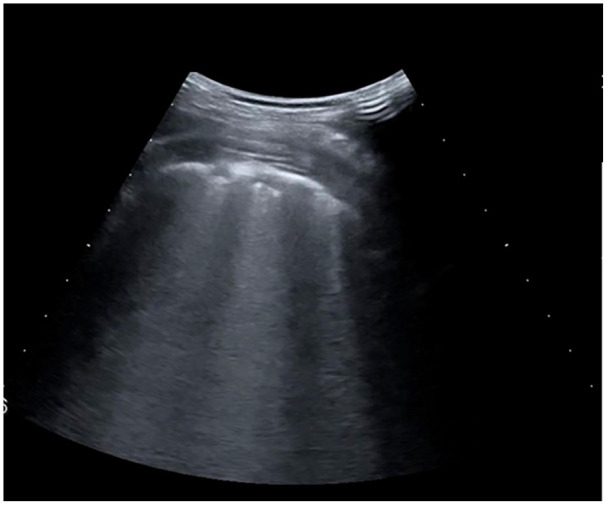
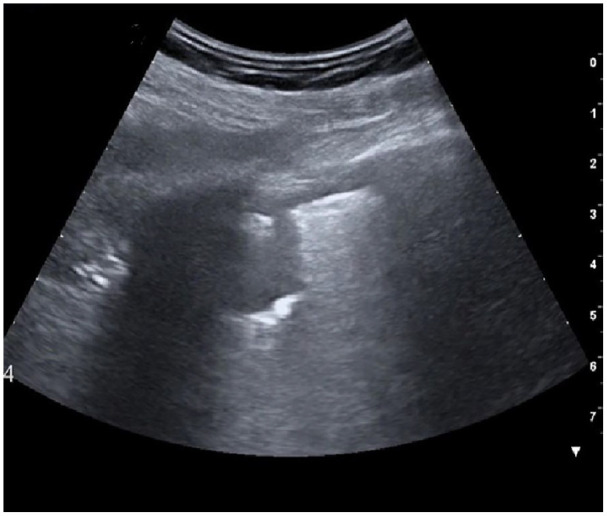
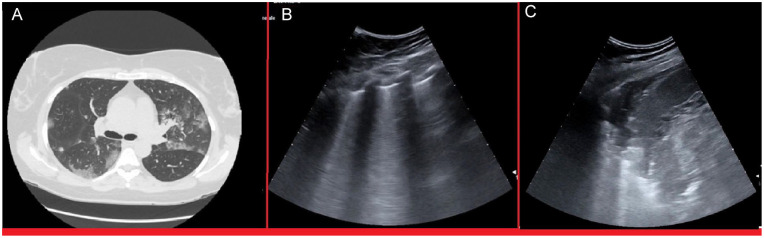
Results: This cohort included 159 patients, 101 (63%) were diagnosed with COVID-19. COVID-19 patients showed more often confluent subpleural consolidations and parenchymal consolidations in lower lung regions of LUS. They also had "ground glass" opacities and "crazy paving" on HRCT, while pleural effusion and pulmonary consolidations were more common in non-COVID-19 patients. LUS had a sensitivity of 0.97 (95% CI 0.92-0.99) and a specificity of 0.24 (95% CI 0.07-0.5) for COVID-19 lung infections. HRCT abnormalities resulted in a 0.98 sensitivity (95% CI 0.92-0.99) and 0.1 specificity (95% CI 0.04-0.23) for COVID-19 lung infections.
Conclusion: In this cohort, LUS proved to be a noninvasive, diagnostic tool with high sensitivity for lung abnormalities that were likewise detected by HRCT. Furthermore, LUS, despite its lower specificity, has a high sensitivity for COVID-19, which could prove to be as effective as HRCT in excluding a COVID-19 lung infection.
Keywords: COVID-19; lung diseases; lung infiltrates; lung ultrasonography.
© The Author(s) 2023.
Conflict of interest statement
The authors declared no potential conflicts of interest with respect to the research, authorship, and/or publication of this article.
Figures
Similar articles
-
Lung Ultrasonography Is an Acceptable Imaging Modality to Diagnose COVID-19 and Effectively Correlates with HRCT Chest-A Prospective Study.Diagnostics (Basel). 2023 Jun 16;13(12):2091. doi: 10.3390/diagnostics13122091. Diagnostics (Basel). 2023. PMID: 37370986 Free PMC article.
-
Low Sensitivity of Admission Lung US Compared to Chest CT for Diagnosis of Lung Involvement in a Cohort of 82 Patients with COVID-19 Pneumonia.Medicina (Kaunas). 2021 Mar 4;57(3):236. doi: 10.3390/medicina57030236. Medicina (Kaunas). 2021. PMID: 33806432 Free PMC article.
-
Correlation between Chest Computed Tomography and Lung Ultrasonography in Patients with Coronavirus Disease 2019 (COVID-19).Ultrasound Med Biol. 2020 Nov;46(11):2918-2926. doi: 10.1016/j.ultrasmedbio.2020.07.003. Epub 2020 Jul 13. Ultrasound Med Biol. 2020. PMID: 32771222 Free PMC article.
-
Diagnostic Imaging in Newborns, Children and Adolescents Infected with Severe Acute Respiratory Syndrome Coronavirus 2 (SARS-CoV-2): Is There a Realistic Alternative to Lung High-Resolution Computed Tomography (HRCT) and Chest X-Rays? A Systematic Review of the Literature.Ultrasound Med Biol. 2021 Nov;47(11):3034-3040. doi: 10.1016/j.ultrasmedbio.2021.07.015. Epub 2021 Jul 24. Ultrasound Med Biol. 2021. PMID: 34429231 Free PMC article.
-
The reliability of lung ultrasound in assessment of idiopathic pulmonary fibrosis.Clin Interv Aging. 2018 Mar 22;13:437-449. doi: 10.2147/CIA.S156615. eCollection 2018. Clin Interv Aging. 2018. PMID: 29606857 Free PMC article. Review.
References
-
- van’t Hoog A, Viney K, Biermann O, Yang B, Leeflang MMG, Langendam MW: Symptom- and chest-radiography screening for active pulmonary tuberculosis in HIV-negative adults and adults with unknown HIV status. Cochrane Database Syst Rev. 2022;3(30):CD010890. doi:10.1002/14651858.CD010890.pub2. - DOI - PMC - PubMed
LinkOut - more resources
Full Text Sources