

Prioritization of oligogenic variant combinations in whole exomes
- PMID: 38603604
- PMCID: PMC11037482
- DOI: 10.1093/bioinformatics/btae184
Prioritization of oligogenic variant combinations in whole exomes
Abstract
Motivation: Whole exome sequencing (WES) has emerged as a powerful tool for genetic research, enabling the collection of a tremendous amount of data about human genetic variation. However, properly identifying which variants are causative of a genetic disease remains an important challenge, often due to the number of variants that need to be screened. Expanding the screening to combinations of variants in two or more genes, as would be required under the oligogenic inheritance model, simply blows this problem out of proportion.
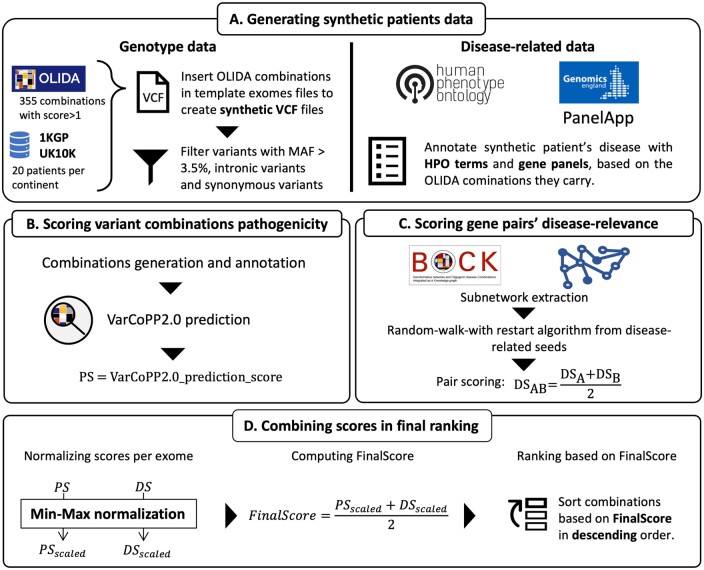
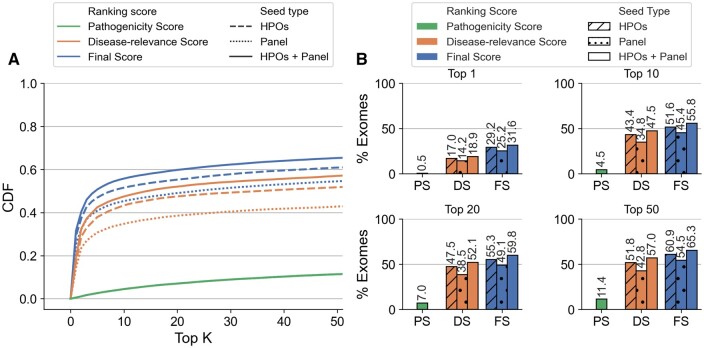
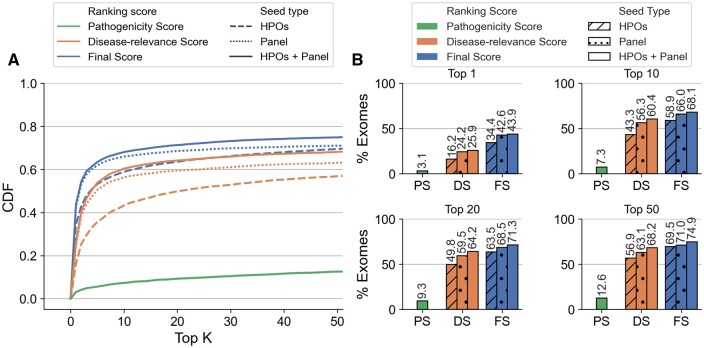
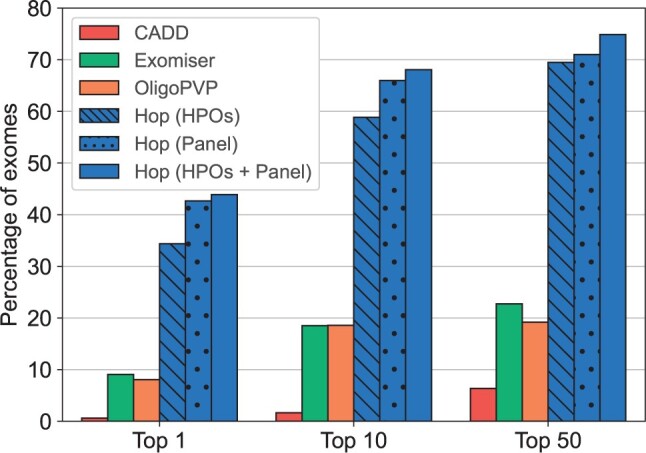
Results: We present here the High-throughput oligogenic prioritizer (Hop), a novel prioritization method that uses direct oligogenic information at the variant, gene and gene pair level to detect digenic variant combinations in WES data. This method leverages information from a knowledge graph, together with specialized pathogenicity predictions in order to effectively rank variant combinations based on how likely they are to explain the patient's phenotype. The performance of Hop is evaluated in cross-validation on 36 120 synthetic exomes for training and 14 280 additional synthetic exomes for independent testing. Whereas the known pathogenic variant combinations are found in the top 20 in approximately 60% of the cross-validation exomes, 71% are found in the same ranking range when considering the independent set. These results provide a significant improvement over alternative approaches that depend simply on a monogenic assessment of pathogenicity, including early attempts for digenic ranking using monogenic pathogenicity scores.
Availability and implementation: Hop is available at https://github.com/oligogenic/HOP.
© The Author(s) 2024. Published by Oxford University Press.
Conflict of interest statement
None declared.
Figures
Similar articles
-
A genome-wide case-only test for the detection of digenic inheritance in human exomes.Proc Natl Acad Sci U S A. 2020 Aug 11;117(32):19367-19375. doi: 10.1073/pnas.1920650117. Epub 2020 Jul 27. Proc Natl Acad Sci U S A. 2020. PMID: 32719112 Free PMC article.
-
An Improved Phenotype-Driven Tool for Rare Mendelian Variant Prioritization: Benchmarking Exomiser on Real Patient Whole-Exome Data.Genes (Basel). 2020 Apr 23;11(4):460. doi: 10.3390/genes11040460. Genes (Basel). 2020. PMID: 32340307 Free PMC article.
-
OligoPVP: Phenotype-driven analysis of individual genomic information to prioritize oligogenic disease variants.Sci Rep. 2018 Oct 2;8(1):14681. doi: 10.1038/s41598-018-32876-3. Sci Rep. 2018. PMID: 30279426 Free PMC article.
-
Diagnosing rare diseases after the exome.Cold Spring Harb Mol Case Stud. 2018 Dec 17;4(6):a003392. doi: 10.1101/mcs.a003392. Print 2018 Dec. Cold Spring Harb Mol Case Stud. 2018. PMID: 30559314 Free PMC article. Review.
-
Added Value of Reanalysis of Whole Exome- and Whole Genome Sequencing Data From Patients Suspected of Primary Immune Deficiency Using an Extended Gene Panel and Structural Variation Calling.Front Immunol. 2022 Jun 30;13:906328. doi: 10.3389/fimmu.2022.906328. eCollection 2022. Front Immunol. 2022. PMID: 35874679 Free PMC article. Review.
Cited by
-
Oligogenic analysis across broad phenotypes of 46,XY differences in sex development associated with NR5A1/SF-1 variants: findings from the international SF1next study.EBioMedicine. 2025 Mar;113:105624. doi: 10.1016/j.ebiom.2025.105624. Epub 2025 Mar 3. EBioMedicine. 2025. PMID: 40037090 Free PMC article.
