. 2024 Jun 26;200(1):95-113.
doi: 10.1093/toxsci/kfae052.

House dust-derived mixtures of organophosphate esters alter the phenotype, function, transcriptome, and lipidome of KGN human ovarian granulosa cells

Affiliations

House dust-derived mixtures of organophosphate esters alter the phenotype, function, transcriptome, and lipidome of KGN human ovarian granulosa cells

Xiaotong Wang et al. Toxicol Sci. .

Abstract

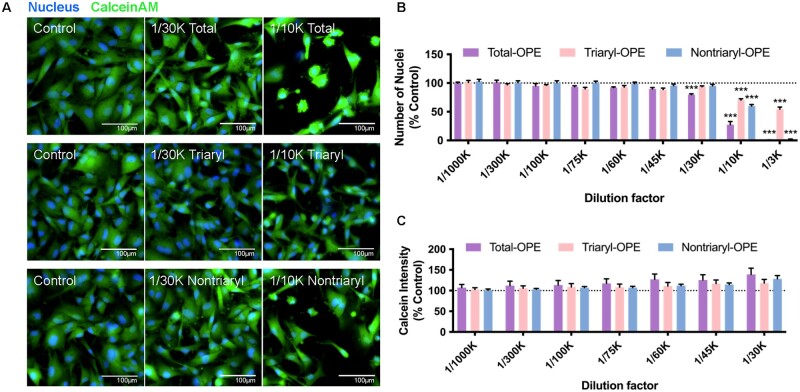
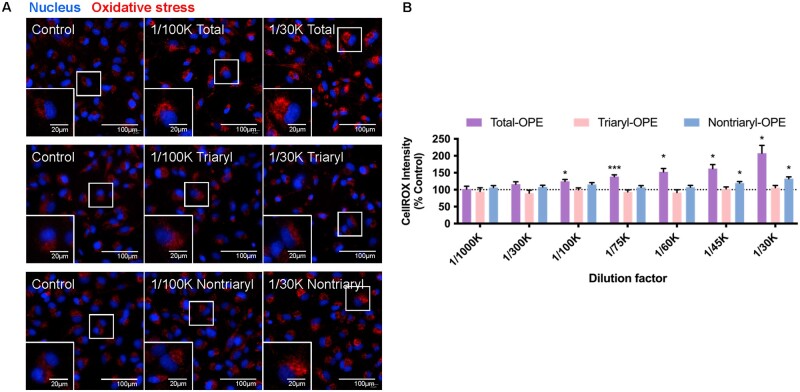
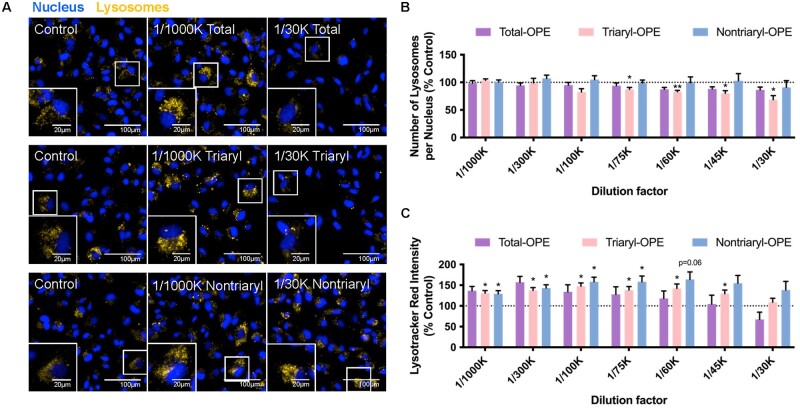
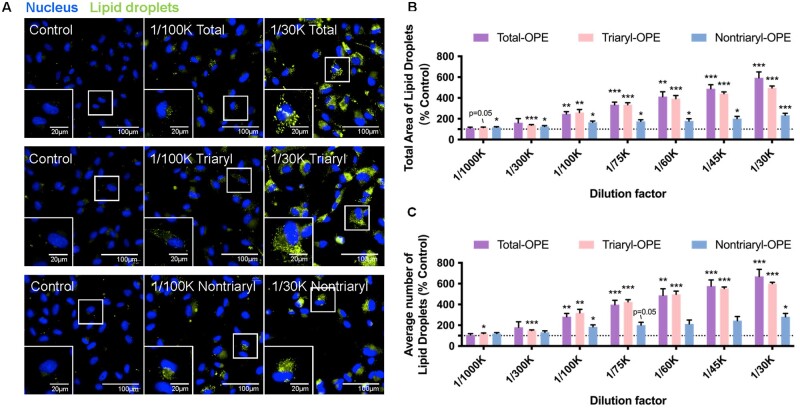
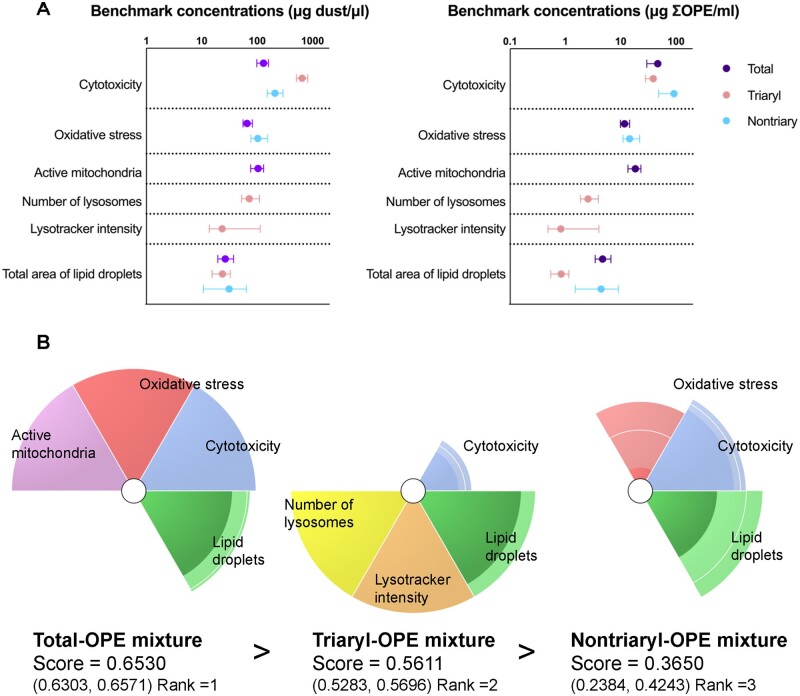
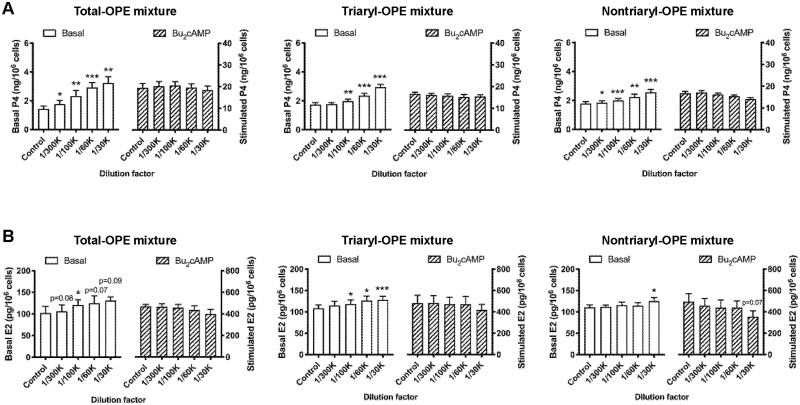
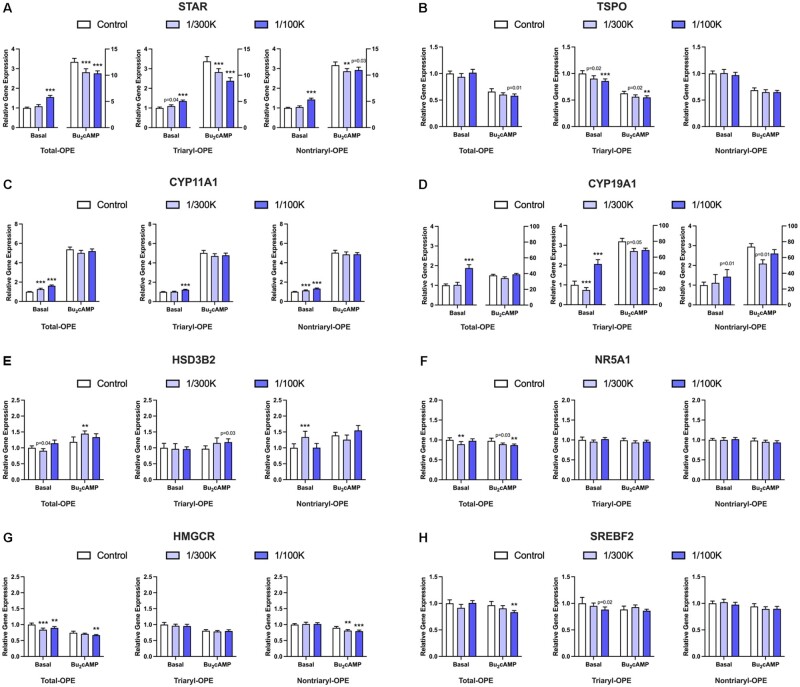
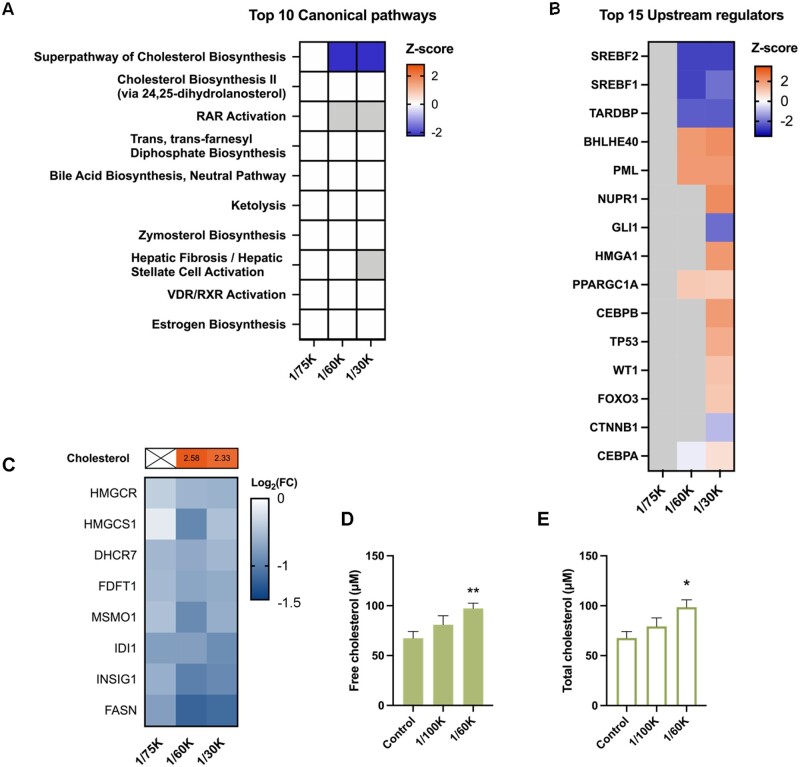
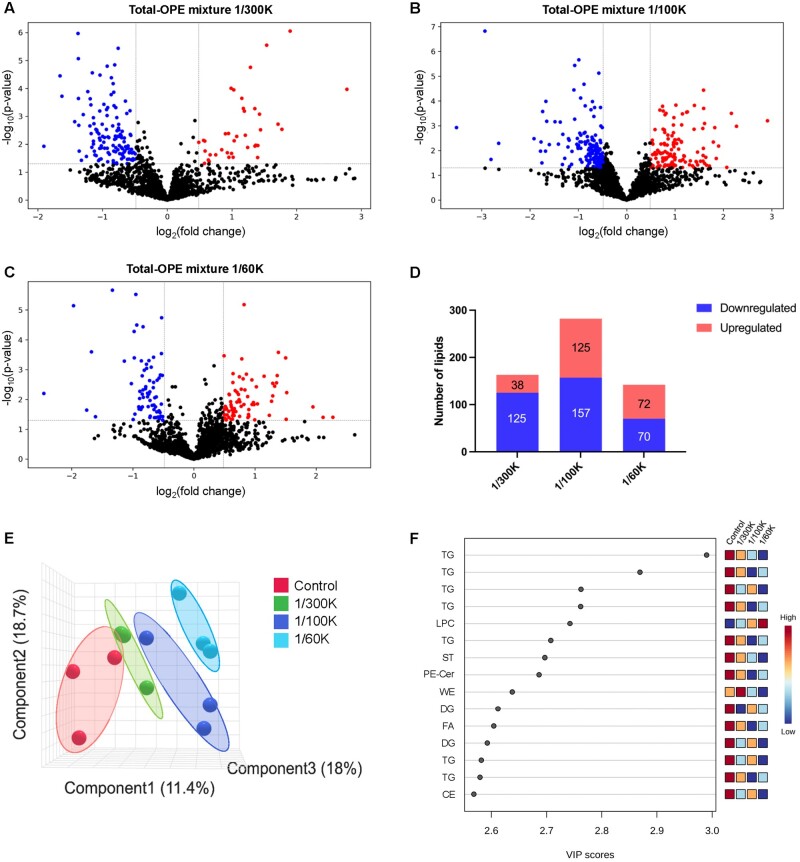
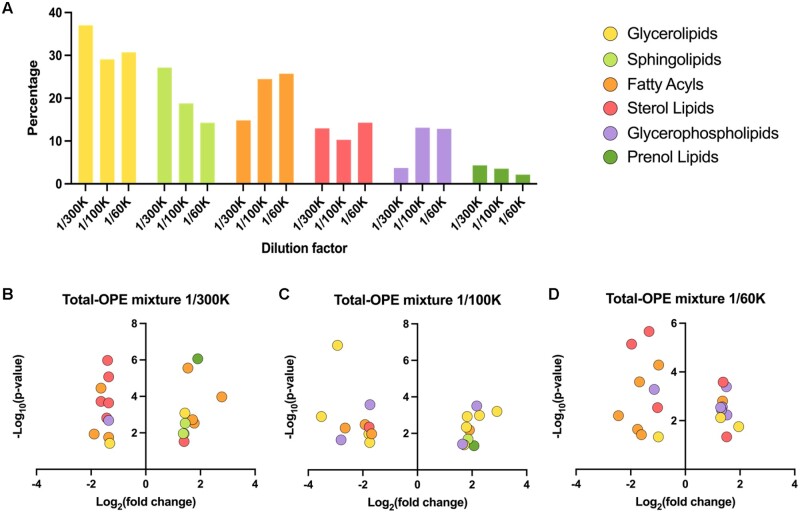
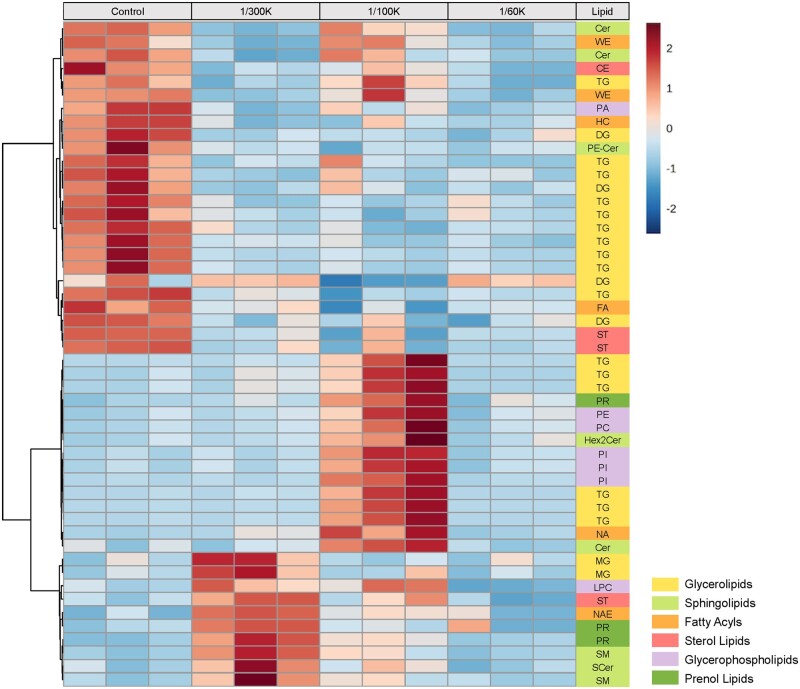
Organophosphate esters (OPEs), used as flame retardants and plasticizers, are present ubiquitously in the environment. Previous studies suggest that exposure to OPEs is detrimental to female fertility in humans. However, no experimental information is available on the effects of OPE mixtures on ovarian granulosa cells, which play essential roles in female reproduction. We used high-content imaging to investigate the effects of environmentally relevant OPE mixtures on KGN human granulosa cell phenotypes. Perturbations to steroidogenesis were assessed using ELISA and qRT-PCR. A high-throughput transcriptomic approach, TempO-Seq, was used to identify transcriptional changes in a targeted panel of genes. Effects on lipid homeostasis were explored using a cholesterol assay and global lipidomic profiling. OPE mixtures altered multiple phenotypic features of KGN cells, with triaryl OPEs in the mixture showing higher potencies than other mixture components. The mixtures increased basal production of steroid hormones; this was mediated by significant changes in the expression of critical transcripts involved in steroidogenesis. Further, the total-OPE mixture disrupted cholesterol homeostasis and the composition of intracellular lipid droplets. Exposure to complex mixtures of OPEs, similar to those found in house dust, may adversely affect female reproductive health by altering a multitude of phenotypic and functional endpoints in granulosa cells. This study provides novel insights into the mechanisms of actions underlying the toxicity induced by OPEs and highlights the need to examine the effects of human relevant chemical mixtures.

Keywords: high-content imaging; high-throughput transcriptomics; lipidomics; mixture; organophosphate esters; ovarian granulosa cells.


Figures

Figure 1.
Figure 1.
Cytotoxicity of the total-, triaryl-, and nontriaryl-OPE mixtures in KGN human granulosa cells. Cells were exposed to the total-, triaryl-, or nontriaryl-OPE mixture (1/1000–1/10K dilutions) for 48 h and visualized with fluorescent dyes and high-content imaging (40× magnification). A, Representative images show the effects of exposures on cell viability (Calcein AM staining, green); nuclei were visualized in blue by Hoechst 33342 staining. The scale bars denote 100 μm. Bar graphs illustrate the effects of OPE mixtures on (B) the numbers of nuclei, (C) the average calcein intensity. Data are displayed as percentages relative to controls; values represent means ± SEM, n = 6. One-sample Holm-Bonferroni-corrected t tests were done to determine statistical significance from controls (=100): *** denotes p < .001. The 1/10K and 1/3K dilutions induced >30% decrease in cell counts and thus were excluded in phenotypic analysis.
Figure 2.
Figure 2.
OPE mixtures increased the generation of reactive oxygen species (ROS) in KGN human granulosa cells. Cells were exposed for 48 h to one of the mixtures (1/1000–1/10K dilutions) and visualized with fluorescent dyes and high-content imaging (40× magnification). A, Representative images show the effects of exposures on intracellular ROS (CellROX staining, red); nuclei were visualized in blue by Hoechst 33342 staining. Scale bars denote 20 and 100 μm for the insets and the main images, respectively. B, The average intensity of CellROX staining. Data are displayed as percentages relative to controls; values represent means ± SEM, n = 6. One-sample Holm-Bonferroni-corrected t tests were done to determine statistical significance from controls (=100): *p < .05, **p < .01, ***p < .001. The 1/10K and 1/3K dilutions induced >30% decrease in cell counts and thus were excluded in phenotypic analysis.
Figure 3.
Figure 3.
Effects of OPE mixtures on lysosomes in KGN cells. Cells were exposed for 48 h to one of the mixtures (1/1000K–1/10K dilutions) and visualized with fluorescent dyes and high-content imaging (40× magnification). A, Representative images show the effects of exposures on lysosomes (Lysotracker staining, yellow); nuclei were visualized in blue by Hoechst 33342 staining. Scale bars denote 20 and 100 μm for the insets and the main images, respectively. Bar graphs illustrate the effects of OPE mixtures on (B) the average numbers of lysosomes per cell, and (C) the average intensity of Lysotracker staining. Data are displayed as percentages relative to controls; values represent means ± SEM, n = 6. One-sample Holm-Bonferroni-corrected t tests were done to determine statistical significance from controls (=100): *p < .05, **p < .01, ***p < .001. The 1/10K and 1/3K dilutions induced >30% decrease in cell counts and thus were excluded in phenotypic analysis.
Figure 4.
Figure 4.
OPE mixtures increased intracellular lipid droplets in KGN cells. Cells were exposed for 48 h to one of the mixtures (1/1000K–1/10K dilutions) and visualized with fluorescent dyes and high-content imaging (40× magnification). A, Representative images show the effects of exposures on lipid droplets (Nile Red staining, green); nuclei were visualized in blue by Hoechst 33342 staining. Scale bars denote 20 and 100 μm for the insets and the main images, respectively. Bar graphs illustrate the effects of OPE mixtures on (B) the total area and (C) the average number of lipid droplets per cell. Data are displayed as percentages relative to controls; values represent means ± SEM, n = 6. One-sample Holm-Bonferroni-corrected t tests were done to determine statistical significance from controls (=100): *p < .05, **p < .01, ***p < .001. The 1/10K and 1/3K dilutions induced >30% decrease in cell counts and thus were excluded in phenotypic analysis.
Figure 5.
Figure 5.
Benchmark modeling and Toxicological Prioritization Index (ToxPi) analyses for potency ranking. A, Dilutions were converted into dust equivalents (μg dust per μl) and OPE equivalents (μg total OPEs per ml). Benchmark concentrations at which a 10% response was induced were calculated for specific phenotypic endpoints. Values represent means ± upper and lower limits, n = 6. B, Mixture-specific ToxPi profiles and ToxPi scores analyzed using dust equivalent-based BMC10 concentrations. Six endpoints were assigned with equal weights for the calculation of ToxPi scores; 95% confidence intervals of ToxPi scores are reported in parentheses. The size of each slice represents the relative potency of the mixture for a specific endpoint. The lighter-shaded area at the boundary of each wedge indicates the 95% confidence intervals.
Figure 6.
Figure 6.
Effects of the OPEs mixtures on the production of (A) progesterone (P4) and (B) 17β-estradiol (E2) in KGN cells exposed for 48 h to the total-, triaryl-, or nontriaryl-OPE mixtures in the absence or presence of 1 mM dibutyryl-cAMP. Bar graphs show the effects of mixtures on basal (white bars) and dibutyryl-cAMP-stimulated (Bu2cAMP, striped bars) hormone production. Values represent means ± SEM; n = 6-8. Two-way repeated measures ANOVA were done to determine significant differences from controls: *p < .05, **p < .01, ***p < .001.
Figure 7.
Figure 7.
qRT-PCR analyses of the expression of key transcripts involved in steroidogenesis and cholesterol biosynthesis in KGN cells exposed for 48 h to control, 1/300K, or 1/100K dilutions of the total-, triaryl-, or nontriaryl-OPE mixtures under basal and dibutyryl-cAMP-stimulated conditions. Bar graphs show the effects of mixtures on the relative expression of cholesterol transporters (A) STAR and (B) TSPO; steroidogenic enzymes (C) CYP11A1, (D) CYP19A1, (E) HSD3B2, and upstream regulator (F) NR5A1; cholesterol biosynthetic enzyme (G) HMGCR, and the upstream regulator (H) SREBF2. Data represent means ± 95% CI, n = 5. Two-way repeated measures ANOVA with post-hoc Dunnett’s multiple comparison tests were done to determine significance: *p < .01, **.0001 < p < .01, ***p < .001 versus control under the same condition.
Figure 8.
Figure 8.
Exposure to the total-OPE mixture targeted the cholesterol homeostasis in KGN cells. A, Pathway analysis of DEGs identified by TempO-Seq in KGN cells exposed for 48 h to the total-OPE mixture; the heatmap displays the top 10 canonical pathways that were affected. B, IPA upstream regulator analysis of TempO-Seq data predicted changes in the activities of transcription factors (TFs) (p < .05); the heatmap displays the top 15 TFs that were affected. Each cell is colored based on its associated z-score: blue indicates a negative z-score and inhibition of the pathway or the TF; orange indicates a positive z-score and predicted activation of the pathway or the TF; white indicates a z-score of zero and no direction of activity change can be predicted for the corresponding pathway; gray indicates no prediction or no effect. C, IPA upstream analysis predicted changes in cholesterol following exposure to the total-OPE mixture. The top panel and the gene expression heatmap display the z-scores and the relative expression (ie, log2 fold change) of the DEGs associated with the prediction, respectively. Orange indicates a positive z-score and a predicted increase in the molecule; navy blue indicates downregulation of the transcript. Concentrations of (D) free and (E) total cholesterol (μM) in KGN cells exposed for 48 h to 1/100K or 1/60K dilutions of the total-OPE mixture. Values represent mean ± SEM, n = 3-4. *p < .05, **p < .01 compared with the control by 1-way repeated measures ANOVA with post-hoc Dunnett’s multiple comparison tests.
Figure 9.
Figure 9.
Differentially abundant lipids were identified by lipidomic profiling in KGN cells exposed to the total-OPE mixture for 48 h. Volcano plots show the significantly downregulated (blue) or upregulated (red) lipids in response to (A) 1/300K, (B) 1/100K, and (C) 1/60K dilutions of the total-OPE mixture compared with controls. Dashed lines indicate cut-offs for significance: |log2(fold change)| > 0.49 and –log10(p values) > 1.3 (corresponding to fold change >1.5 or <0.71 and p value <.05). D, Numbers of significantly downregulated (blue) or upregulated (red) lipids in each treatment group. E, PLS-DA score plot used to visualize the degree of separation in the lipidomic profiles of the 4 experimental conditions. F, Variable importance in projection (VIP) scores of the 15 most important lipids (listed in subclasses on the left axis) that contribute to the class separation in (E). Lipids with high VIP scores provide more contribution. The colored panel on the right indicates the relative abundance of the respective lipid in each treatment group; the abundance is denoted by 4 colors ranging from red (high) to blue (low). For the full names of lipid subclasses, please refer to Supplementary Table 14.
Figure 10.
Figure 10.
Lipid category distribution of significantly altered lipids identified by lipidomic profiling in KGN cells exposed to the total-OPE mixture for 48 h. A, Data represent the percentage of lipids within specific categories relative to the total significant lipids identified within the same treatment group. Scatter plots display the top 10 downregulated and top 10 upregulated lipids exhibiting the greatest fold changes in response to the (B) 1/300K, (C) 1/100K, and (D) 1/60K dilutions of the total mixture. Bars and dots are color coded by lipid category.
Figure 11.
Figure 11.
Heatmap analysis of the top 50 features identified by lipidomic profiling in KGN cells exposed to the total-OPE mixture for 48 h. Lipid abundance was visualized with red representing lipids with a high-intensity ratio and blue representing lipids with a low-intensity ratio. The individual samples are displayed across the horizontal axis; the identified lipids are listed on the vertical axis and color-coded by their respective lipid categories. The lipid features were ranked by ANOVA Omnibus F test p values. For the full names of lipid subclasses, please refer to Supplementary Table 14.

Similar articles

Cited by

References

    1. Aluru N., Hallanger I. G., McMonagle H., Harju M. (2021). Hepatic gene expression profiling of Atlantic cod (Gadus morhua) liver after exposure to organophosphate flame retardants revealed altered cholesterol biosynthesis and lipid metabolism. Environ. Toxicol. Chem. 40, 1639–1648. - PubMed
    1. An J., Jiang J., Tang W., Zhong Y., Ren G., Shang Y., Yu Z. (2023). Lipid metabolic disturbance induced by triphenyl phosphate and hydroxy metabolite in HepG2 cells. Ecotoxicol. Environ. Saf. 262, 115160. - PubMed
    1. Bailey J. M., Levin E. D. (2015). Neurotoxicity of FireMaster 550® in zebrafish (Danio rerio): Chronic developmental and acute adolescent exposures. Neurotoxicol. Teratol. 52, 210–219. - PMC - PubMed
    1. Baldwin K. R., Phillips A. L., Horman B., Arambula S. E., Rebuli M. E., Stapleton H. M., Patisaul H. B. (2017). Sex specific placental accumulation and behavioral effects of developmental firemaster 550 exposure in Wistar rats. Sci. Rep. 7, 7118. - PMC - PubMed
    1. Blum A., Behl M., Birnbaum L. S., Diamond M. L., Phillips A., Singla V., Sipes N. S., Stapleton H. M., Venier M. (2019). Organophosphate ester flame retardants: Are they a regrettable substitution for polybrominated diphenyl ethers? Environ. Sci. Technol. Lett. 6, 638–649. - PMC - PubMed