. 2024 Apr 11;20(4):e1012154.
doi: 10.1371/journal.ppat.1012154. eCollection 2024 Apr.

A gain-of-function mutation in zinc cluster transcription factor Rob1 drives Candida albicans adaptive growth in the cystic fibrosis lung environment

Affiliations

A gain-of-function mutation in zinc cluster transcription factor Rob1 drives Candida albicans adaptive growth in the cystic fibrosis lung environment

Mayssa Gnaien et al. PLoS Pathog. .

Abstract

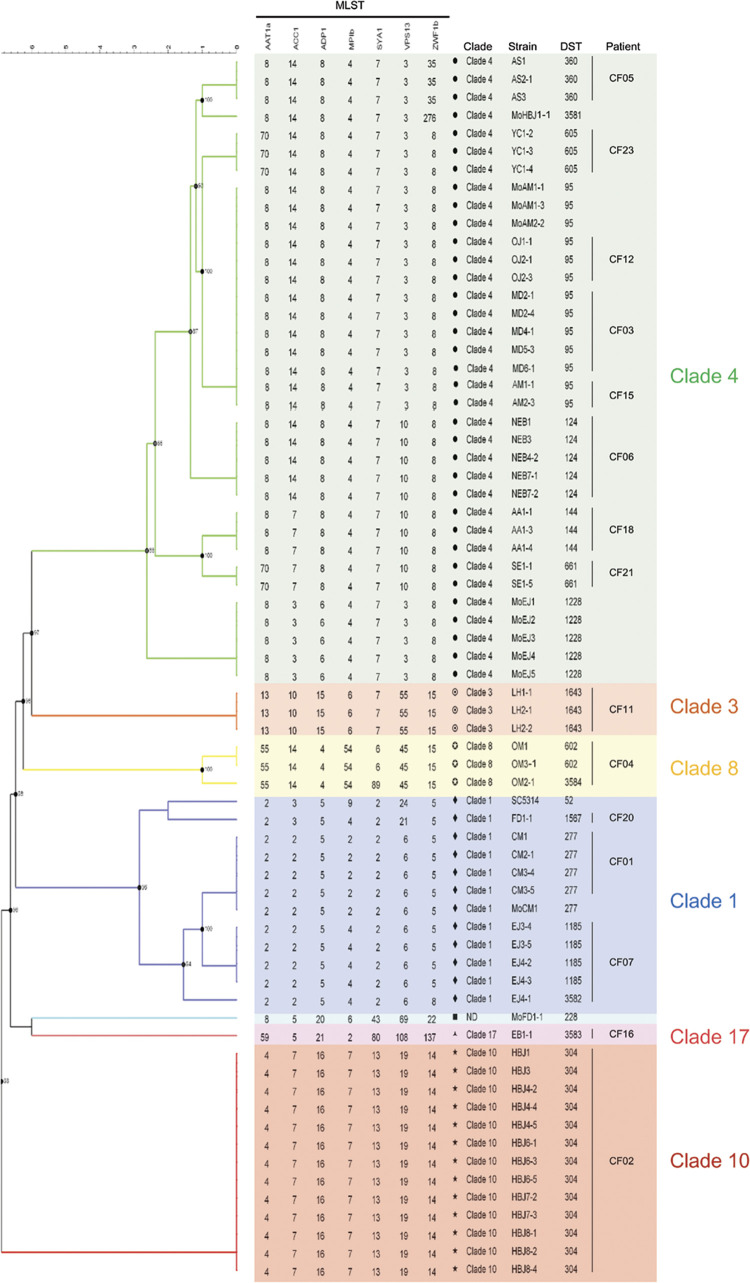
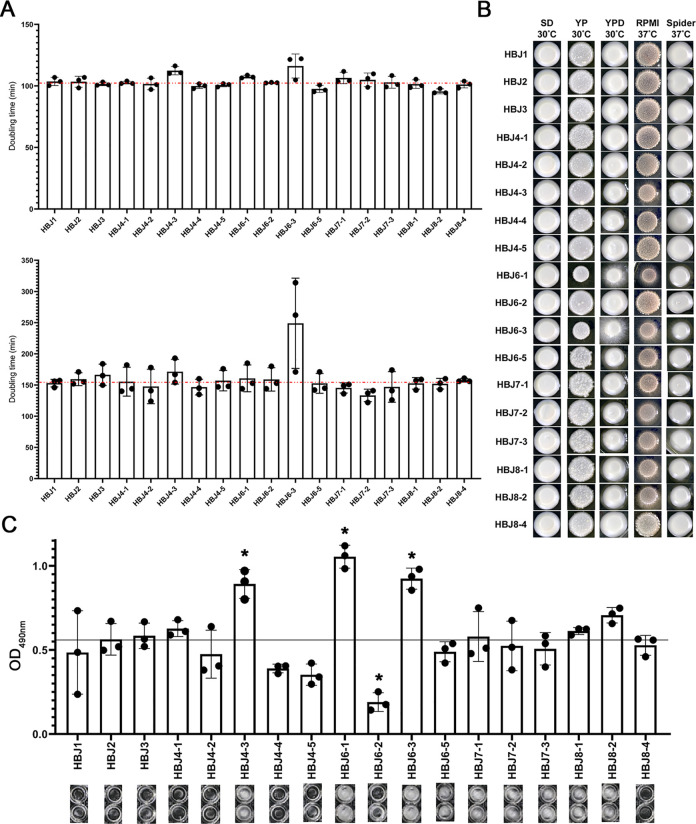
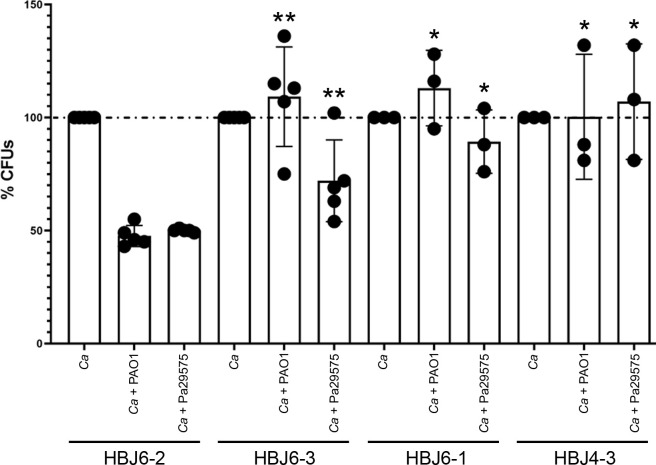
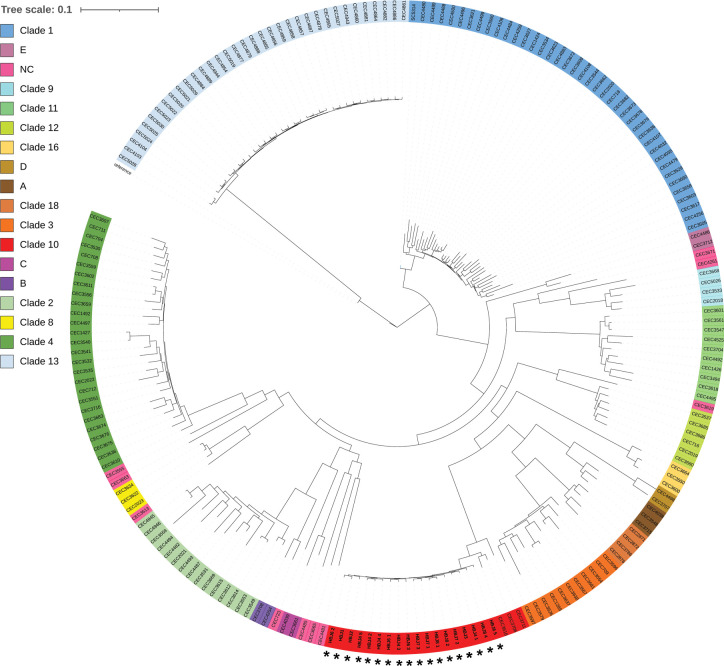
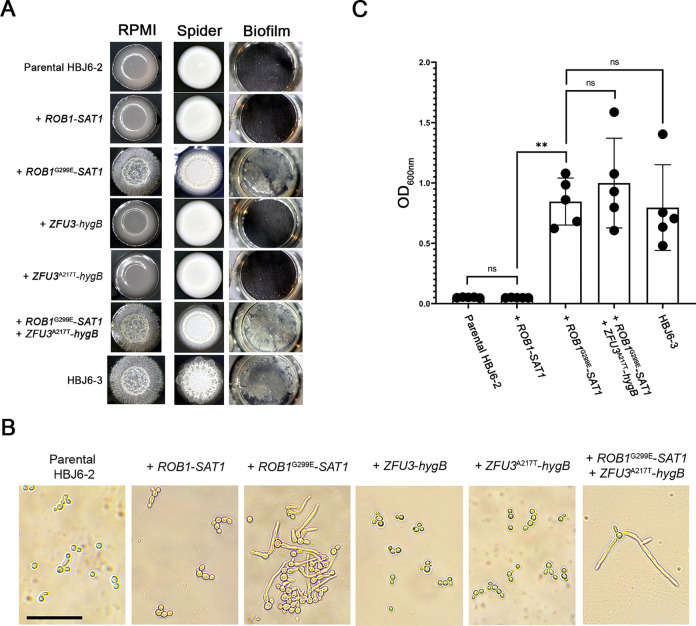
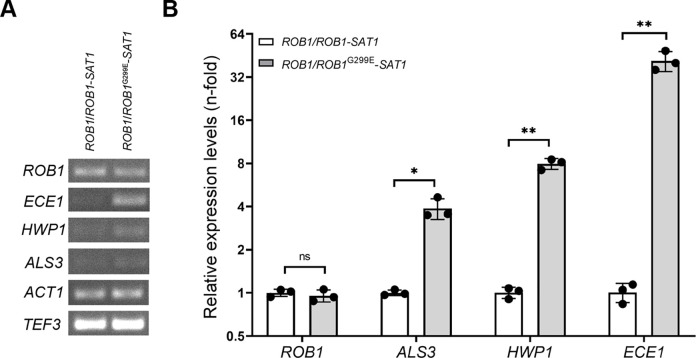
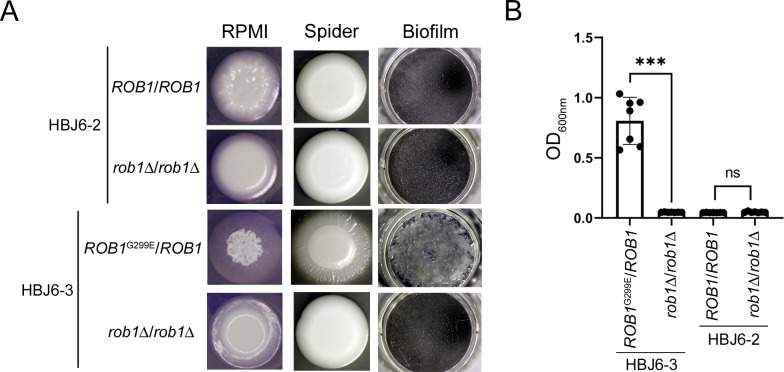
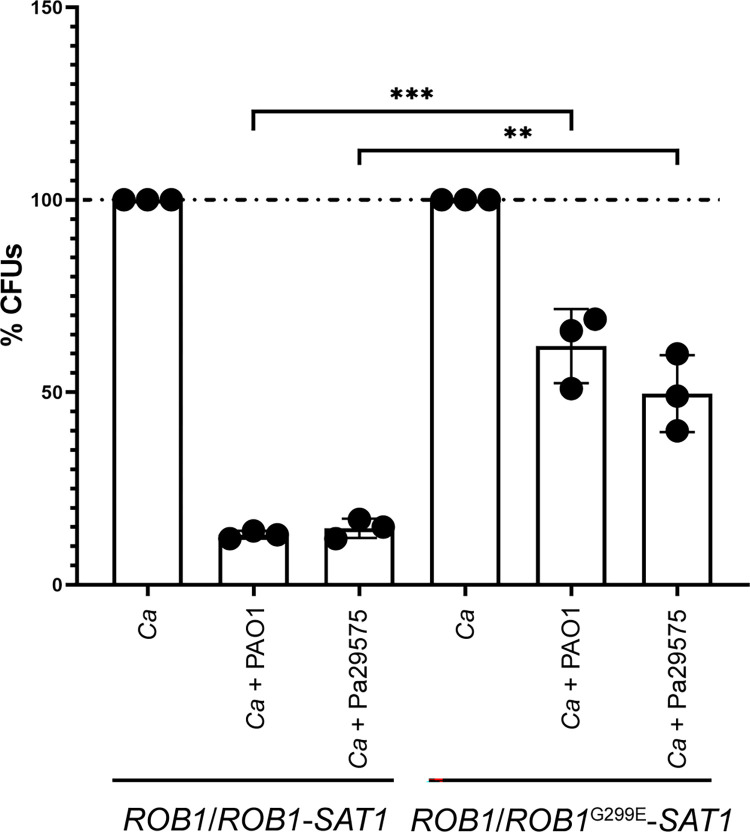
Candida albicans chronically colonizes the respiratory tract of patients with Cystic Fibrosis (CF). It competes with CF-associated pathogens (e.g. Pseudomonas aeruginosa) and contributes to disease severity. We hypothesize that C. albicans undergoes specific adaptation mechanisms that explain its persistence in the CF lung environment. To identify the underlying genetic and phenotypic determinants, we serially recovered 146 C. albicans clinical isolates over a period of 30 months from the sputum of 25 antifungal-naive CF patients. Multilocus sequence typing analyses revealed that most patients were individually colonized with genetically close strains, facilitating comparative analyses between serial isolates. We strikingly observed differential ability to filament and form monospecies and dual-species biofilms with P. aeruginosa among 18 serial isolates sharing the same diploid sequence type, recovered within one year from a pediatric patient. Whole genome sequencing revealed that their genomes were highly heterozygous and similar to each other, displaying a highly clonal subpopulation structure. Data mining identified 34 non-synonymous heterozygous SNPs in 19 open reading frames differentiating the hyperfilamentous and strong biofilm-former strains from the remaining isolates. Among these, we detected a glycine-to-glutamate substitution at position 299 (G299E) in the deduced amino acid sequence of the zinc cluster transcription factor ROB1 (ROB1G299E), encoding a major regulator of filamentous growth and biofilm formation. Introduction of the G299E heterozygous mutation in a co-isolated weak biofilm-former CF strain was sufficient to confer hyperfilamentous growth, increased expression of hyphal-specific genes, increased monospecies biofilm formation and increased survival in dual-species biofilms formed with P. aeruginosa, indicating that ROB1G299E is a gain-of-function mutation. Disruption of ROB1 in a hyperfilamentous isolate carrying the ROB1G299E allele abolished hyperfilamentation and biofilm formation. Our study links a single heterozygous mutation to the ability of C. albicans to better survive during the interaction with other CF-associated microbes and illuminates how adaptive traits emerge in microbial pathogens to persistently colonize and/or infect the CF-patient airways.


Conflict of interest statement

The authors have declared that no competing interests exist.

Figures

Fig 1
Fig 1. Dendrogram of the multilocus sequence types of C. albicans strains isolated from the airways of patients with CF.
Phylogenetic relationship of 56 C. albicans clinical isolates recovered from the airways of 15 CF patients (CF01, CF02, CF03, CF04, CF05, CF06, CF07, CF11, CF12, CF15, CF16, CF18, CF20, CF21 and CF23) together with 11 isolates from the mothers of (Mo) patients CF01, CF02, CF07, CF15 and CF20 and reference strain SC5314. Allelic concatenated nucleic acid sequences of the seven loci (MLST, AAT1a, ACC1, ADP1, MPIb, SYA1, VPS13, and ZWF1b) in each strain were phylogenetically analyzed by the Bionumerics 6.0 algorithm (Applied Maths NV, St. Martens-Latem), using the categorical similarity coefficient and the UPGMA clustering method. The allelic profiles were composed of an allele identification number for each gene. An allele combination, known as diploid sequence type (DST), was assigned for the seven loci of each isolate (or obtained for isolates with new DST numbers: MoHBJ, 3581; EJ4-1, 3582; EB1-1, 3583; OM2-1, 3584) according to the C. albicans MLST database. Clade numbers were determined according to the goeBUST algorithm. Seven clades were identified, including clade 4 (green), clade 1 (blue), clade 8 (yellow), clade 3 (orange), clade 17 (pink) and clade 10 (red). Isolate MoFD1-1 clade was not determined, ND (light blue, DST228).
Fig 2
Fig 2. Phenotypic analyses of the complete set of 18 C. albicans isolates serially recovered from patient CF02.
A. C. albicans isolates were individually grown in rich YPD (top panel) and minimal SD (bottom panel) liquid media in 96-well plates at a starting OD600nm of 0.1 in 100 μl of YPD or SD at 30°C. OD600nm was measured every 5 min using a Tecan Infinite 200 reader. Tecan OD600nm readings were converted into “flask OD600nm” readings using the following formula: ODFlask = ODTecan × 12.2716–1.0543 [95] and doubling times were calculated within the exponential growth interval as previously described [96]. Doubling times (in minutes, average of 3 independent replicates with error bars denoting standard deviations) are indicated on the y-axis for each strain. The average growth rate values of strains HBJ6-3 and HBJ4-3 in YPD (top panel) medium differ from the population by at least one standard deviation from the mean. Doubling time of strain HBJ6-1 in YPD medium (top panel) fell short of reaching this threshold. The red horizontal lines mark the median value. B. Colony morphology phenotypes of the clinical isolates initially patched (5 μL of a cell dilution at an OD600nm of 0.1) on solid media under filamentation-inducing (RPMI 37°C, Spider 37°C) and -non-inducing (SD at 30°C, YP at 30°C and YPD at 30°C) conditions. C. Biofilm formation was measured three times independently by XTT (2,3-Bis-(2-Methoxy-4-Nitro-5-Sulfophenyl)-2H-Tetrazolium-5-Carboxanilide) assay following growth on FBS-precoated polystyrene microtiter plates in rich medium at 37°C as described in Materials and Methods. The average of three independent replicates are shown as OD490nm values on the y-axis with error bars denoting standard deviations. Asterisks denote averaged values differing from the population by at least one standard deviation from the mean. The black horizontal line marks the median value. Bottom, photographs of the corresponding two mature biofilms formed independently by the indicated strains on FBS-precoated polystyrene wells, right before quantification by XTT assay.
Fig 3
Fig 3. Quantification of the relative survival of C. albicans CF isolates HBJ6-2, HBJ6-3, HBJ6-1 and HBJ4-3 in dual species biofilms formed with P. aeruginosa.
Preformed 24-h biofilms with either C. albicans alone (Ca, monospecies biofilms made by HBJ6-2, HBJ6-3, HBJ6-1 and HBJ4-3) or both C. albicans and P. aeruginosa (dual-species biofilms, Ca + PAO1, Ca + Pa29575) were treated with DNase I to degrade the extracellular matrix then detached from the surface of wells by scraping (see Materials and Methods). The resulting cell suspensions were diluted and plated onto antibiotic-containing YPD agar to determine the percent CFUs (y-axis, %CFUs) of C. albicans cells co-cultured with P. aeruginosa PAO1 or Pa29575 relative to biofilm growth of C. albicans cells alone (y-axis, %CFUs set to 100%). The experiments were carried out 3 to 5 times independently and data are plotted as the average of 5 independent biological replicates on the y-axis with error bars denoting standard deviations. Statistical analysis was performed using the non-parametric Mann-Whitney test that compares %CFUs for HBJ6-3, HBJ6-1 or HBJ4-3 in each co-incubation condition (Ca + PAO1 or Ca + Pa29575) with the %CFUs for HBJ6-2 in the corresponding co-incubation condition. *, P<0.05; **, P<0.01.
Fig 4
Fig 4. Maximum likelihood phylogenetic tree showing relationships between 200 C. albicans isolates including those from patient CF02.
A total of 200 C. albicans isolates (182 isolates from Ropars et al. together with 18 isolates used in this study, shown in red and indicated by asterisks) were clustered into 17 distinct genetic clades, including 12 clades previously found using multilocus sequencing typing (MLST) and five recent ones (A, B, C, D, and E) described by Ropras et al. [20]. The majority of the isolates belonged to clades 1 (n  =  40), 4 (n  =  27), 10 (n = 21), and 13 (n = 35). C. albicans isolates from patient CF02 (n = 18) were clustered in clade 10 (indicated by asterisks), with a clonal subpopulation structure. Scale bar, 0.1 nucletide substitutions per site on average.
Fig 5
Fig 5. Impact of ROB1G299E and ZFU3A217T mutations on C. albicans morphogenesis and biofilm formation.
A. Representative colony morphology (left and middle columns) and biofilm formation (right column) phenotypes of HBJ6-2 heterozygous mutant derivatives (3 independent clones were generated for each mutant, see S8 Table) carrying the ROB1-SAT1 (+ ROB1-SAT1, control strain, clone # RCC13, S8 Table), the ROB1G299E-SAT1 (+ROB1G299E-SAT1, clone # RC10, S8 Table), the ZFU3-hygB (+ ZFU3-hygB, control strain, clone # ZCC5, S8 Table), the ZFU3A217T-hygB (+ ZFU3A217T-hygB, clone # ZC6, S8 Table) and both ROB1G299E-SAT1 and ZFU3A217T-hygB (+ ROB1G299E-SAT1 + ZFU3A217T-hygB, double mutant, clone # 2MC7, S8 Table) allele replacement cassettes are shown together with those of the parental poorly filamentous HBJ6-2 (Parental HBJ6-2, top row) and the hyperfilamentous HBJ6-3 (bottom row) strains. Strains were patched (5 μl of a cell dilution at an OD600nm of 0.1) on solid media under filamentation-inducing (RPMI, left column; Spider, middle column) conditions and grown at 37°C for 5 days. The indicated strains were also induced to form biofilms for 24 h at 37°C on FBS-precoated polystyrene wells (right columns) as described in panel C. B. The strains tested on solid Spider medium in panel A were also tested in liquid Spider medium at 37°C (indicated on top of each image). Overnight, saturated, pre-cultures in YPD medium were diluted to an OD600nm of 0.3 in 2 mL of liquid Spider medium in 12-well polystyrene plates. The diluted cultures were incubated at 37°C under vigorous shaking for 4 hours. The morphology of C. albicans cells from each culture was examined with a light microscope, at 40× magnification. Scale bar, 100 μm. C. Quantitative biofilm formation assay with the parental strain HBJ6-2 (Parental HBJ6-2), the control strain carrying the ROB1-SAT1 allele replacement cassette (+ ROB1-SAT1), the single ROB1G299E mutant (+ROB1G299E-SAT1, clone # RC10, S8 Table), the ROB1G299E ZFU3A217T double mutant (+ ROB1G299E-SAT1 + ZFU3A217T-hygB, clone # 2MC7, S8 Table) and the hyperfilamentous and strong biofilm-former strain HBJ6-3 (HBJ6-3) was performed 5 times independently on FBS-precoated polystyrene microtiter plates in YPD medium at 37°C. An initial incubation for 30 min allowed adherence of cells to the FBS-precoated polystyrene surface, followed by washing and static re-growth in YPD medium at 37°C for 24 h. After a final washing step, biofilm formation was assessed by quantification of biofilm density using spectrophotometry (see Materials and Methods). Averaged OD600nm values from the 5 independent biological replicates are shown on the y-axis, with error bars denoting standard deviations. Statistical analysis was performed using the non-parametric Mann-Whitney test. ns, non-significant; **, P<0.01.
Fig 6
Fig 6. Impact of the ROB1G299E mutation on the expression of Rob1 targets.
A. The expression of ROB1, ECE1, HWP1 and ALS3 in HBJ6-2 strain derivatives ROB1/ROB1-SAT1 (left) and ROB1/ROB1G299E-SAT1 (right) was qualitatively assessed by reverse-transcription polymerase chain reaction (RT-PCR) and agarose gel electrophoresis of the RT-PCR products using specific primers listed in S3 Table. The ACT1 and TEF3 loading control amplification signals are shown at the bottom of the panel. B. The relative expression of the same genes (y-axis, relative expression levels (n-fold)) was also quantitatively analyzed by qRT-PCR. The expression of endogenous gene ACT1 was used as the normalization standard, and the relative expression of the indicated genes (bottom) in the ROB1G299E-SAT1/ROB1 mutant (light gray-filled histograms) compared to its expression in the ROB1-SAT1/ROB1 (open histograms) was determined using the cycle threshold (ΔΔCt) method using the average ΔCt values of the ACT1 gene in the ROB1-SAT1/ROB1 strain as a calibrator (see Materials and Methods). The assays were carried out three times independently and statistical analysis was performed using a Welch’s t-test. ns, not significant; *, P<0.05; **, P<0.01.
Fig 7
Fig 7. Contribution of ROB1 to colony morphology and biofilm formation in strain HBJ6-3.
A. Representative colony morphology (left and middle columns) and biofilm formation (right column) phenotypes of HBJ6-2- and HBJ6-3-derived homozygous rob1Δ/rob1Δ mutants (5 independent clones were generated from each parental strain, see S8 Table) that were subjected to a CRISPR-Cas9-driven homozygous inactivation of the ROB1 gene using the dominant selection marker SAT1 (see Materials and Methods) are shown. The parental poorly filamentous HBJ6-2 strain (ROB1/ROB1, top row) and the rob1Δ/rob1Δ mutant derivative (2nd row from top, rob1Δ/rob1Δ, strain MGY16, clone # KOC28, S8 Table), together with the parental hyperfilamentous strain HBJ6-3 (ROB1G299E/ROB1, third row from top) and the rob1Δ/rob1Δ mutant derivative (bottom row, rob1Δ/rob1Δ, strain MGY17, clone # KOC7, S8 Table) were patched (5 μl of a cell dilution at an OD600nm of 0.1) on solid media under filamentation-inducing (RPMI, left column; Spider, middle column) conditions and grown at 37°C for 5 days. The indicated parental strains and their mutant derivatives were also induced to form biofilms for 24 h at 37°C on FBS-precoated polystyrene wells (right columns) as described in panel B. B. Quantitative biofilm formation assay was performed 6 times independently on FBS-precoated polystyrene microtiter plates in YPD medium at 37°C with the parental strains and the corresponding rob1Δ/rob1Δ mutant derivatives described in panel A (shown beneath the x-axis). An initial incubation for 30 min allowed adherence of cells to the FBS-precoated polystyrene surface, followed by washing and static re-growth in YPD medium at 37°C for 24 h. After a final washing step, biofilm formation was assessed by quantification of biofilm density using spectrophotometry (see Materials and Methods). Averaged OD600nm values from the 6 independent biological replicates are shown the y-axis, with error bars denoting standard deviations. Statistical analysis was performed using the non-parametric Mann-Whitney test. ns, non-significant; ***, P<0.001.
Fig 8
Fig 8. Impact of ROB1G299E mutation on survival of C. albicans in dual-species biofilms formed with P. aeruginosa.
Preformed 24-h biofilms with either C. albicans alone (monospecies biofilms, Ca) or both C. albicans and P. aeruginosa (dual-species biofilms, Ca + PAO1, Ca + Pa29575) were treated with DNase I to degrade the extracellular matrix then detached from the surface of wells by scraping (see Materials and Methods). The resulting cell suspensions were diluted and plated onto antibiotic-containing YPD agar to determine the percent CFUs (y-axis, %CFUs) of C. albicans cells (the HBJ6-2-derived heterozygous control strain ROB1/ROB1-SAT1 # RCC13 or the ROB1/ROB1G299E-SAT1 mutant # RC10, S8 Table) co-cultured with P. aeruginosa PAO1 or Pa29575 relative to biofilm growth of C. albicans cells alone (y-axis, %CFUs set to 100%). The experiments were carried out three times independently and data are plotted as the average of three independent biological replicates on the y-axis with error bars denoting standard deviations. Statistical analysis was performed using a Student’s t test. **, P<0.01; ***, P<0.001.

Similar articles

Cited by

References

    1. Cutting GR (2015) Cystic fibrosis genetics: from molecular understanding to clinical application. Nat Rev Genet 16: 45–56. doi: 10.1038/nrg3849 - DOI - PMC - PubMed
    1. Biswas L, Gotz F (2022) Molecular Mechanisms of Staphylococcus and Pseudomonas Interactions in Cystic Fibrosis. Front Cell Infect Microbiol 11: 824042. - PMC - PubMed
    1. Chmiel JF, Aksamit TR, Chotirmall SH, Dasenbrook EC, Elborn JS, et al.. (2014) Antibiotic management of lung infections in cystic fibrosis. II. Nontuberculous mycobacteria, anaerobic bacteria, and fungi. Ann Am Thorac Soc 11: 1298–1306. doi: 10.1513/AnnalsATS.201405-203AS - DOI - PMC - PubMed
    1. Haiko J, Saeedi B, Bagger G, Karpati F, Ozenci V (2019) Coexistence of Candida species and bacteria in patients with cystic fibrosis. Eur J Clin Microbiol Infect Dis 38: 1071–1077. doi: 10.1007/s10096-019-03493-3 - DOI - PMC - PubMed
    1. Francis F, Enaud R, Soret P, Lussac-Sorton F, Avalos-Fernandez M, et al.. (2021) New Insights in Microbial Species Predicting Lung Function Decline in CF: Lessons from the MucoFong Project. J Clin Med 10: 3725. doi: 10.3390/jcm10163725 - DOI - PMC - PubMed

Publication types

MeSH terms