. 2024 Apr 10;4(4):100536.
doi: 10.1016/j.xgen.2024.100536.

Human gene regulatory evolution is driven by the divergence of regulatory element function in both cis and trans

Affiliations

Human gene regulatory evolution is driven by the divergence of regulatory element function in both cis and trans

Tyler J Hansen et al. Cell Genom. .

Abstract

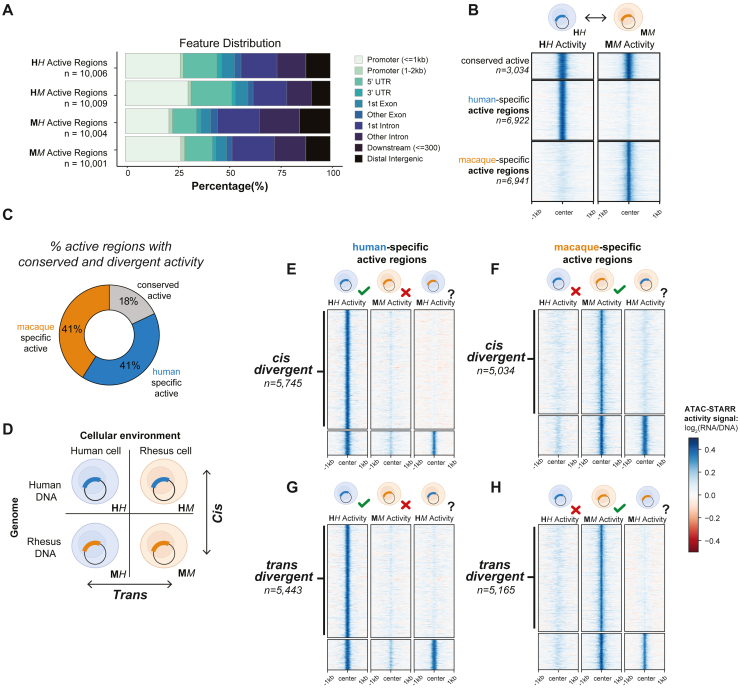
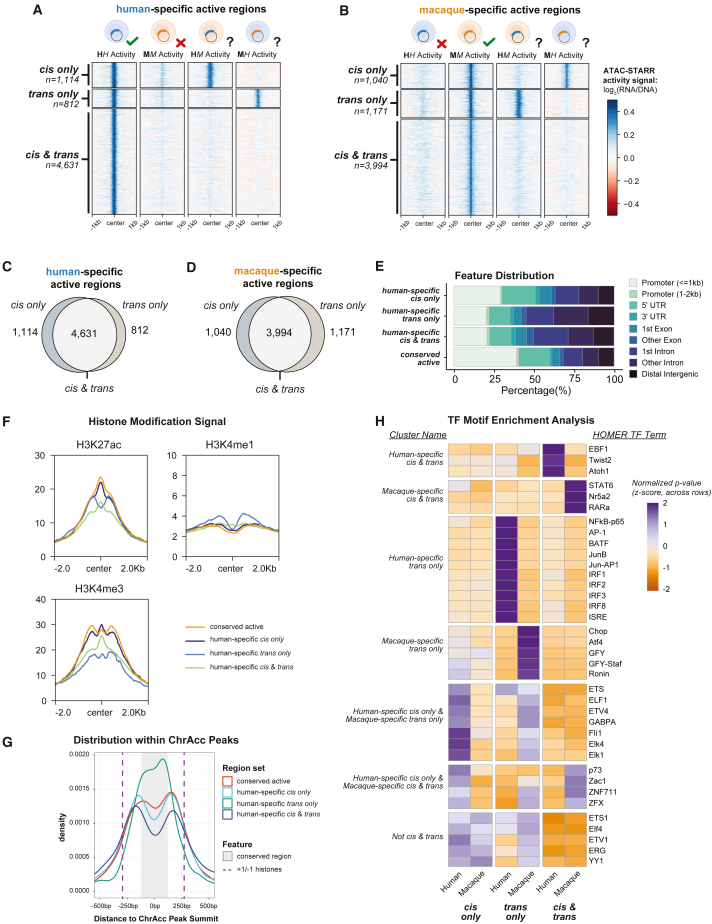
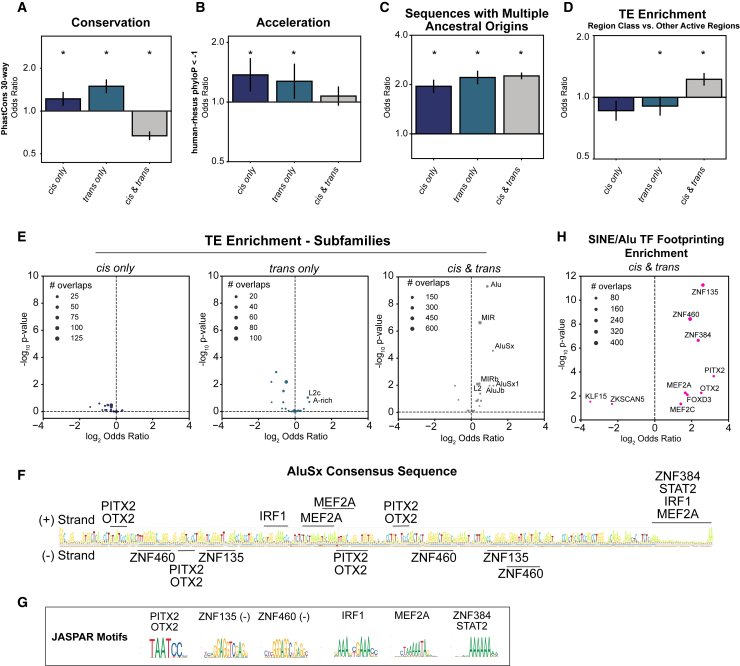
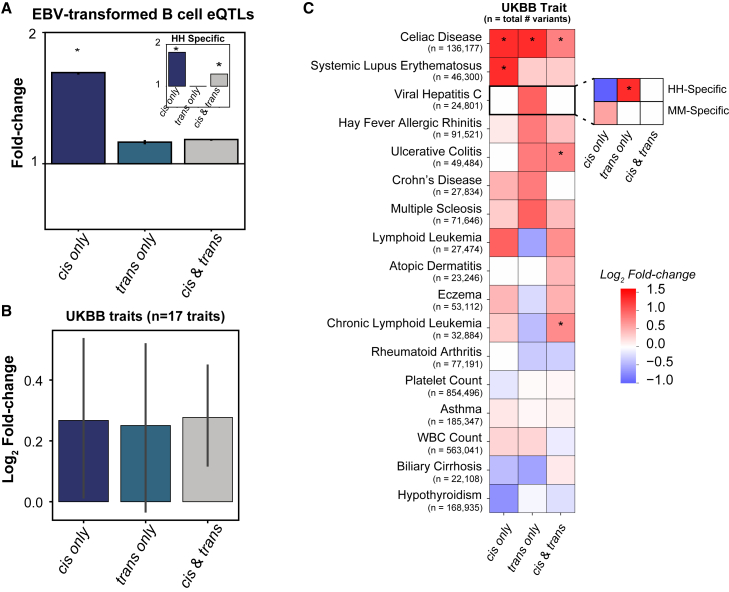
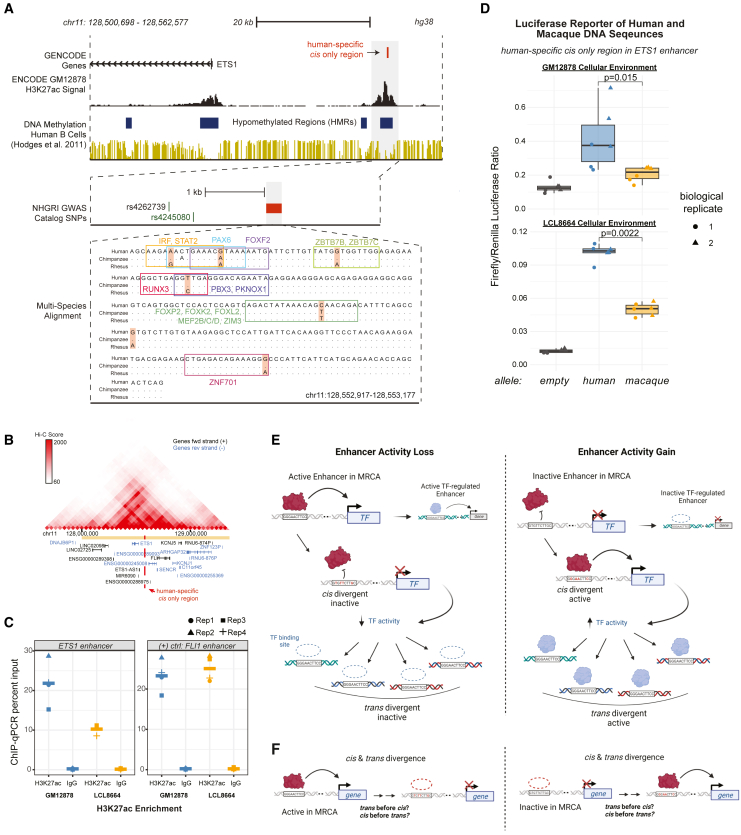
Gene regulatory divergence between species can result from cis-acting local changes to regulatory element DNA sequences or global trans-acting changes to the regulatory environment. Understanding how these mechanisms drive regulatory evolution has been limited by challenges in identifying trans-acting changes. We present a comprehensive approach to directly identify cis- and trans-divergent regulatory elements between human and rhesus macaque lymphoblastoid cells using assay for transposase-accessible chromatin coupled to self-transcribing active regulatory region (ATAC-STARR) sequencing. In addition to thousands of cis changes, we discover an unexpected number (∼10,000) of trans changes and show that cis and trans elements exhibit distinct patterns of sequence divergence and function. We further identify differentially expressed transcription factors that underlie ∼37% of trans differences and trace how cis changes can produce cascades of trans changes. Overall, we find that most divergent elements (67%) experienced changes in both cis and trans, revealing a substantial role for trans divergence-alone and together with cis changes-in regulatory differences between species.

Keywords: DNA regulatory elements; chromatin accessibility; comparative genomics; enhancer activity; functional genomics; gene regulation; human evolution; lymphoblastoid cell lines; massively parallel reporter assays; transcription factors.


Conflict of interest statement

Declaration of interests The authors declare no competing interests.

Figures

None
Graphical abstract
Figure 1
Figure 1
Comparative ATAC-STARR-seq produces a multi-layered view of human and macaque gene regulatory divergence (A) Accessible DNA fragments are isolated from cells and subsequently cloned into self-transcribing reporter vector plasmids, which are then electroporated into cells and assayed for regulatory activity by harvesting and sequencing reporter RNAs and input plasmid DNA. (B) ATAC-STARR-seq plasmid libraries were independently generated for human GM12878 and macaque LCL8664 cell lines and then assayed separately in either cellular context. Our comparative approach provides measures of chromatin accessibility and transcription factor (TF) footprinting for both genomes as well as regulatory activity for the four experimental conditions: human DNA in human cells (HH), human DNA in macaque cells (HM), macaque DNA in human cells (MH), and macaque DNA in macaque cells (MM). (C) Euler plot representing the number of species-specific and shared accessibility peaks identified from ATAC-STARR-seq data. (D) Distribution of genomic annotations for species-specific and shared accessibility peaks based on the distance to nearest TSS. (E) Select genomic loci at hg38 coordinates representing conserved or differentially active regions of the two genomes. Tracks represent human and rhesus macaque accessibility; TF footprints for SPI1 and NFKB1; and regulatory activity measures for HH, HM, MH, and MM. See also Figure S1.
Figure 2
Figure 2
cis and trans gene regulatory divergences occur at similar frequencies (A) Distribution of genomic annotations for the ∼10,000 active regions called in each condition based on the distance to nearest TSS. (B) Comparison between the human and macaque native states (HH vs. MM) to reveal conserved and species-specific active regions. (C) The percentage of active regions with conserved and divergent activity. (D) Cartoon depicting the four conditions tested and how they are compared to identify cis- and trans-divergent regions. (E) Human-specific cis-divergent regions determined by comparing human-specific active regions with the MH condition. Regions without MH activity were called cis-divergent regions. (F) Macaque-specific cis-divergent regions determined by comparing macaque-specific active regions with the HM condition. (G) Human-specific trans-divergent regions determined by comparing human-specific active regions with the HM condition. (H) Macaque-specific trans-divergent regions determined by comparing macaque-specific active regions with the MH condition. The heatmaps display ATAC-STARR-seq activity values for the specified region sets and experimental conditions. See also Figures S2 and S3.
Figure 3
Figure 3
Most species-specific regulatory differences are driven by changes in both cis and trans (A and B) Comparison of ATAC-STARR-seq activity values across all conditions for (A) human-specific and (B) macaque-specific cis- and trans-divergent regions. cis-only, trans-only, and cis-and-trans regions display activity signals consistent with their calls. (C and D) Euler plots of the cis-only, trans-only, and cis-and-trans classifications for (C) human-specific and (D) macaque-specific active regions. (E) Distribution of genomic annotations for human-specific cis-only, trans-only, cis-and-trans, and conserved-active regions. (F) Profile plots of ENCODE GM12878 ChIP-seq signal for H3K27ac, H3K4me1, and H3K4me3 histone modifications for the human-specific region classes. (G) Density plot of the distances between region center and accessible chromatin (ChrAcc) peak summits for human-specific cis-only, trans-only, cis-and-trans, and conserved-active regions. The +1 and −1 histones are estimated with purple dashed lines by the ENCODE GM12878 H3K27ac signal summits and the conserved portion of the ChrAcc peaks is estimated with a gray box by the 17-way PhyloP score; see Figures S3F and S3G. (H) Clustered heatmap of TF motif enrichments for the combined or species separated cis-only, trans-only, and cis-and-trans regions. Values are the Z-score distributions of p values, normalized across rows. Only the top 15 motifs for each region set were chosen for plotting. See also Figure S3.
Figure 4
Figure 4
trans-only regions are bound by differentially expressed TFs (A) Volcano plot of differential expression analysis between GM12878 (human) and LCL8664 (macaque) cell lines. Point color represents genes upregulated in human (blue) or macaque (orange). Thresholds were log2 fold change > | 2 | and padj < 0.001. (B) Enrichments of differentially expressed gene sets for Reactome pathways. Only the top five terms in each were plotted. (C) Enrichment of human-specific trans-only regions for TF footprints stratified by the differential expression of the TF. Text is only shown for the most differentially expressed and enriched TFs. See Figure S4G for macaque trans-only results. (D) Percentage of human-specific trans-only regions that overlap a given footprint. TFs within the same motif archetype were merged before determining the number of overlaps. See Figure S4H for macaque trans-only results. (E) Volcano plot (and zoomed-in version) of differential expression analysis of TFs between four human and four macaque LCLs. Point color represents human (blue) or macaque (orange) putative trans regulators identified in the preceding analysis. All other TFs are colored gray. Additional RNA-seq data were obtained from Cain et al. 2011. See also Figure S4.
Figure 5
Figure 5
cis-only, trans-only, and cis-and-trans regions have different degrees of conservation, acceleration, and transposable element enrichment (A–C) Enrichments of divergent regions for (A) 30-way phastCons elements, (B) human-accelerated elements (defined as PhyloP < −1 estimated from the long-term, 30-way primate multiple sequence alignment; STAR Methods), and (C) sequences with multiple ancestral origins compared to an expected background. (D) Transposable element (TE) enrichment in divergent regions compared to other active regions. (E) TE subfamily enrichments in divergent regions compared to other active regions. (F) The AluSx consensus sequence with binding sites enriched in TF footprints. (G) Jaspar motifs of the relevant TFs. (H) SINE/Alu enrichments in cis-and-trans regions for human TF footprints compared to an expected background. For bar charts, the odds ratios (ORs) are plotted with 95% confidence intervals, which were estimated from 10,000 bootstraps. Windows were log2 scaled. Asterisks indicate a 5% FDR two-sided p value <0.05 from Fisher’s exact test (FET) and Benjamini-Hochberg (BH) procedure. For scatterplots, FET ORs and two-sided 5% FDR p values are shown. Text is only shown for the most enriched sub-families/TFs and point size represents the number of overlaps observed. See also Figure S5.
Figure 6
Figure 6
cis-only, trans-only, and cis-and-trans regions are similarly enriched for genetic variation associated with UKBB traits (A) Enrichments of divergent regions for EBV-transformed B cell eQTLs. The median fold-change compared to background is plotted with 95% confidence intervals. The inset represents EBV-transformed B cell eQTL enrichments for human-specific regions. (B) Enrichments of divergent regions for 17 UKBB traits compared to the expected background. The median fold-change is plotted with 95% confidence intervals. (C) Heatmap of region enrichment scores for each of the 17 UKBB traits. The scores for the human-specific and macaque-specific groups are displayed for viral hepatitis C. For all plots, asterisks indicate one-sided empirical p < 0.05 compared to shuffled background (STAR Methods). All 95% confidence intervals were estimated from 10,000 bootstraps.
Figure 7
Figure 7
DNA sequence changes in cis perturb the regulatory activity of an enhancer near the trans-regulator ETS1 gene (A) Genomic context of a human-specific cis-only region within a putative ETS1 enhancer. Tracks for GM12878 H3K27ac and human B cell DNA methylation are shown. A zoomed-in view of the locus shows NHGRI GWAS SNPs, rs4262739, and rs4245080. The further zoomed-in view shows a multi-species sequence alignment highlighting macaque-specific substitutions within the human-specific cis-only region. Positions matching the human sequence are displayed as dots. TF motif positions affected by the substitutions are indicated with an outlined box. (B) Hi-C data browser view of the ETS1 locus in GM12878 cells. Vertical dashed line represents the relative location of the putative ETS1 enhancer. (C) ChIP-qPCR comparing immunoglobulin (Ig) G and H3K27ac enrichment at both the putative ETS1 enhancer and a positive control locus (FLI1 enhancer) in human (GM12878, blue) and macaque (LCL8664, orange) cells. (D) Luciferase assay of human and macaque DNA sequences for the human-specific cis-only region in human (GM12878) and macaque (LCL8664) cells. Normalized values are the ratio of background-corrected firefly luciferase to background-corrected renilla luciferase (internal control). We compared means between human and macaque sequences with a two-sided Wilcoxon-rank-sum (n ≥ 5). (E) Model of how cis changes can induce trans changes for other loci via TF expression/activity changes. cis changes alter the DNA sequence of a regulatory element, changing the affinity of TFs to the locus. This causes enhancer activity loss or gain, based on the ancestral activity state of the enhancer. Alteration of enhancer activity modifies the expression of target genes. If the target gene is a TF, the cis change also alters the cellular environment and causes a trans change for other regulatory regions. (F) Model of how regions divergent in both cis-and-trans jointly drive differential regulatory element activity. MRCA, most recent common ancestor. See also Figure S6.

Update of

Similar articles

Cited by

References

    1. King M.C., Wilson A.C. Evolution at two levels in humans and chimpanzees. Science. 1975;188:107–116. doi: 10.1126/science.1090005. - DOI - PubMed
    1. Britten R.J., Davidson E.H. Gene regulation for higher cells: a theory. Science. 1969;165:349–357. doi: 10.1126/science.165.3891.349. - DOI - PubMed
    1. Britten R.J., Davidson E.H. Repetitive and non-repetitive DNA sequences and a speculation on the origins of evolutionary novelty. Q. Rev. Biol. 1971;46:111–138. doi: 10.1086/406830. - DOI - PubMed
    1. Franchini L.F., Pollard K.S. Human evolution: the non-coding revolution. BMC Biol. 2017;15:89. doi: 10.1186/s12915-017-0428-9. - DOI - PMC - PubMed
    1. Sholtis S.J., Noonan J.P. Gene regulation and the origins of human biological uniqueness. Trends Genet. 2010;26:110–118. doi: 10.1016/j.tig.2009.12.009. - DOI - PubMed