. 2024 Apr 10;4(4):100537.
doi: 10.1016/j.xgen.2024.100537.

Mutant FOXO1 controls an oncogenic network via enhancer accessibility

Affiliations

Mutant FOXO1 controls an oncogenic network via enhancer accessibility

Hillary M Layden et al. Cell Genom. .

Abstract

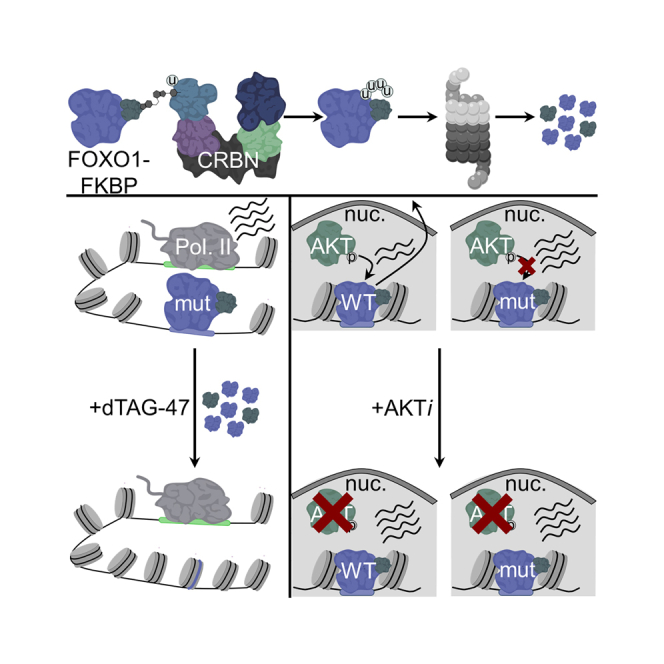
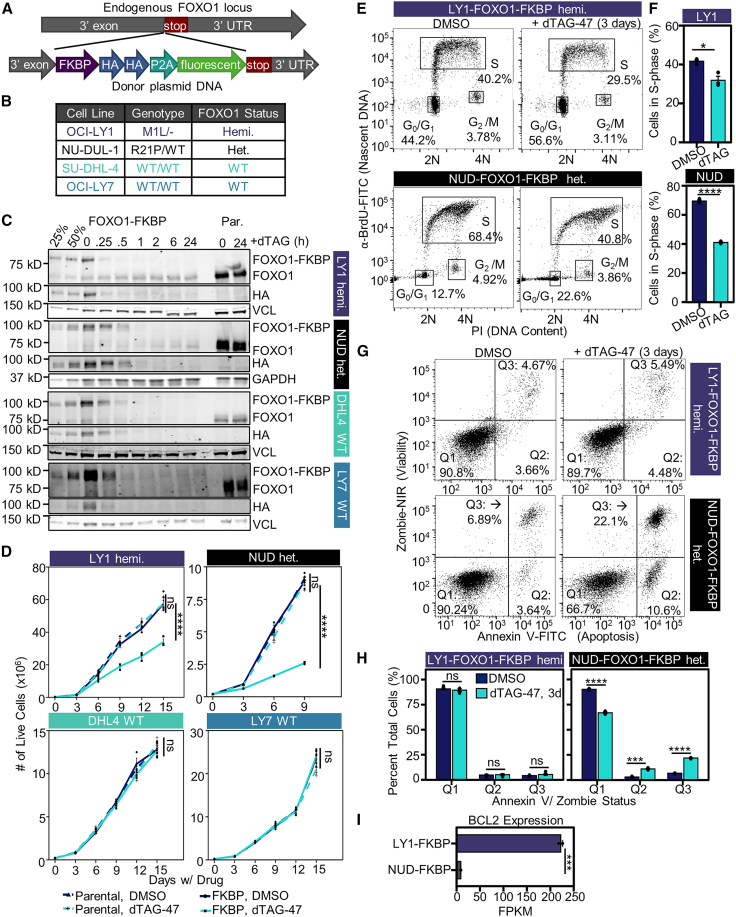
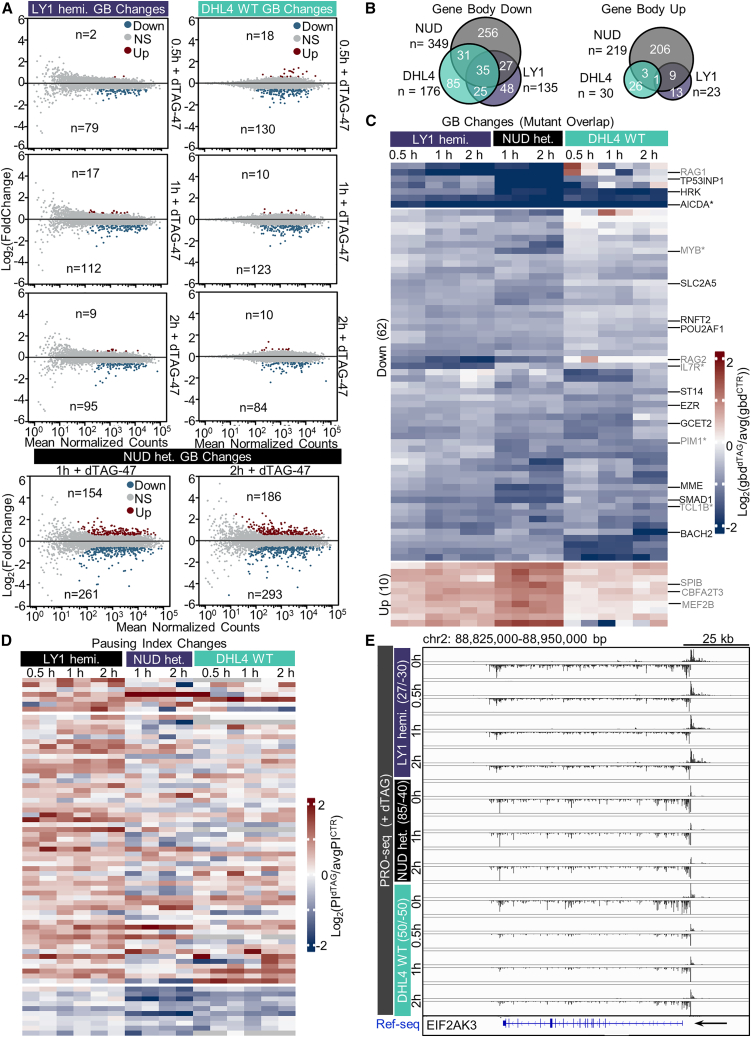
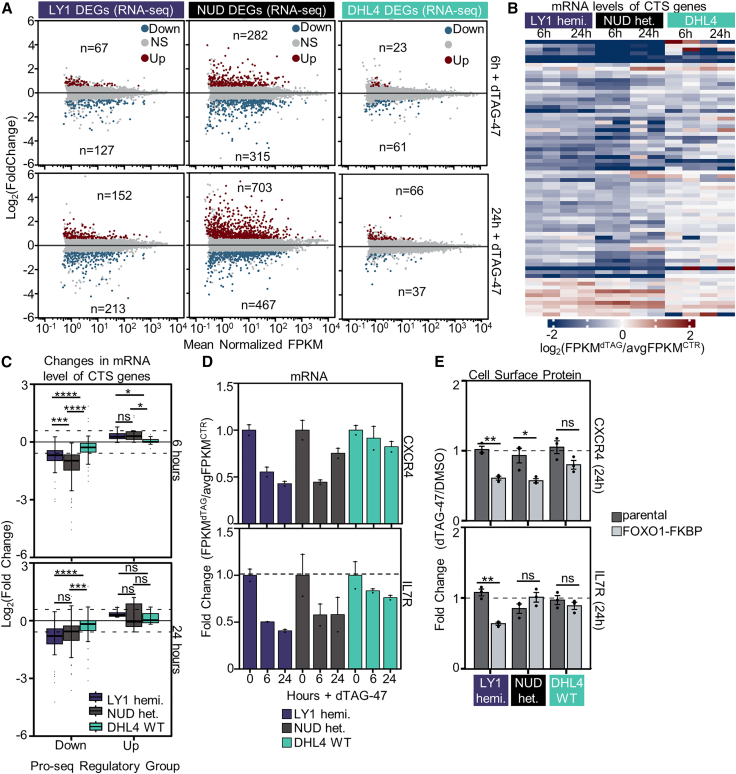
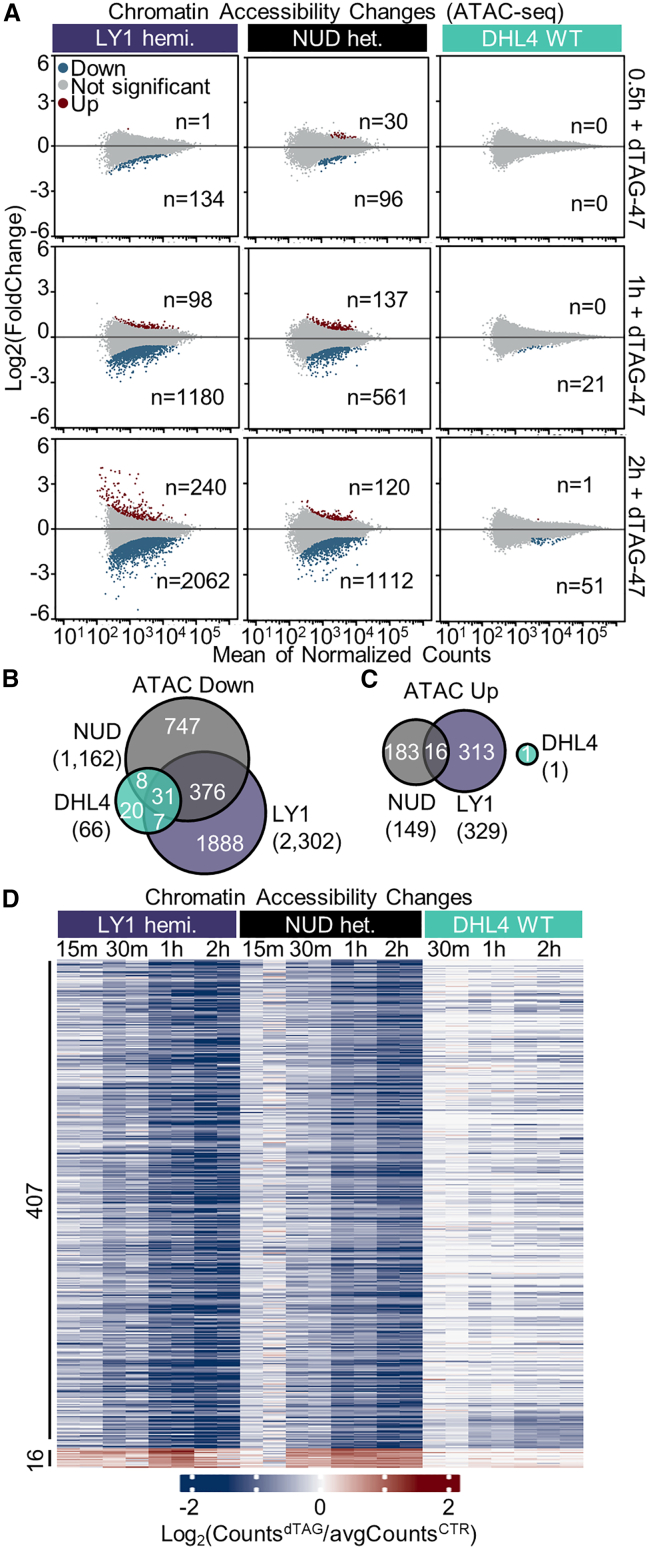
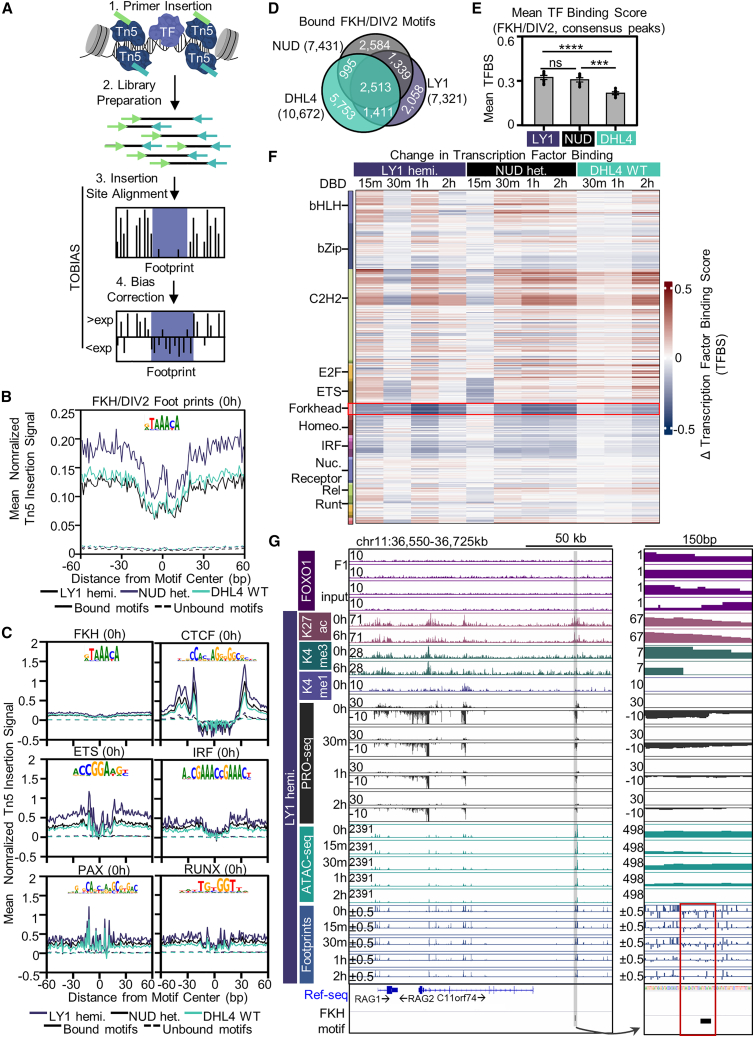
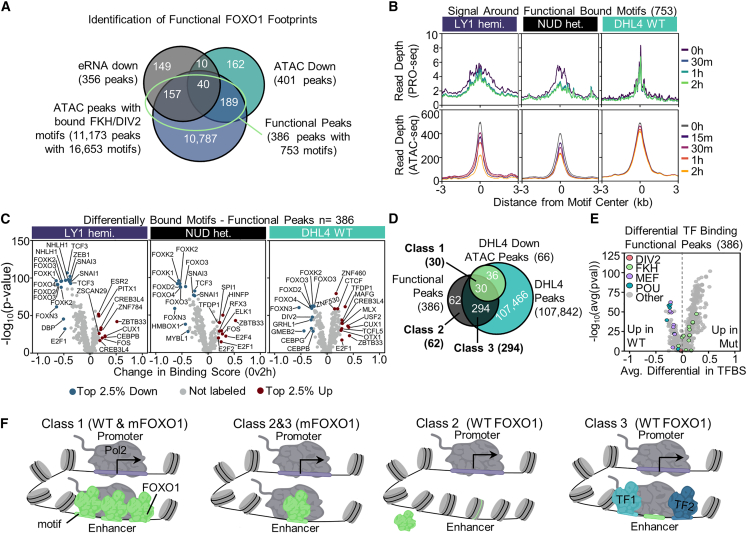
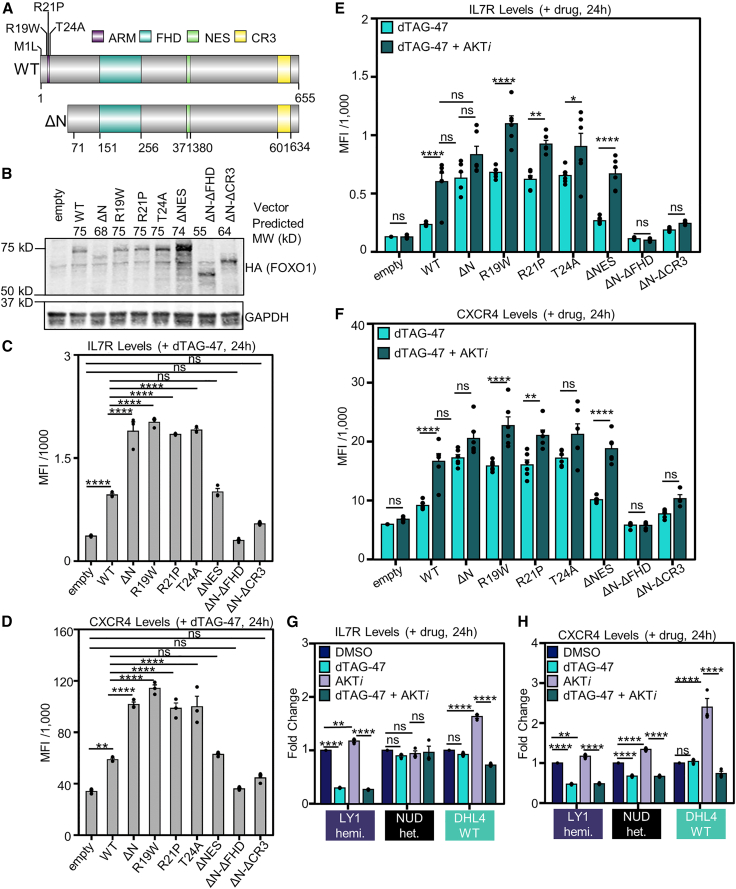
Transcriptional dysregulation is a hallmark of diffuse large B cell lymphoma (DLBCL), as transcriptional regulators are frequently mutated. However, our mechanistic understanding of how normal transcriptional programs are co-opted in DLBCL has been hindered by a lack of methodologies that provide the temporal resolution required to separate direct and indirect effects on transcriptional control. We applied a chemical-genetic approach to engineer the inducible degradation of the transcription factor FOXO1, which is recurrently mutated (mFOXO1) in DLBCL. The combination of rapid degradation of mFOXO1, nascent transcript detection, and assessment of chromatin accessibility allowed us to identify the direct targets of mFOXO1. mFOXO1 was required to maintain accessibility at specific enhancers associated with multiple oncogenes, and mFOXO1 degradation impaired RNA polymerase pause-release at some targets. Wild-type FOXO1 appeared to weakly regulate many of the same targets as mFOXO1 and was able to complement the degradation of mFOXO1 in the context of AKT inhibition.

Keywords: ATAC-seq; DLBCL; FOXO1; PRO-seq; chromatin remodeling; dark zone; enhancer; therapeutics.


Conflict of interest statement

Declaration of interests S.W.H. received research funding from Incyte Inc. through the Vanderbilt-Incyte Alliance during this work. These funds did not support this work.

Figures

None
Graphical abstract
Figure 1
Figure 1
mFOXO1 is required for DLBCL cell growth (A) Schematic of the HDR-based CRISPR-Cas9 targeting strategy used to target the C terminus of FOXO1. (B) The mutational status of FOXO1 in the panel of cell lines used. (C) FOXO1-FKBP and parental cell lines were treated with 500 nm dTAG-47 for the indicated length of time, and protein levels were assessed by anti-HA and anti-FOXO1 western blots. GAPDH and VCL served as loading controls. (D) Parental (dashed) and FOXO1-FKBP (solid) cells were treated with DMSO (dark blue) or 500 nM dTAG-47 (cyan) for up to 15 days, and growth was monitored by cell counts. Averaged growth curves with SEM from three biological replicates are shown (ANOVA). (E) FOXO1-FKBP cells were cultured with DMSO or 500 nM dTAG-47 for 3 days, incubated with bromodeoxyuridine (BrdU), and stained with anti-BrdU-fluorescein isothiocyanate (FITC) and PI for cell cycle analysis. Representative dot plots from one of three biological replicates are shown. (F) Quantification of the percentage of cells in S phase from three biological replicates with SEM (t test). (G) FOXO1-FKBP cells were treated with DMSO or 500 nm dTAG-47 for 3 days and stained with Zombie viability dye and Annexin V to assess apoptosis. Representative dot plots from one of three biological replicates are shown. (H) Quantification of the percentage of cells in each quartile with SEM (t test). (I) Quantification of BCL2 mRNA by RNA-seq in the NUD-FOXO1-FKBP and OCI-LY1-FKBP cell lines. Ns, not significant; ∗∗∗∗p < 0.0001, ∗∗∗p < 0.001, ∗∗p < 0.01, ∗p < 0.05. See also Figure S1.
Figure 2
Figure 2
FOXO1 regulates pause release at target genes (A) MA plots of gene body polymerase levels measured by PRO-seq 0.5, 1, and 2 h after FOXO1 degradation. Differentially transcribed genes (DTGs) are labeled in blue (down) or red (up) (padj <0.05 and fold change ≥|1.5|) (Wald test). (B) Overlap of DTGs between cell lines. (C) Heatmap of log2(gene body densitydTAG/avg gene body densityCTR) of DTGs in each PRO-seq replicate. DZ genes and other genes of interest are labeled in black and gray, respectively. Demonstrated oncogenes are denoted with an asterisk. (D) Heatmap of the average log2(pausing indexdTAG/avg pausing indexCTR) for each DTG. (E) IGV screenshot of the EIF2AK3 locus, showing stable levels of paused polymerase but decreased levels of gene body polymerase throughout the time course. PRO-seq experiments were performed in biological duplicate. See also Figure S2.
Figure 3
Figure 3
Degradation of FOXO1 disrupts the DZ gene expression program (A) MA plots of mRNA levels measured by RNA-seq 6 and 24 h after FOXO1 degradation. Differentially expressed genes (DEGs) are labeled in blue (down) or red (up) (padj <0.05 and fold change ≥|1.5|) (CuffDiff). (B) Heatmap of the log2(FPKMdTAG/avg FPKMCTR) for each DTG. (C) Boxplots show average log2(FoldChange) in mRNA levels separated by PRO-Seq regulatory group and cell line, 6 h (top) and 24 h (bottom) after dTAG-47 treatment (Wilcoxon). (D) Average fold change of mRNA levels of CXCR4 (top) and IL-7R (bottom) after dTAG-47 treatment with SEM from two biological replicates. (E) Average fold change of cell surface protein levels measured by flow cytometry (median fluorescence intensity) for CXCR4 (top) and IL-7R (bottom) 24 h after DMSO or dTAG-47 treatment with SEM from three biological replicates (t test). ∗∗∗∗p < 0.0001, ∗∗∗p < 0.001, ∗∗p < 0.01, ∗p < 0.05. See also Figure S3.
Figure 4
Figure 4
mFOXO1 is required to maintain chromatin accessibility at regulated enhancers (A) MA plots of ATAC-seq peaks measured by ATAC-seq 0.5, 1, and 2 h after FOXO1 degradation. Differentially accessible peaks are labeled in blue (down) or red (up) (padj <0.05 and fold change ≥|1.5|) (Wald test). (B) Overlap of ATAC-seq peaks with decreased accessibility between cell lines. (C) Overlap of peaks with increased accessibility between cell lines. (D) Heatmap of the log2(countsdTAG/avg(countsCTR)) for each differentially accessible ATAC-seq peak shared by the mutant cell lines at each ATAC-seq time point. ATAC-seq experiments were performed in biological duplicate or triplicate. See also Figure S4.
Figure 5
Figure 5
TF footprinting identifies FOXO1-bound forkhead motifs (A) Schematic of the TF footprinting workflow. (B) Mean normalized Tn5 insertion signal around FKH/DIV2 motifs, calculated with TOBIAS from ATAC samples before FOXO1 degradation. Motifs were classified as “bound” or “unbound” by TOBIAS. (C) Mean normalized Tn5 insertion signal around FKH/DIV2, CTCF, ETS, IRF, PAX, and RUNX motifs, calculated with TOBIAS from ATAC samples before FOXO1 degradation. Motifs were classified as “bound” or “unbound” by TOBIAS. (D) Overlap of bound FKH/DIV2 motifs in each cell line. (E) Bar graph showing the mean TF binding score (TFBS) at FKH/DIV2-bound motifs within consensus ATAC peaks with SEM (ANOVA). Data points represent mean TFBS for individual motif sequences. ∗∗∗∗p < 0.0001, ∗∗∗p < 0.001. (F) Heatmap of the change in TFBS for motifs sequences associated with all expressed TFs, by DNA binding domain (DBD). FKH motifs are outlined by a red box. (G) Representative screenshot of a bound FKH motif near the RAG locus in the OCI-LY1 cell line. Purple tracks show the previously published FOXO1 ChIP-seq or input signal from human tonsillar GC B cells. Pink tracks show the H3K27ac ChIP-seq signal from 0 h and 6h after FOXO1 degradation in the OCI-LY1 cells. Green tracks show the H3K4me3 CUT&RUN signal from 0 h and 6h after FOXO1 degradation in the OCI-LY1 cells. Blue-purple track shows previously published H3K4me1 ChIP-seq data from OCI-LY1 cells. Gray tracks show the PRO-seq signal at 0–2 h from OCI-LY1 cells. Teal tracks show the ATAC-seq signal from 0–2h from OCI-LY1 cells. Blue tracks show the corrected footprint signal (observed:expected insertions) from 0–2 h from OCI-LY1 cells. Right: a magnified view of the area shaded by a gray box. The Bound FKH motif (red box, right) loses FOXO1 binding and is subsequently remodeled. ATAC-seq experiments were performed in biological duplicate or triplicate. See also Figure S5.
Figure 6
Figure 6
WT FOXO1 does not control activation of most mFOXO1 target enhancers (A) Overlap of downregulated eRNA, decreased ATAC peaks, and ATAC-seq peaks with bound FKH/DIV2 motifs. A green oval highlights the FOXO1 bound motifs that impact transcription or chromatin accessibility (termed functional peaks/motifs). (B) Histogram of the PRO-seq signal (top) or ATAC-seq signal (bottom) around the center of functional FKH/DIV2 motifs. (C) Differential binding scores for motifs located within the functional peaks were calculated between the 0-h and 2-h time points for each cell line. The volcano plot shows the change in binding versus –log10(p value) calculated by TOBIAS for all investigated motifs associated with expressed TFs. Each dot represents an individual motif. See STAR Methods for labeling criteria. Blue indicates decreased binding and red increased binding after FOXO1 degradation. (D) Overlap of functional peaks (gray), DHL4 consensus ATAC peaks (aqua), and DHL4 significantly downregulated ATAC peaks (green). Different regulatory classes of FOXO1-controlled enhancers are indicated. (E) Differential binding scores for motifs located within the functional peaks were calculated between the 0-h time points of the WT and each mFOXO1 cell line individually using TOBIAS. These results were averaged together to identify motifs differentially bound in the WT vs. mFOXO1 cell lines. The volcano plot shows the average change in binding versus −log10(avg(p value)) calculated by TOBIAS for all investigated motifs associated with expressed TFs. Each dot represents an individual motif. Pink, DIV2; green, FKH family; purple, MEF2 family; aqua. POU family. (F) Schematic of different FOXO1 controlled enhancer classes in WT and mutant cell lines. See also Figure S6.
Figure 7
Figure 7
AKT signaling prevents WT FOXO1 from rescuing mFOXO1 transcriptional activity (A) Schematic depicting point mutations and domains targeted to assess FOXO1 transcriptional function. ARM, AKT regulatory motif; FHD, Forkhead domain (DNA-binding domain); NES, nuclear export sequence; CR3, conserved region 3 (transcriptional activation domain). (B) Western blot showing expression levels WT FOXO1 and specified point mutants or domain deletions in 293FT cells. (C) Quantification of IL-7R protein levels in the OCI-LY1-FOXO1-FKBP cell line 24 h after dTAG-47 treatment. Data are presented as average median fluorescence intensity (MFI) with SEM from three biological replicates (ANOVA). (D) Quantification of CXCR4 protein levels in the OCI-LY1-FOXO1-FKBP cell line 24 h after dTAG-47 treatment. Data are presented as average MFI with SEM from three biological replicates (ANOVA). (E) Quantification of IL-7R protein levels in the OCI-LY1-FOXO1-FKBP cell line 24 h after treatment with dTAG-47 alone or in combination with capivasertib (AKT inhibitor). Data are presented as average MFI with SEM from 4–6 biological replicates (ANOVA). (F) Quantification of CXCR4 protein levels in the OCI-LY1-FOXO1-FKBP cell line 24 h after treatment with dTAG-47 alone or in combination with capivasertib (AKT inhibitor). Data are presented as average MFI with SEM from 4 to 6 biological replicates (ANOVA). (G) Average fold change with SEM of IL-7R protein levels 24 h after treatment with the specified drug from three biological replicates (ANOVA). (H) Average fold change with SEM of CXCR4 protein levels 24 h after treatment with the specified drug from three biological replicates (ANOVA). ∗∗∗∗p < 0.0001, ∗∗∗p < 0.001, ∗∗p < 0.01, ∗p < 0.05. See also Figure S7.

Similar articles

Cited by

References

    1. Pasqualucci L. Molecular pathogenesis of germinal center-derived B cell lymphomas. Immunol. Rev. 2019;288:240–261. doi: 10.1111/imr.12745. - DOI - PubMed
    1. Friedberg J.W. Relapsed/refractory diffuse large B-cell lymphoma. American Society of Hematology. 2011 doi: 10.1182/asheducation-2011.1.498. Preprint at. - DOI - PubMed
    1. Roschewski M., Staudt L.M., Wilson W.H., Roschewski M., Staudt L.M., Wilson W.H. Diffuse large B-cell lymphoma—treatment approaches in the molecular era. Nat. Publ. Group. 2014;11:12–23. doi: 10.1038/nrclinonc.2013.197. - DOI - PMC - PubMed
    1. Morin R.D., Mendez-Lago M., Mungall A.J., Goya R., Mungall K.L., Corbett R.D., Johnson N.A., Severson T.M., Chiu R., Field M., et al. Frequent mutation of histone-modifying genes in non-Hodgkin lymphoma. Nature. 2011;476:298–303. doi: 10.1038/nature10351. - DOI - PMC - PubMed
    1. Trinh D.L., Scott D.W., Morin R.D., Mendez-Lago M., An J., Jones S.J.M., Mungall A.J., Zhao Y., Schein J., Steidl C., et al. Analysis of FOXO1 mutations in diffuse large B-cell lymphoma. Blood. 2013;121:3666–3674. doi: 10.1182/blood-2013-01-479865. - DOI - PMC - PubMed

MeSH terms

Substances