. 2024 May:180:279-294.
doi: 10.1016/j.actbio.2024.04.007. Epub 2024 Apr 10.

An engineered in vitro model of the human myotendinous junction

Affiliations

An engineered in vitro model of the human myotendinous junction

Mitchell Josvai et al. Acta Biomater. 2024 May.

Abstract

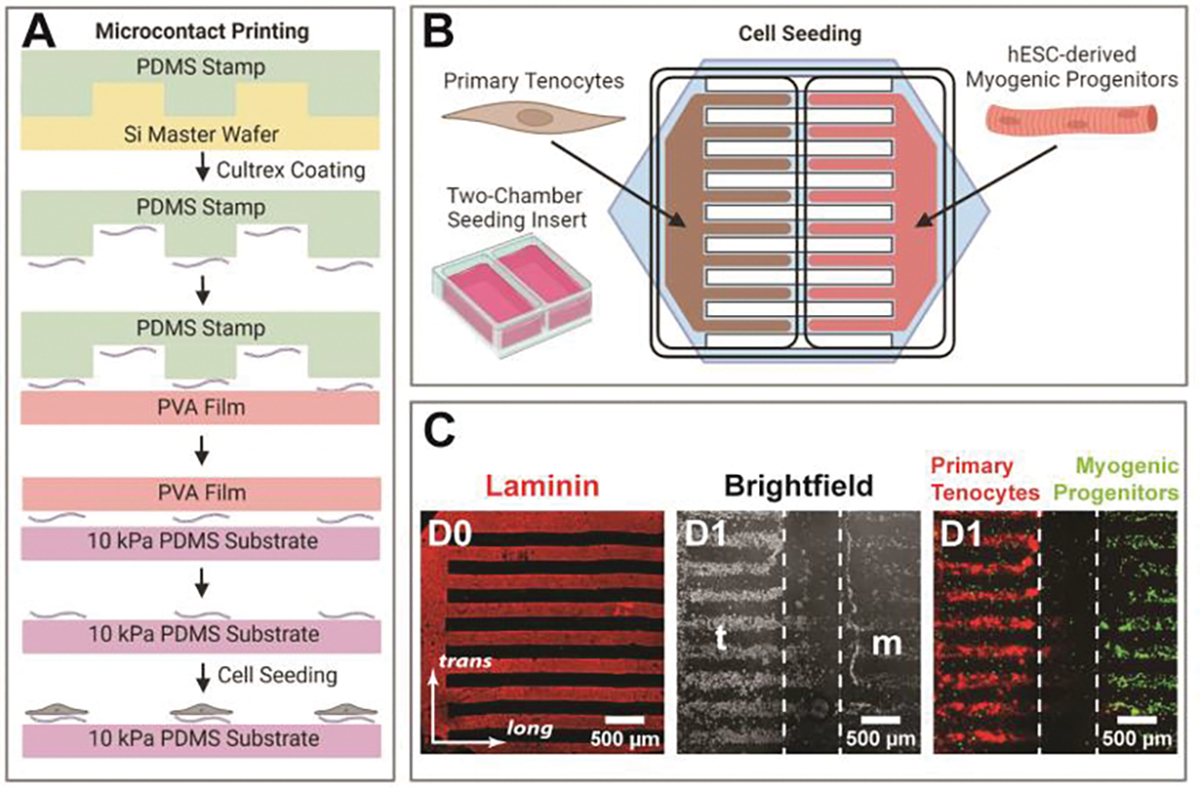
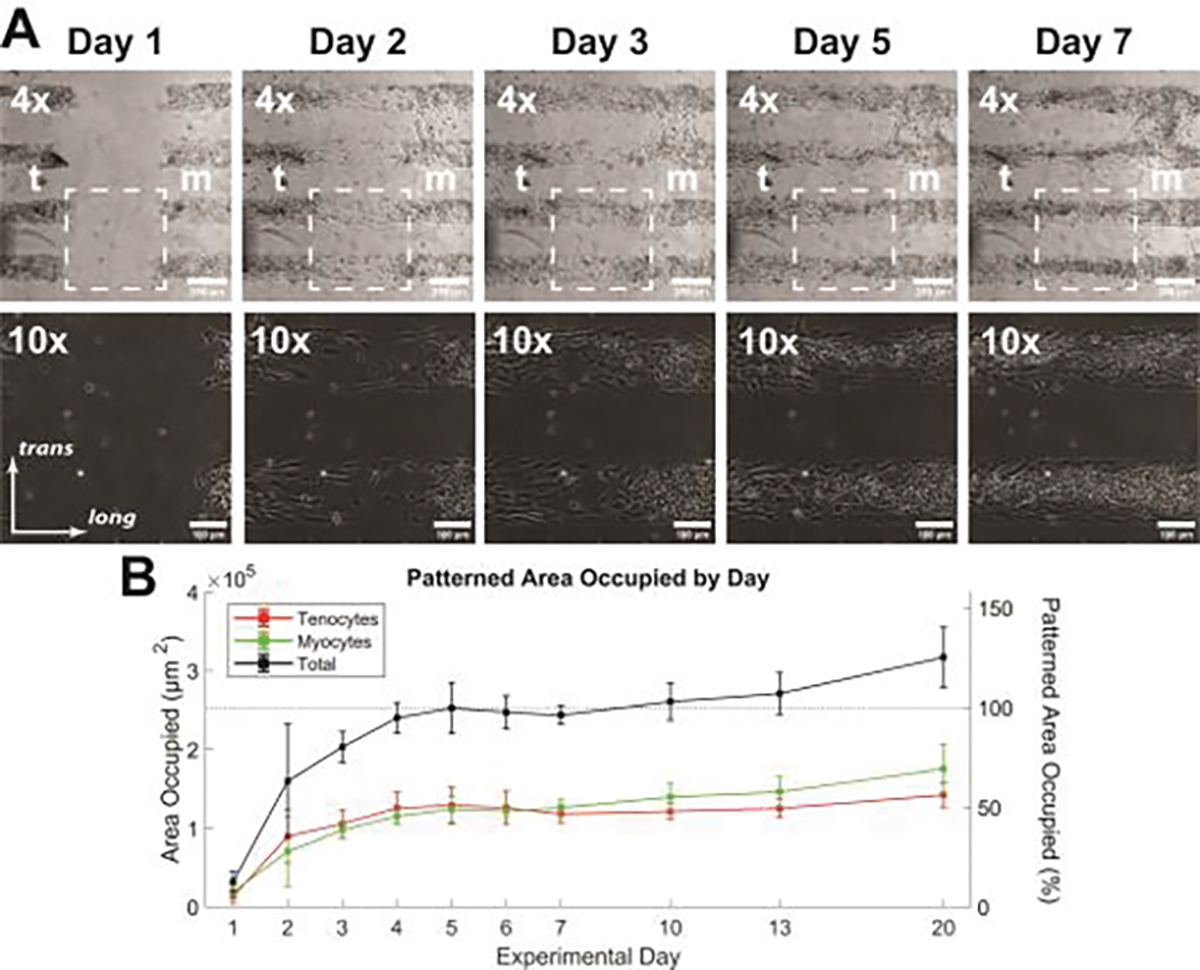
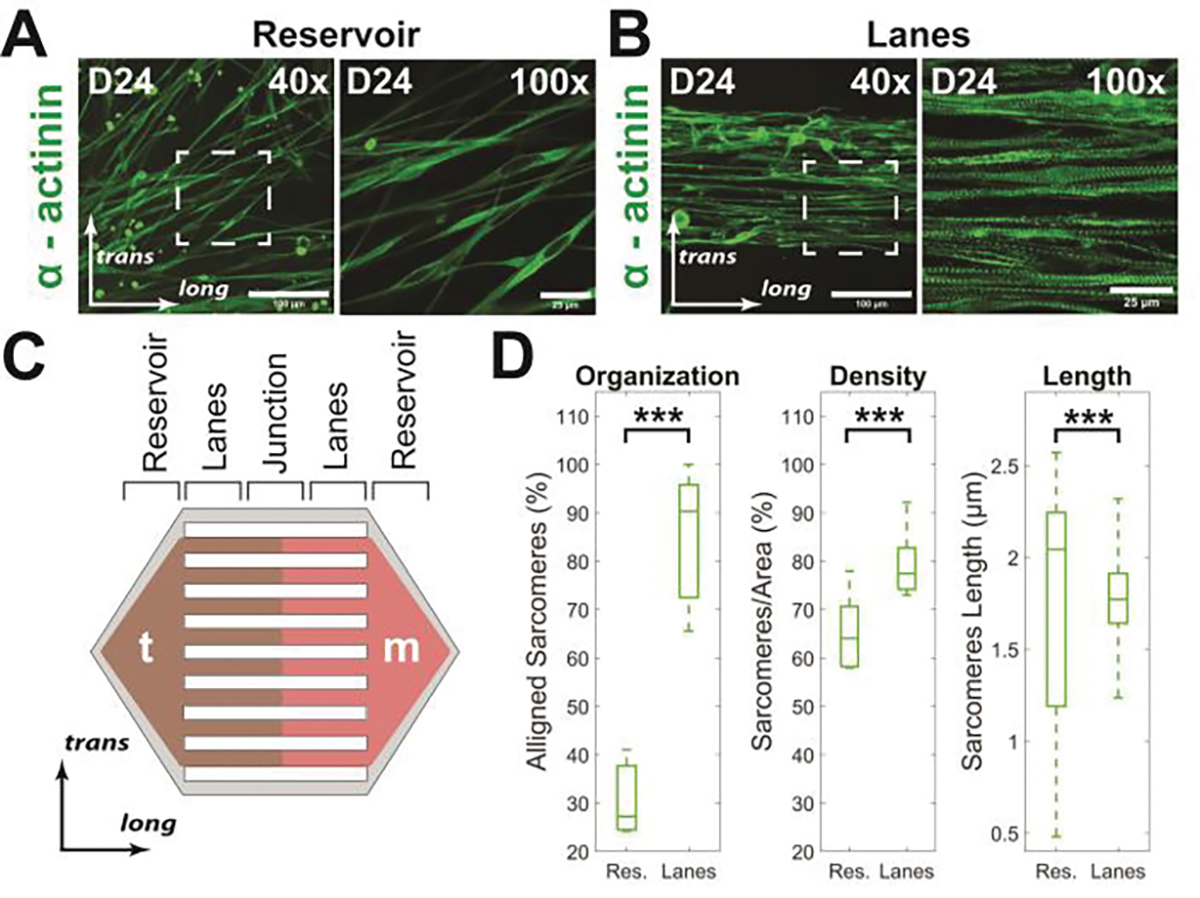
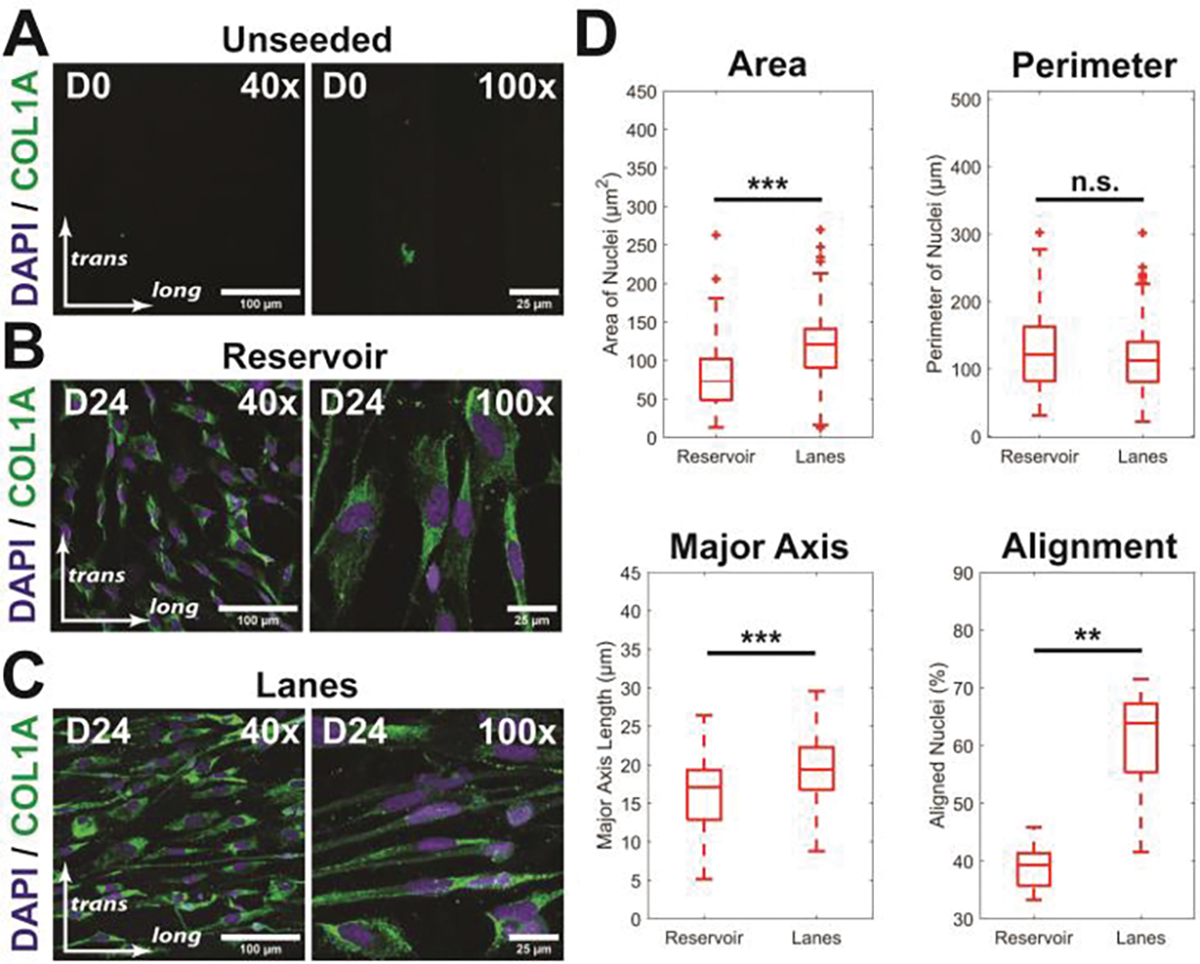
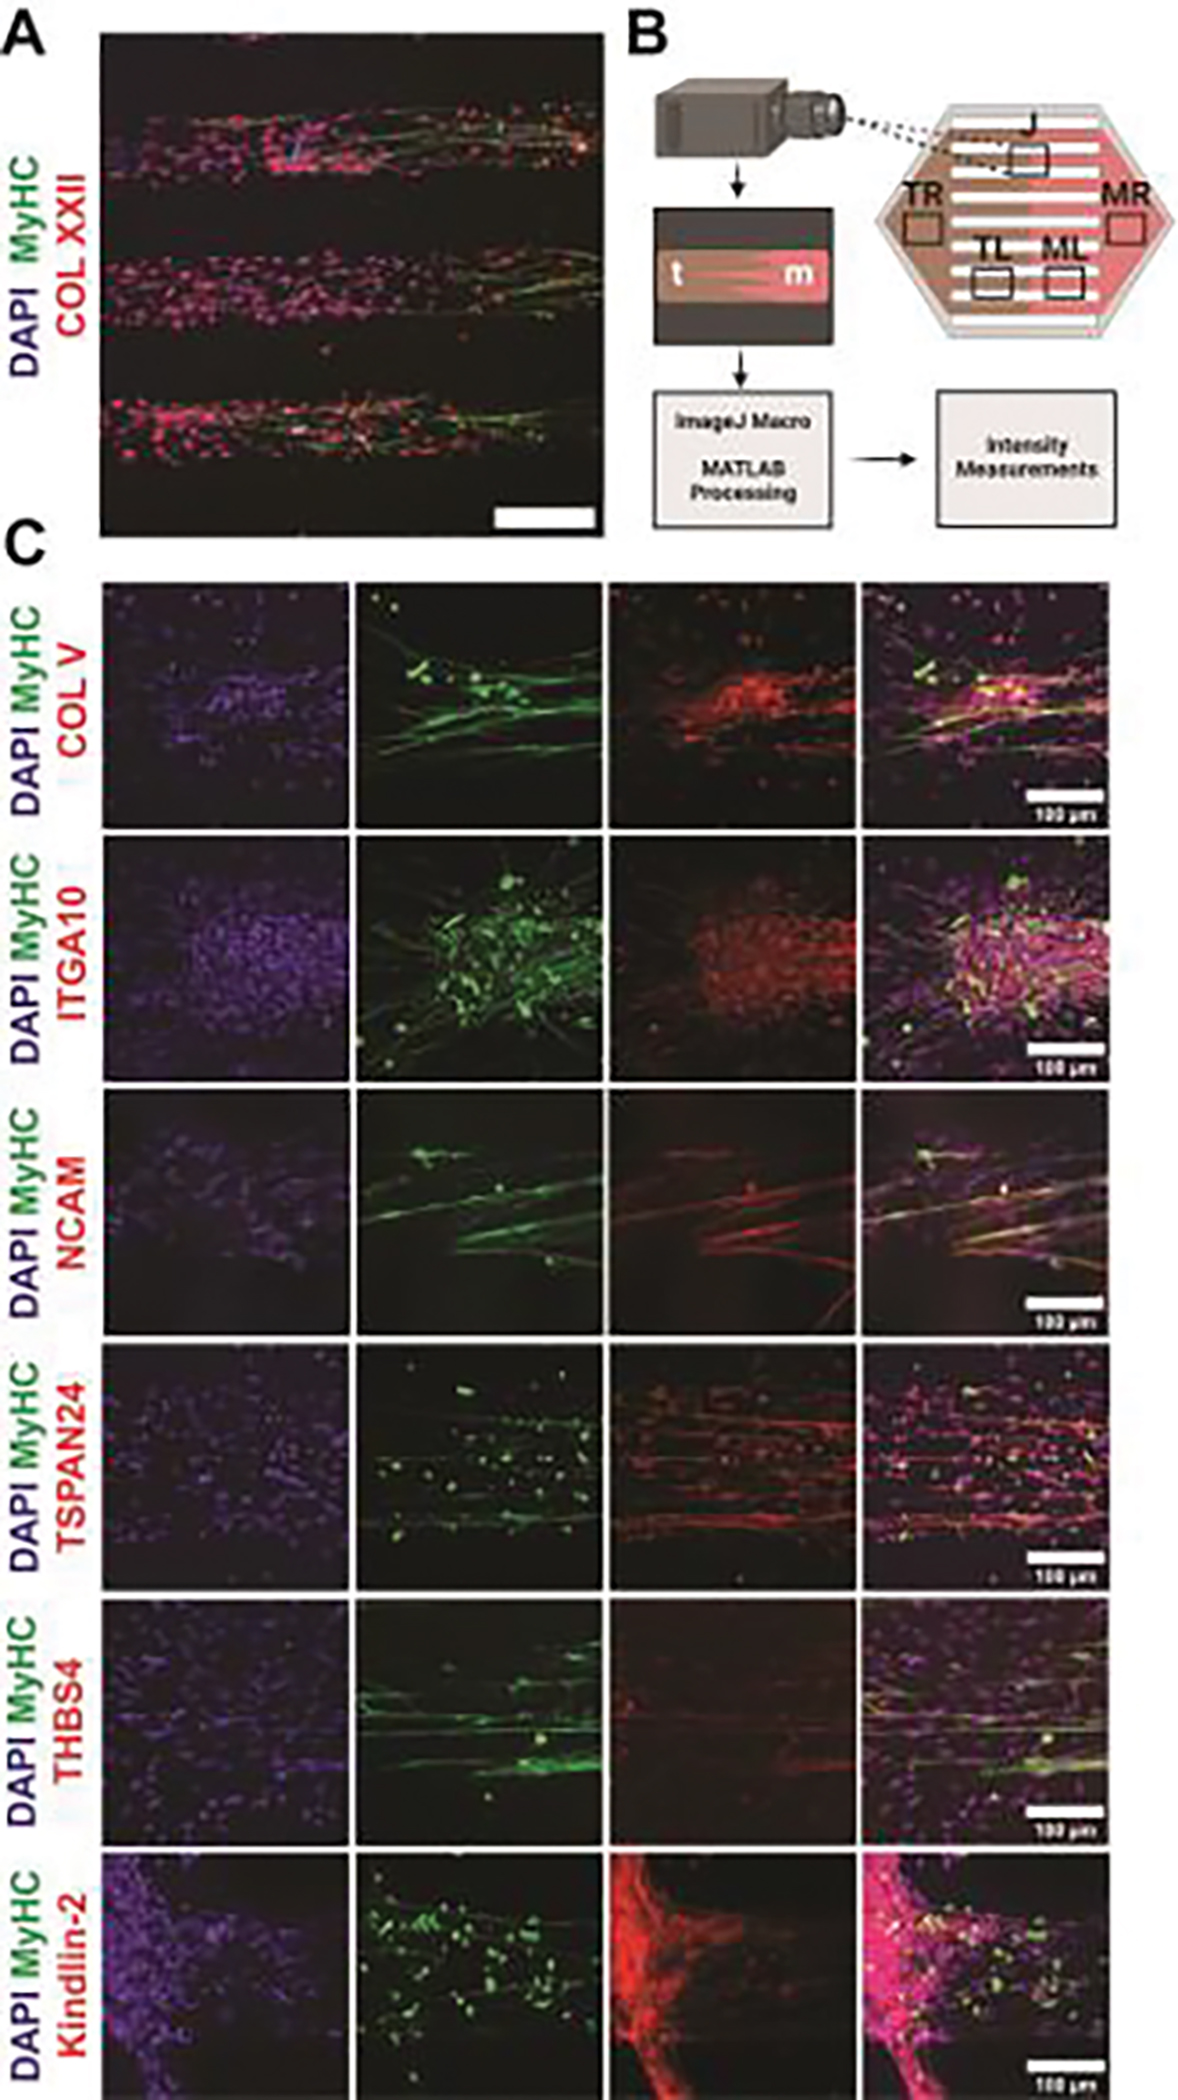
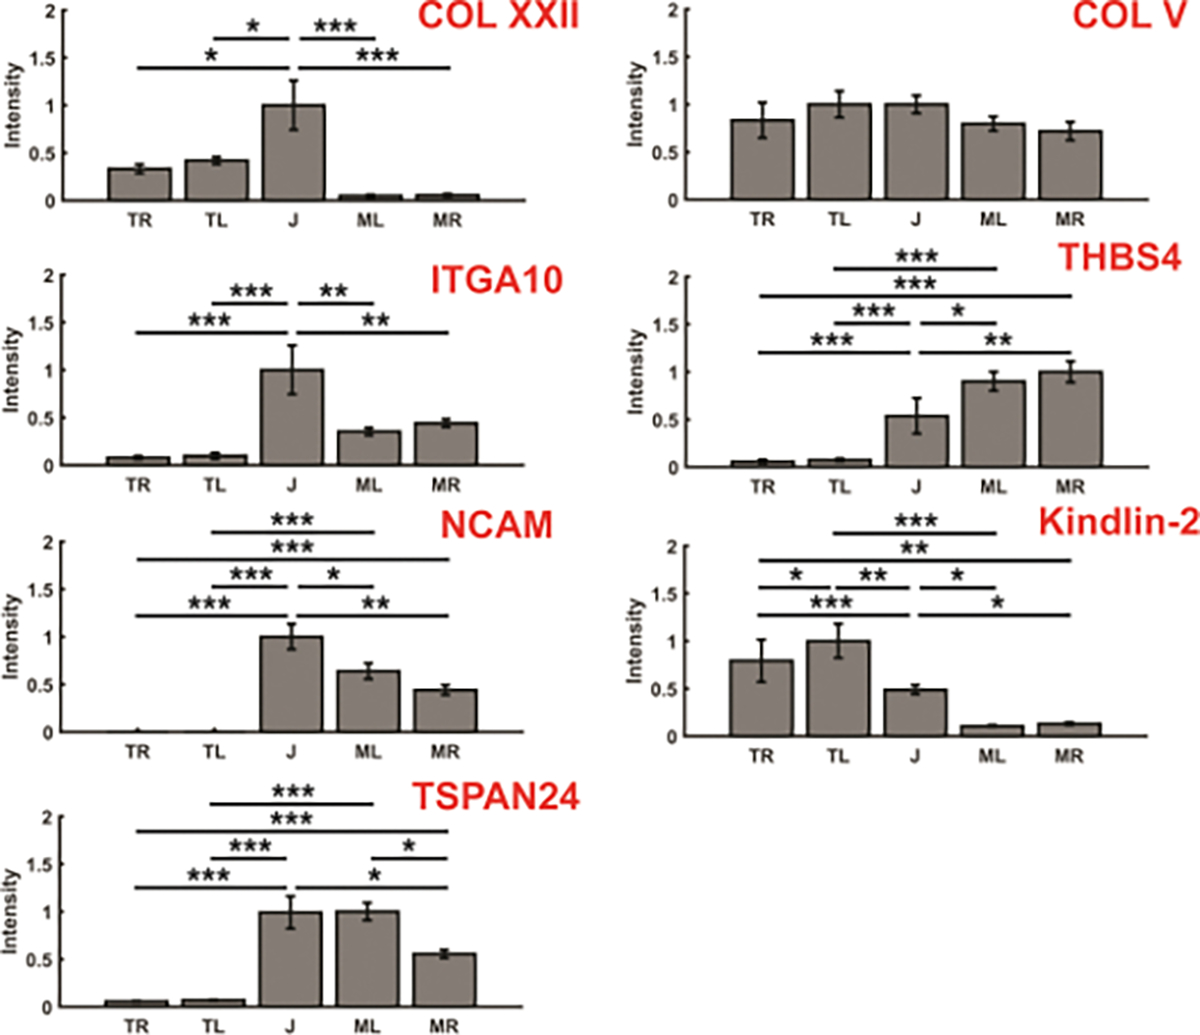
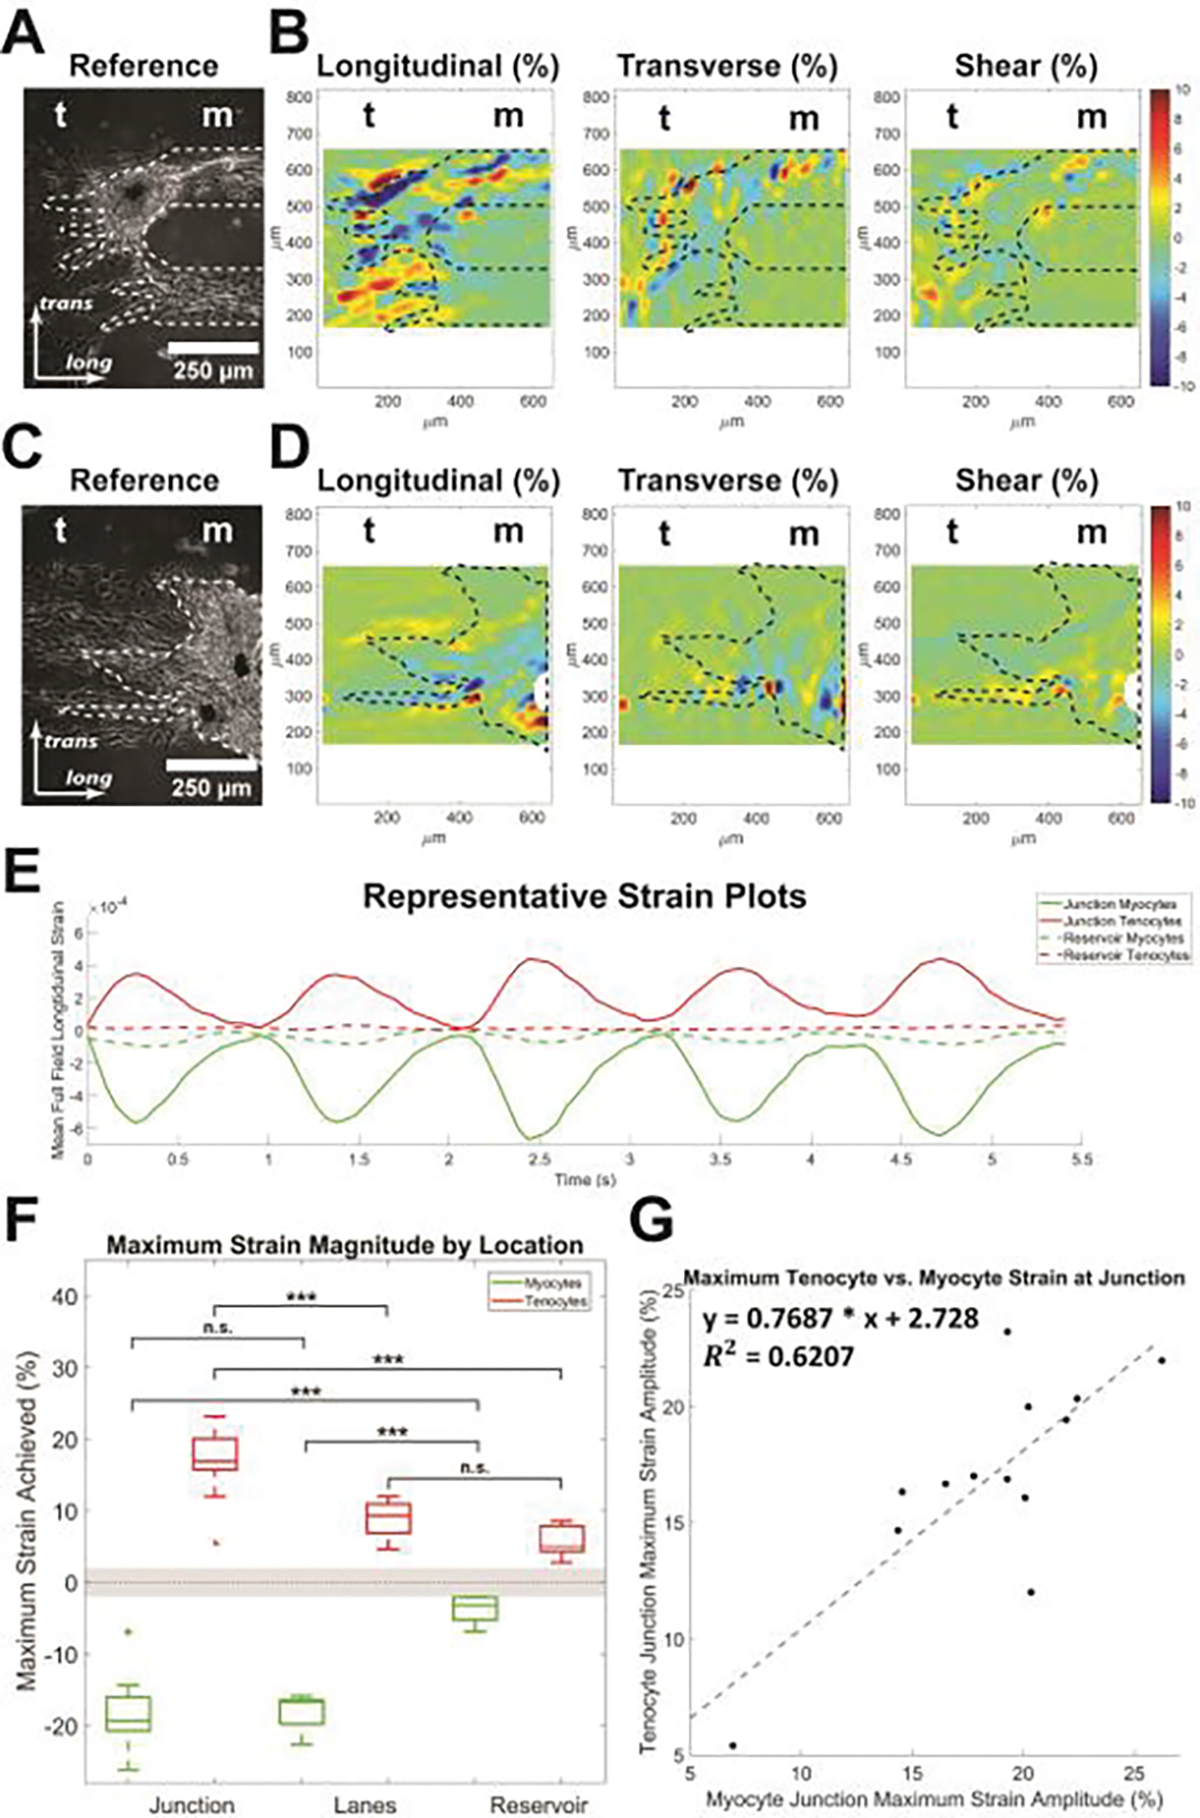
The myotendinous junction (MTJ) is a vulnerable region at the interface of skeletal muscle and tendon that forms an integrated mechanical unit. This study presents a technique for the spatially restrictive co-culture of human embryonic stem cell (hESC)-derived skeletal myocytes and primary tenocytes for two-dimensional modeling of the MTJ. Micropatterned lanes of extracellular matrix and a 2-well culture chamber define the initial regions of occupation. On day 1, both lines occupy less than 20 % of the initially vacant interstitial zone, referred to henceforth as the junction. Myocyte-tenocyte interdigitations are observed by day 7. Immunocytochemistry reveals enhanced organization and alignment of patterned myocyte and tenocyte features, as well as differential expression of multiple MTJ markers. On day 24, electrically stimulated junction myocytes demonstrate negative contractile strains, while positive tensile strains are exhibited by mechanically passive tenocytes at the junction. Unpatterned tenocytes distal to the junction experience significantly decreased strains in comparison to cells at the interface. Unpatterned myocytes have impaired organization and uncoordinated contractile behavior. These findings suggest that this platform is capable of inducing myocyte-tenocyte junction formation and mechanical coupling similar to the native MTJ, showing transduction of force across the cell-cell interface. STATEMENT OF SIGNIFICANCE: The myotendinous junction (MTJ) is an integrated structure that transduces force across the muscle-tendon boundary, making the region vulnerable to strain injury. Despite the clinical relevance, previous in vitro models of the MTJ lack the structure and mechanical accuracy of the native tissue and have difficulty transmitting force across the cell-cell interface. This study demonstrates an in vitro model of the MTJ, using spatially restrictive cues to inform human myocyte-tenocyte interactions and architecture. The model expressed MTJ markers and developed anisotropic myocyte-tenocyte integrations that resemble the native tissue and allow for force transduction from contracting myocytes to passive tenocyte regions. As such, this study presents a system capable of investigating development, injury, and pathology in the human MTJ.

Keywords: In vitro modeling; Micropattern; Myotendinous junction; Skeletal myocytes; Tenocytes.


Conflict of interest statement

Declaration of competing interest The authors declare that they have no known competing financial interests or personal relationships that could have appeared to influence the work reported in this paper.

Figures

Figure 1.
Figure 1.
Approach to model human myotendinous junction (MTJ) using micropatterned culture platforms. (A) Microcontact printing of Cultrex Basement Membrane Extract (R&D Systems, Minneapolis, MN) in defined spatial patterns. PDMS stamps are coated in Cultrex, which is then transferred to a PVA film, and finally to the culture substrate. (B) Parallel seeding of tenocytes and myocytes onto microprinted ECM proteins to model the MTJ (not to scale). (C) Immunofluorescent labeling of Laminin distribution in a defined pattern prior to cell seeding (left), Brightfield image of seeded cells within patterned lanes on Day 1 (center), and fluorescent dye labeling of tenocytes and myogenic progenitors on Day 1 (right). t: tenocytes, m: myogenic progenitors. Dotted lines denote the previous location of the two-well seeding chamber divider before removal. Scale bar = 500 μm.
Figure 2.
Figure 2.
Myogenic and tenogenic expansion induces junction formation. (A) Representative Brightfield images at 4x (top) and 10x (bottom) at the myocyte-tenocyte interface. Progressive invasion of patterned but unoccupied regions of the substrate are observed from Days 1–7. Timelapse videos of days 1 through 7 at each magnification are available as Supplemental Videos 1–2. Scale bar: top = 250 μm, bottom = 100 μm. (B) Patterned area in square micrometers occupied by myocytes, tenocytes, and a combination of the two cell types (left axis), and percent of patterned area occupied by each cell type and a combination of the two, normalized to the initial patterned area (right axis). t: tenocytes, m: myocytes. The dotted line denotes 100% initial pattern occupancy (i.e., the combined area of cells occupies 100% of the area of the micropatterned lanes, not the entirety of the area of the imaging field. See Figure 2A, Day 7, for a representative image of 100% initial pattern occupancy). n = 9 for all groups.
Figure 3.
Figure 3.
Myofibrillar assembly is enhanced in lanes. (A) Representative images of myocytes stained for the sarcomere protein α-actinin located either within a reservoir or (B) lane (Scale bars: left = 100 μm, right = 25 μm). (C) Regions of interest within the pattern, including the junction with both myocytes and tenocytes, as well as lanes and a reservoir of each cell type individually. (D) Myocytes within lanes have significantly increased sarcomere alignment (left) and sarcomere density (center), and a significantly decreased sarcomere length (right) when compared to myocytes within reservoir regions. n = 6 samples with for both reservoir and lane plots. ***p < 0.001.
Figure 4.
Figure 4.
Tenocytes produce and deposit characteristic ECM on platform. (A) Representative images stained for cell nuclei (DAPI) and the ECM protein subunit Collagen Type IA (COL1A) for patterned but unseeded day 0 platforms. (B) Day 24 tenocytes in the lanes and (C) reservoir, stained for Col1A and DAPI. Scale bar: left = 100 μm, right = 25 μm. (D) Comparison of the nuclei area, perimeter, major axis length, and alignment for tenocytes located in lanes and the reservoir region. n = 6 images (2 locations each from 3 samples) for both reservoir and lane samples. **p < 0.01, ***p < 0.001.
Figure 5.
Figure 5.
Immunocytochemical analysis of selected MTJ markers. (A) Representative day 24 image of three neighboring lanes, labeled for myosin heavy chain (MyHC, green), cell nuclei (DAPI, blue), and Collagen Type XXII (COL XXII, red) demonstrating integrated structures between cell types. Scale bar = 250 μm. (B) Schematic of the regions of interest for MTJ marker expression profiles, including distal tenocytes (t), the in vitro junction (j) and distal myocytes (m). Images are processed using an ImageJ macro and Matlab to determine intensity. (C) Representative images of the myocyte-tenocyte interface, MyHC (green), DAPI (blue), and one of the following MTJ markers previously described in the literature (red, references available in Table S1): Collagen Type V (COL V), Integrin alpha 10 (ITGA10), Neural cell adhesion molecule (NCAM), Tetraspanin-24 (TSPAN24), Thrombospondin-4 (THBS4), and Kindlin-2.
Figure 6.
Figure 6.
Fluorescent intensity of each identified MTJ marker described in day 24 myocyte, junction, and tenocyte regions. The applied metric of intensity was Corrected Total Cell Fluorescence (CTCF) and was calculated by subtracting the integrated fluorescent density of the background from the integrated cell fluorescent density, as described in the methods. n = 12 (4 images from each region of interest in 3 samples). Error bars represent standard error. *p < 0.05, **p < 0.01, ***p < 0.001. TR: tenocytes in reservoirs, TL: tenocytes in lanes, J: junctions, ML: myocytes in lanes, MR: myocytes in reservoirs.
Figure 7.
Figure 7.
Electrical stimulation and contractile strain analysis at the junction. (A) A representative phase contrast image of a junction with tenocytes (left) and two unfused myogenic lanes (right) in a relaxed state prior to stimulation. The dotted line represents the myogenic regions of cells identified through automatic edge detection software. Scale bar = 250 μm. (B) Representative heat map plots of the junction from (A) in a contracted state, showing the longitudinal strain in the direction of the patterned lanes (left), the transverse strain perpendicular to the patterned lanes (center), and the shear strain (right). (C) A representative phase contrast image of a junction with tenocytes (left) and two fused myogenic lanes (right) in a relaxed state prior to stimulation. Scale bar = 250 μm. (D) Representative heat map plots of the junction from (C) in a contracted state. Full phase contrast videos and the corresponding heatmaps are included as Supplemental Videos 3–6. (E) Representative strain plots for myocytes and tenocytes at the junction, as well as distal myocytes or tenocytes in the reservoir regions of the pattern stimulated at 20 V, 1 Hz, 5 ms. (F) The maximum magnitude of strain achieved by each cell type in each region when stimulated at 20V, 1 Hz, 5 ms. n = 13 for myocytes and tenocytes at the junction, n = 9 for myocytes and tenocytes in lanes and tenocytes in the reservoir, n = 8 for myocytes in the reservoir. Starred points represent outlier data. The dotted line represents zero strain, while the shaded area represents the noise limit of DIC detection. (G) Myocyte (horizontal axis) and tenocyte (vertical axis) maximum magnitude of strain demonstrate a positive correlation, indicating mechanical integrity across the cell boundary. t: tenocytes, m: myocytes. ***p < 0.001.

Similar articles

Cited by

References

    1. Trotter JA, Functional Morphology of Force Transmission in Skeletal Muscle, Cells Tissues Organs. 146 (1993) 205–222. 10.1159/000147459. - DOI - PubMed
    1. Jakobsen JR, Krogsgaard MR, The Myotendinous Junction—A Vulnerable Companion in Sports. A Narrative Review, Front. Physiol. 12 (2021) 635561. 10.3389/fphys.2021.635561. - DOI - PMC - PubMed
    1. Miyamoto-Mikami E, Kumagai H, Kikuchi N, Kamiya N, Miyamoto N, Fuku N, eQTL variants in COL22A1 are associated with muscle injury in athletes, Physiological Genomics. 52 (2020) 588–589. 10.1152/physiolgenomics.00115.2020. - DOI - PubMed
    1. Nescolarde L, Terricabras J, Mechó S, Rodas G, Yanguas J, Differentiation Between Tendinous, Myotendinous and Myofascial Injuries by L-BIA in Professional Football Players, Front. Physiol. 11 (2020) 574124. 10.3389/fphys.2020.574124. - DOI - PMC - PubMed
    1. Knudsen A, Mackey AL, Jakobsen JR, Krogsgaard MR, No demonstrable ultrastructural adaptation of the human myotendinous junction to immobilization or 4 weeks of heavy resistance training, Transl Sports Med. 4 (2021) 431–438. 10.1002/tsm2.243. - DOI

Publication types

LinkOut - more resources