. 2024 Jun;23(6):100764.
doi: 10.1016/j.mcpro.2024.100764. Epub 2024 Apr 9.

Multi-Omic Analysis of Esophageal Adenocarcinoma Uncovers Candidate Therapeutic Targets and Cancer-Selective Posttranscriptional Regulation

Collaborators, Affiliations

Multi-Omic Analysis of Esophageal Adenocarcinoma Uncovers Candidate Therapeutic Targets and Cancer-Selective Posttranscriptional Regulation

J Robert O'Neill et al. Mol Cell Proteomics. 2024 Jun.

Abstract

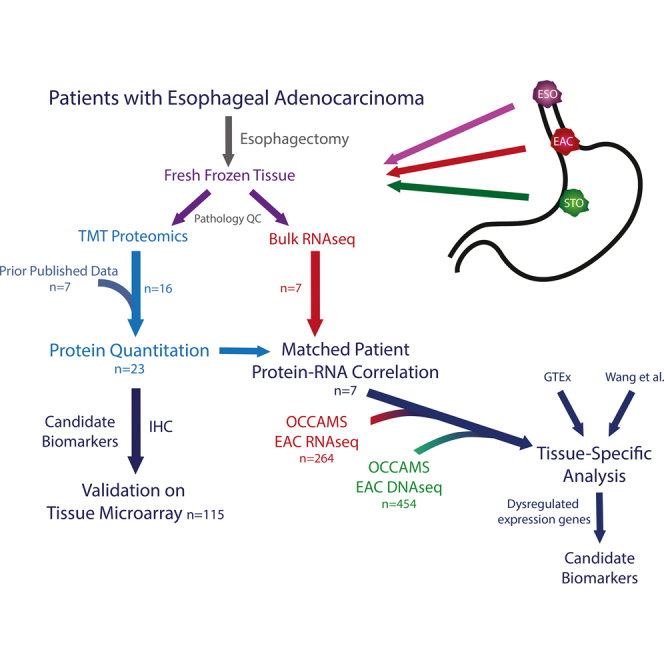
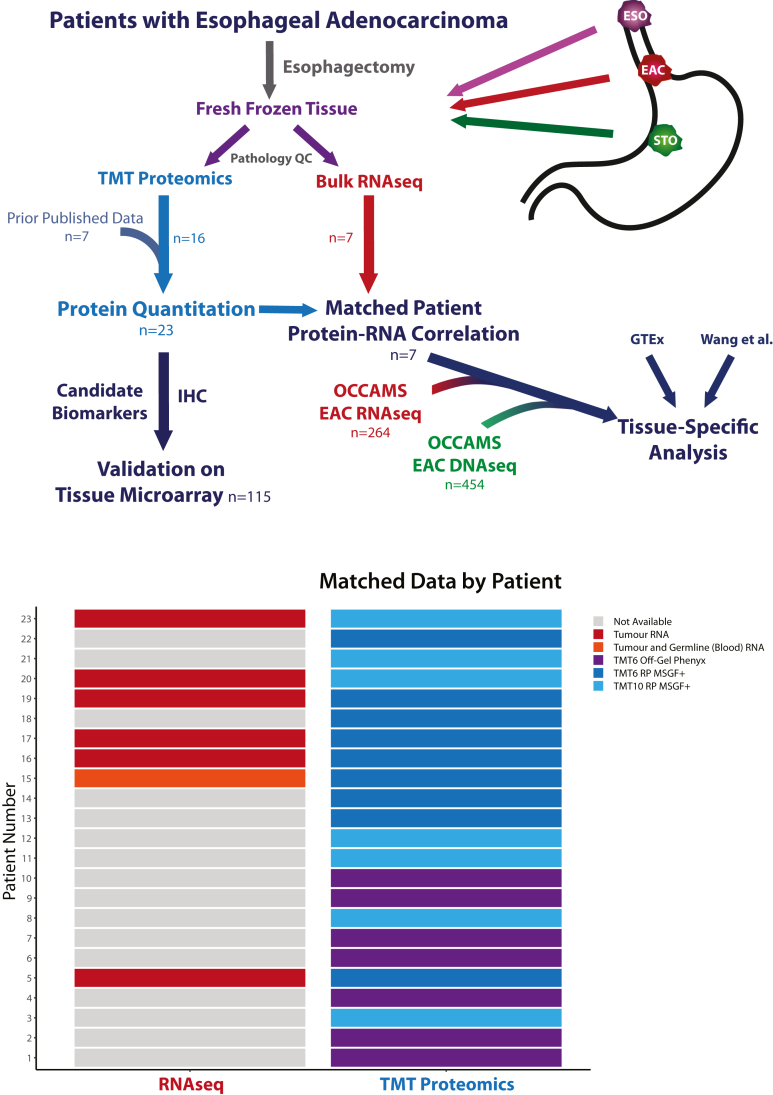
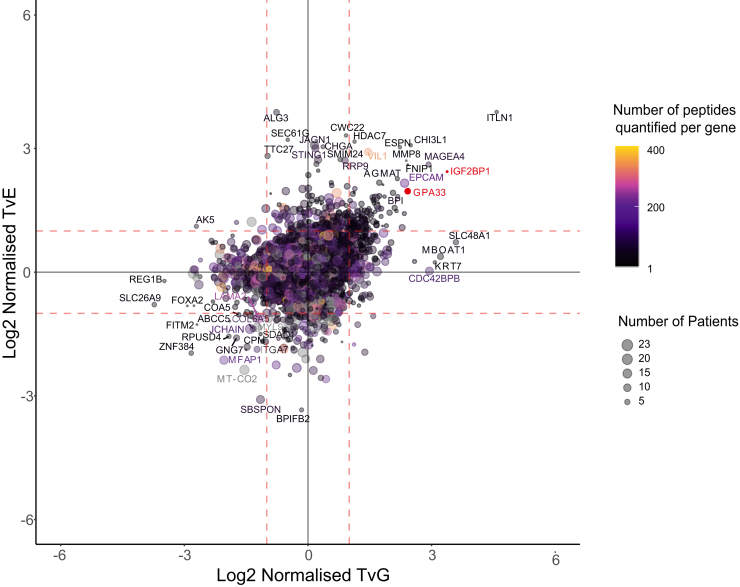
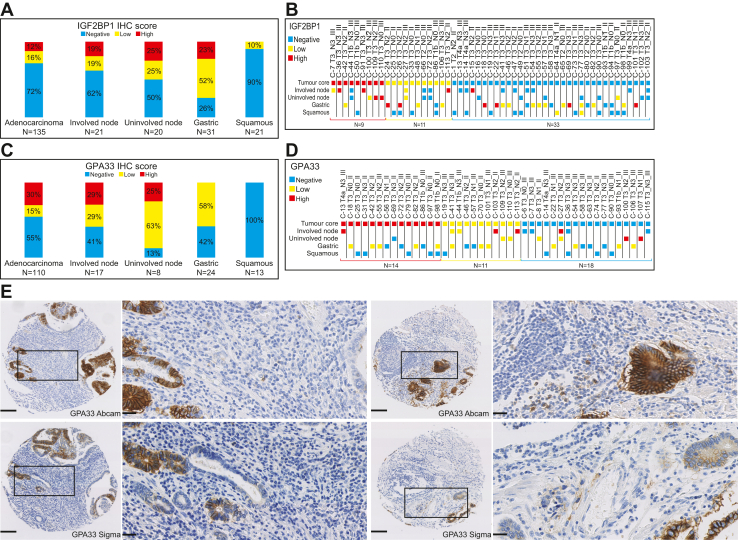
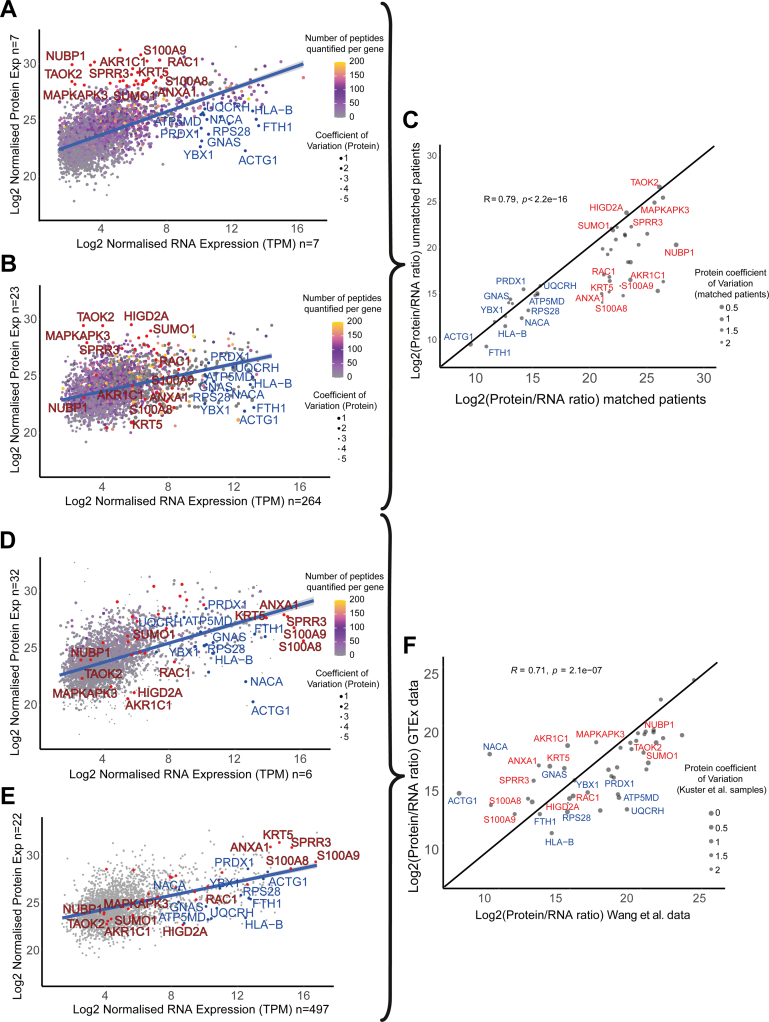
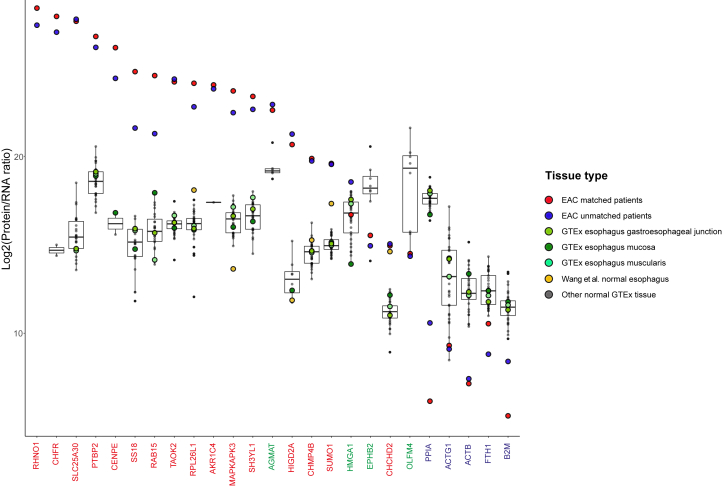
Efforts to address the poor prognosis associated with esophageal adenocarcinoma (EAC) have been hampered by a lack of biomarkers to identify early disease and therapeutic targets. Despite extensive efforts to understand the somatic mutations associated with EAC over the past decade, a gap remains in understanding how the atlas of genomic aberrations in this cancer impacts the proteome and which somatic variants are of importance for the disease phenotype. We performed a quantitative proteomic analysis of 23 EACs and matched adjacent normal esophageal and gastric tissues. We explored the correlation of transcript and protein abundance using tissue-matched RNA-seq and proteomic data from seven patients and further integrated these data with a cohort of EAC RNA-seq data (n = 264 patients), EAC whole-genome sequencing (n = 454 patients), and external published datasets. We quantified protein expression from 5879 genes in EAC and patient-matched normal tissues. Several biomarker candidates with EAC-selective expression were identified, including the transmembrane protein GPA33. We further verified the EAC-enriched expression of GPA33 in an external cohort of 115 patients and confirm this as an attractive diagnostic and therapeutic target. To further extend the insights gained from our proteomic data, an integrated analysis of protein and RNA expression in EAC and normal tissues revealed several genes with poorly correlated protein and RNA abundance, suggesting posttranscriptional regulation of protein expression. These outlier genes, including SLC25A30, TAOK2, and AGMAT, only rarely demonstrated somatic mutation, suggesting post-transcriptional drivers for this EAC-specific phenotype. AGMAT was demonstrated to be overexpressed at the protein level in EAC compared to adjacent normal tissues with an EAC-selective, post-transcriptional mechanism of regulation of protein abundance proposed. Integrated analysis of proteome, transcriptome, and genome in EAC has revealed several genes with tumor-selective, posttranscriptional regulation of protein expression, which may be an exploitable vulnerability.

Keywords: biomarker; esophageal adenocarcinoma; multiomics; proteogenomics; proteomics.


Conflict of interest statement

Conflict of interest The authors declare that they have no competing interests.

Figures

None
Graphical abstract
Fig. 1
Fig. 1
Flow diagram of the proteomic and transcriptomic analysis performed. Global workflow of the proteomic analysis performed using EAC and matched adjacent normal esophagus and normal stomach samples. EAC, esophageal adenocarcinoma.
Fig. 2
Fig. 2
The landscape of protein abundancein EAC relative to patient-matched normal esophageal and normal gastric tissue in 23 patients. Relative expression of 5879 genes across EAC, normal squamous esophagus, and normal stomach in more than one patient. The size of each point indicates the number of patients in which the protein has been quantified, and the color represents the number of peptides quantified per protein. All values correspond to a weighted mean derived across patients with a geometric mean of the ratio of peptide reporter ion intensities across all unique peptides mapping to a gene calculated for each patient. Symbols represent ENSG identifiers.
Fig. 3
Fig. 3
Expression of IGF2BP1 and GPA33 across a tissue microarray containing patient-matched primary esophageal adenocarcinoma, involved (metastatic) lymph nodes, uninvolved lymph nodes, normal gastric, and normal squamous esophageal squamous.A, immunohistochemistry (IHC) scores for IGF2BP1 protein abundances according to tissue type. B, scoring according to patient-matched tissue samples, including tumor cores and/or involved and uninvolved lymph nodes along with normal gastric and normal esophageal squamous tissues (total n = 53). C, IHC scores for GPA33 protein abundances according to tissue type. D, scoring according to patient-matched tissue samples, including tumor cores and/or involved and uninvolved lymph nodes along with normal gastric and normal esophageal squamous tissues (total n = 43). E, representative GPA33 IHC images showing similar staining patterns of two different anti-GPA33 antibodies. IHC staining was evaluated according to 3,3′-diaminobenzidine (DAB) intensity. In (B) and (D), each core is identified by a core number, followed by pathological T-stage, N-stage, and tumor grade. GPA33, glycoprotein A33; IGF2BP1, insulin-like growth factor–binding protein 1.
Fig. 4
Fig. 4
Direct correlation of protein and RNA expression in EAC and normal squamous esophagus.A, patient-matched expression of RNA and protein in EAC (n = 7 patients). Protein abundance represents the weighted mean across patients with a geometric mean of the tumor reporter ion abundance calculated for each unique peptide mapping to a gene. RNA abundance has been calculated as the geometric mean across patients of the normalized transcript per million (TPM) values for each unique ENSG. B, correlation of RNA and protein abundances in unmatched EAC samples (n = 23 proteomic data, n = 264 transcriptomic data). Abundances have been calculated as in (A). C, correlation of outlier protein to RNA ratios in matched and unmatched EAC cohorts. D, correlation of RNA and protein abundances in the normal squamous esophagus using Wang et al. data. Outliers from (A) are highlighted. E, correlation of RNA and protein abundances in the normal squamous esophagus using GTEx consortium data. Outliers from (A) are highlighted. F, correlation of outlier protein-to-RNA ratios in Wang et al. and GTEx datasets. EAC, esophageal adenocarcinoma; GTEx , genotype-tissue expression.
Fig. 5
Fig. 5
Distribution of protein-to-RNA ratios for outlier genes across normal tissues and EAC. The genes included in this figure are the outliers in Figure 4A. Each colored point summarizes an esophageal tissue type. Normal tissues from other anatomical regions have been summarized as a boxplot with median, box limits as 25th and 75th centile, and tails representing maximum and minimum values as well as outliers. Dysregulated genes with high protein abundances and low RNA expression were colored in red in the x-axis, as well as genes associated with intestinal differentiation or Barrett’s esophagus (green) and genes with low protein abundances and high RNA expression (blue). EAC, esophageal adenocarcinoma.
Supplemental Figure S4

Similar articles

Cited by

References

    1. Bray F., Ferlay J., Soerjomataram I., Siegel R.L., Torre L.A., Jemal A. Global cancer statistics 2018: GLOBOCAN estimates of incidence and mortality worldwide for 36 cancers in 185 countries. CA. Cancer J. Clin. 2018;68:394–424. - PubMed
    1. Then E.O., Lopez M., Saleem S., Gayam V., Sunkara T., Culliford A., et al. Esophageal cancer: an updated surveillance epidemiology and end results database analysis. World J. Oncol. 2020;11:55–64. - PMC - PubMed
    1. Edgren G., Adami H.-O., Weiderpass E., Nyrén O., Nyrén O. A global assessment of the oesophageal adenocarcinoma epidemic. Gut. 2013;62:1406–1414. - PubMed
    1. Killcoyne S., Fitzgerald R.C. Evolution and progression of Barrett’s oesophagus to oesophageal cancer. Nat. Rev. Cancer. 2021;21:731–741. - PubMed
    1. Rahman S.A., Walker R.C., Maynard N., Trudgill N., Crosby T., Cromwell D.A., et al. The AUGIS survival predictor: prediction of long-term and conditional survival after esophagectomy using random survival forests. Ann. Surg. 2021;277:267–274. - PMC - PubMed

Supplementary concepts

LinkOut - more resources