. 2024 Jun:84:101934.
doi: 10.1016/j.molmet.2024.101934. Epub 2024 Apr 9.

Hepatic ketone body regulation of renal gluconeogenesis

Affiliations

Hepatic ketone body regulation of renal gluconeogenesis

Ryo Hatano et al. Mol Metab. 2024 Jun.

Abstract

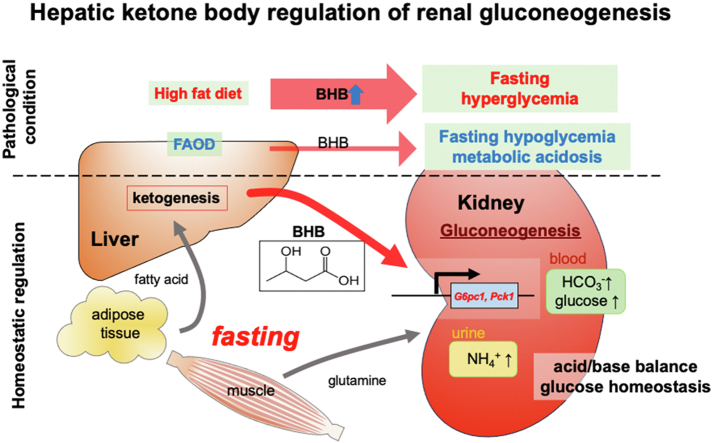
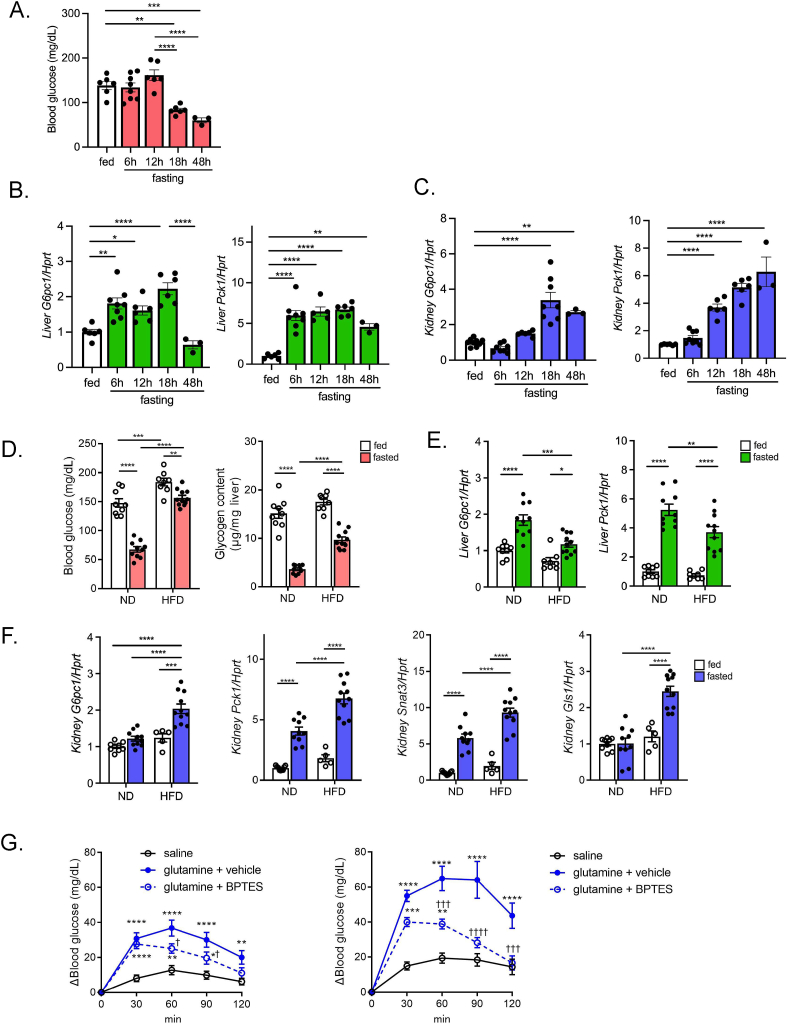
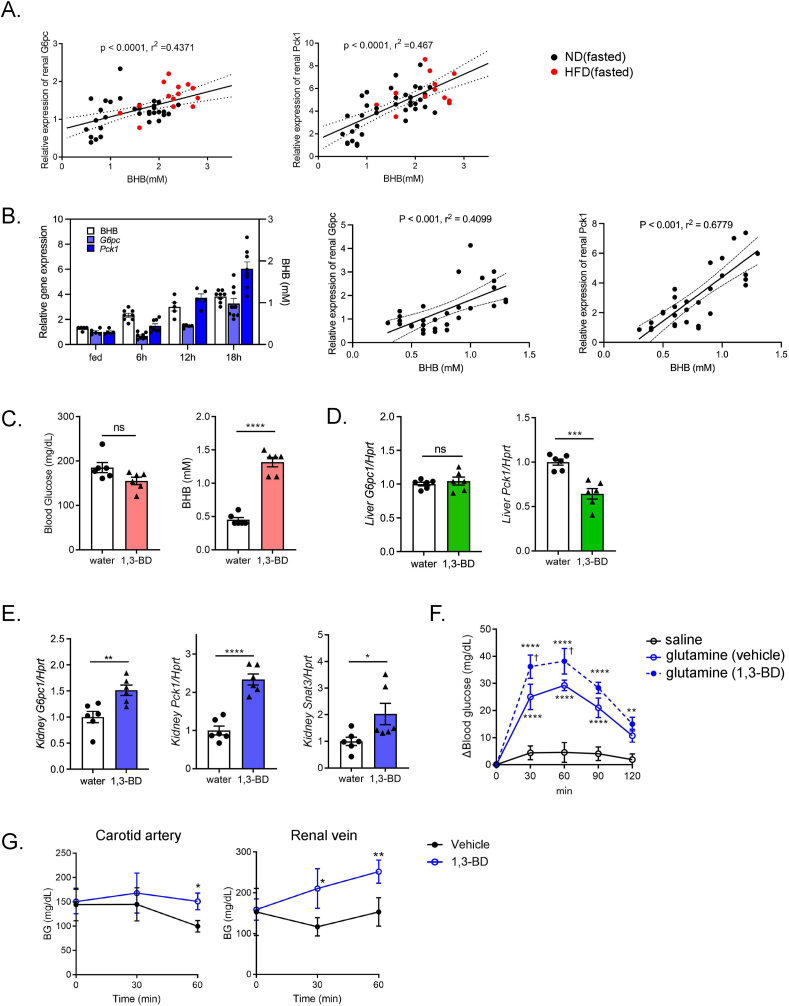
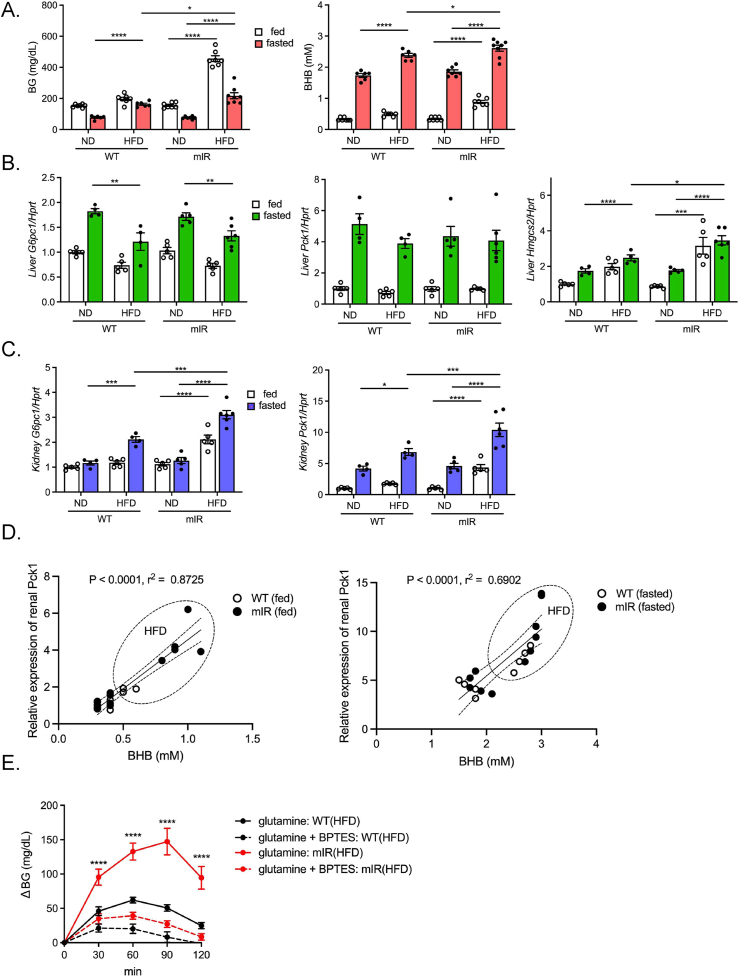
Objectives: During fasting, liver pivotally regulates blood glucose levels through glycogenolysis and gluconeogenesis. Kidney also produces glucose through gluconeogenesis. Gluconeogenic genes are transactivated by fasting, but their expression patterns are chronologically different between the two organs. We find that renal gluconeogenic gene expressions are positively correlated with the blood β-hydroxybutyrate concentration. Thus, we herein aim to investigate the regulatory mechanism and its physiological implications.

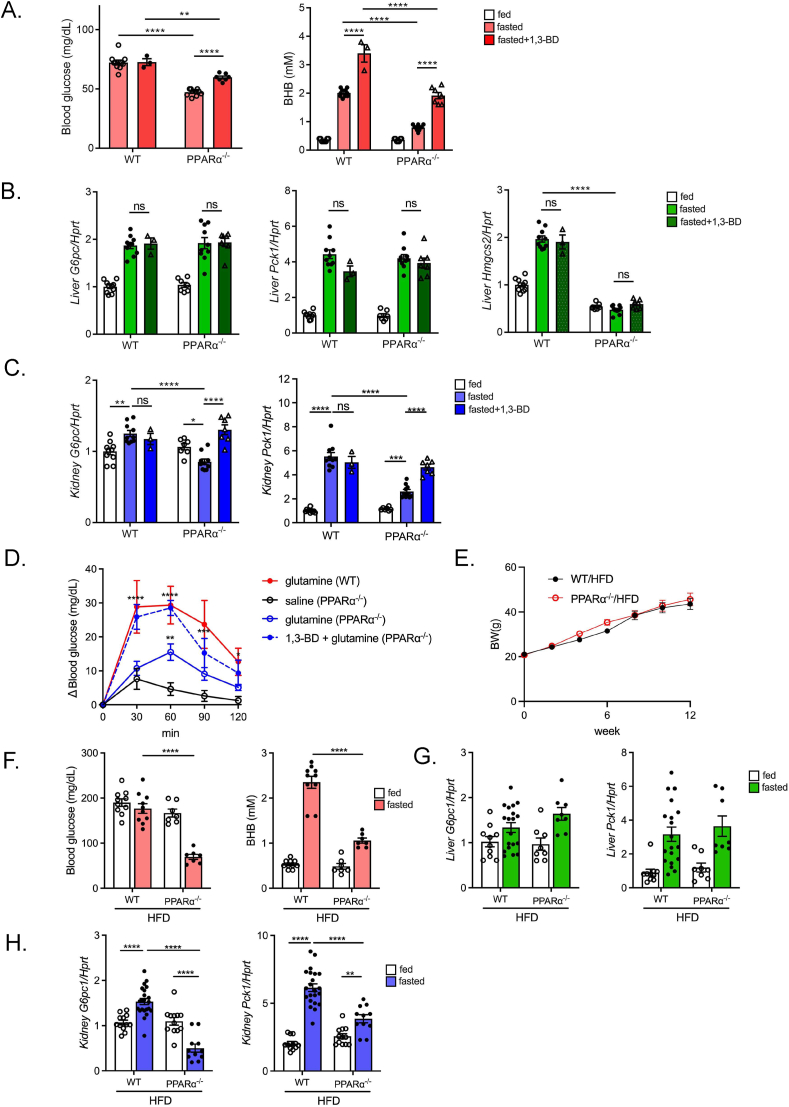
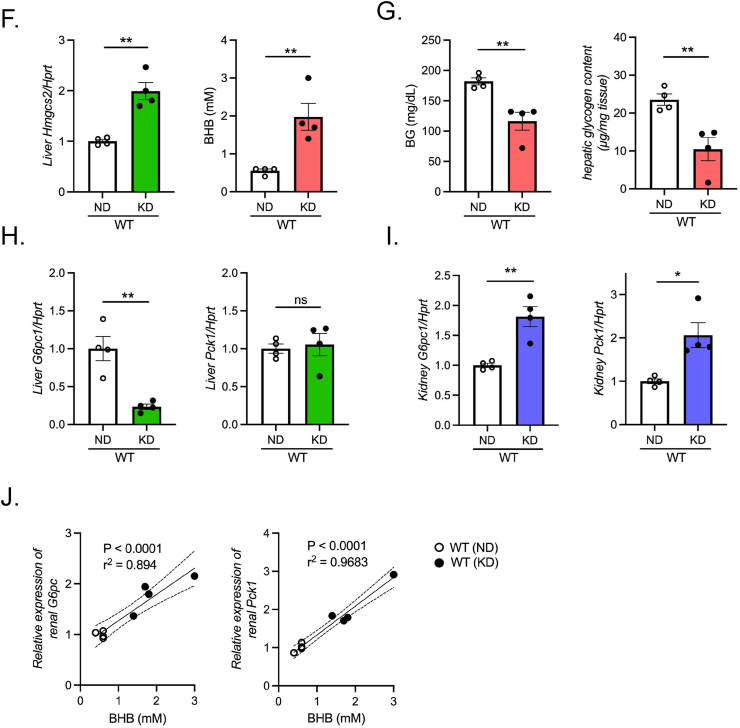
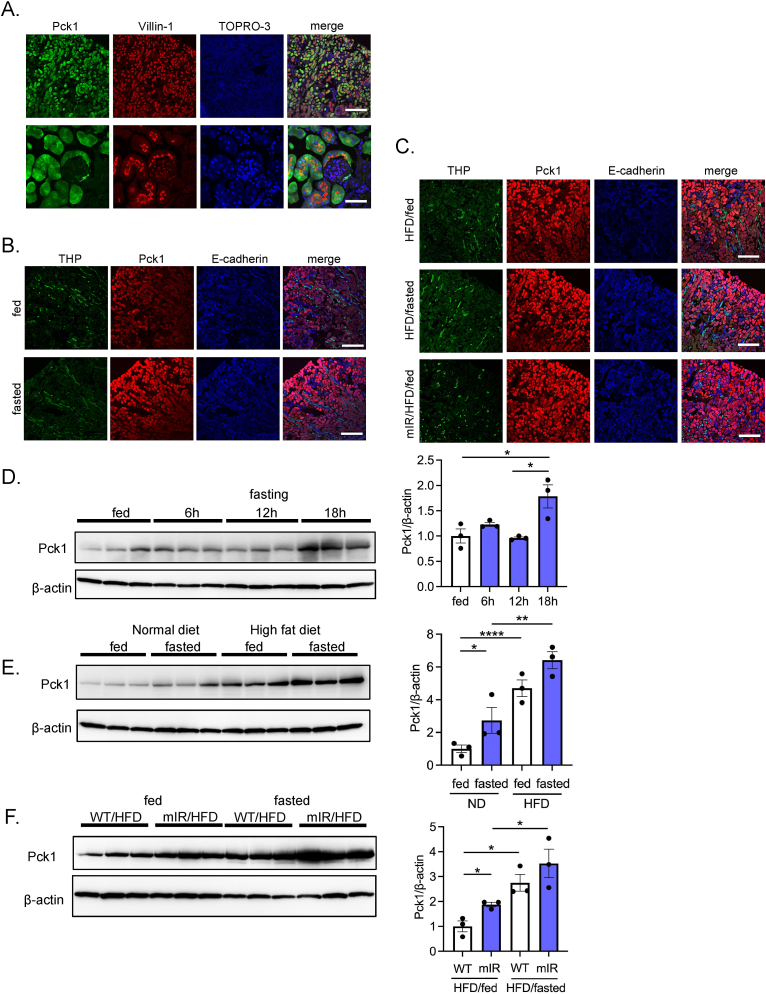
Methods: Gluconeogenic gene expressions in liver and kidney were examined in hyperketogenic mice such as high-fat diet (HFD)-fed and ketogenic diet-fed mice, and in hypoketogenic PPARα knockout (PPARα-/-) mice. Renal gluconeogenesis was evaluated by rise in glycemia after glutamine loading in vivo. Functional roles of β-hydroxybutyrate in the regulation of renal gluconeogenesis were investigated by metabolome analysis and RNA-seq analysis of proximal tubule cells.

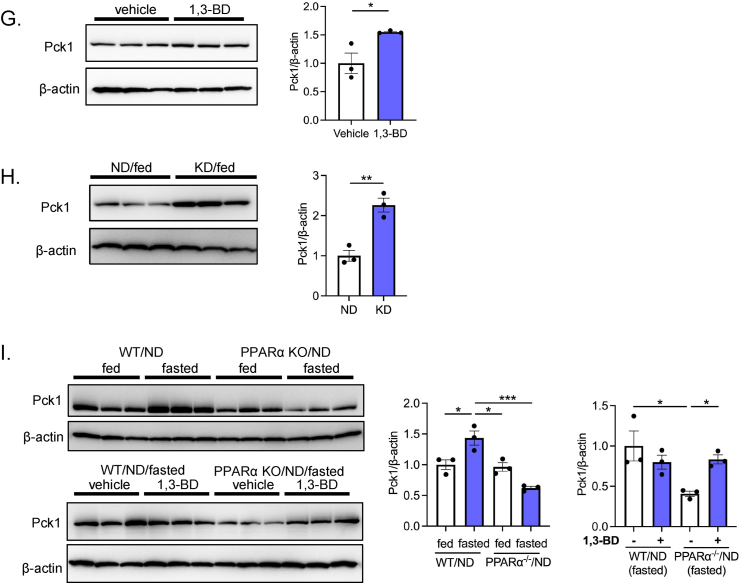
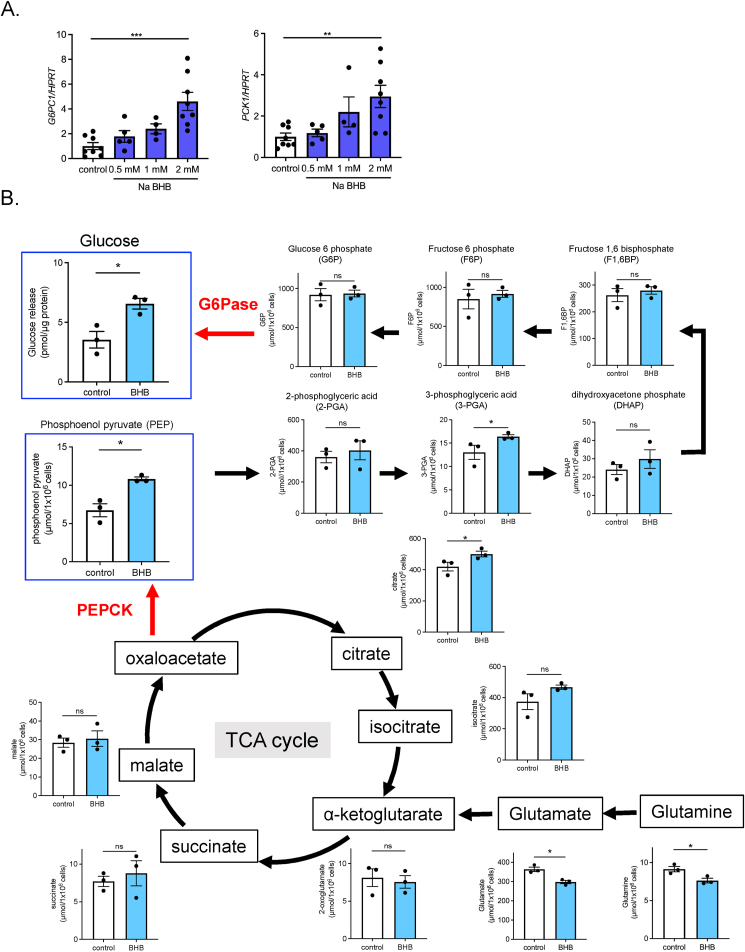
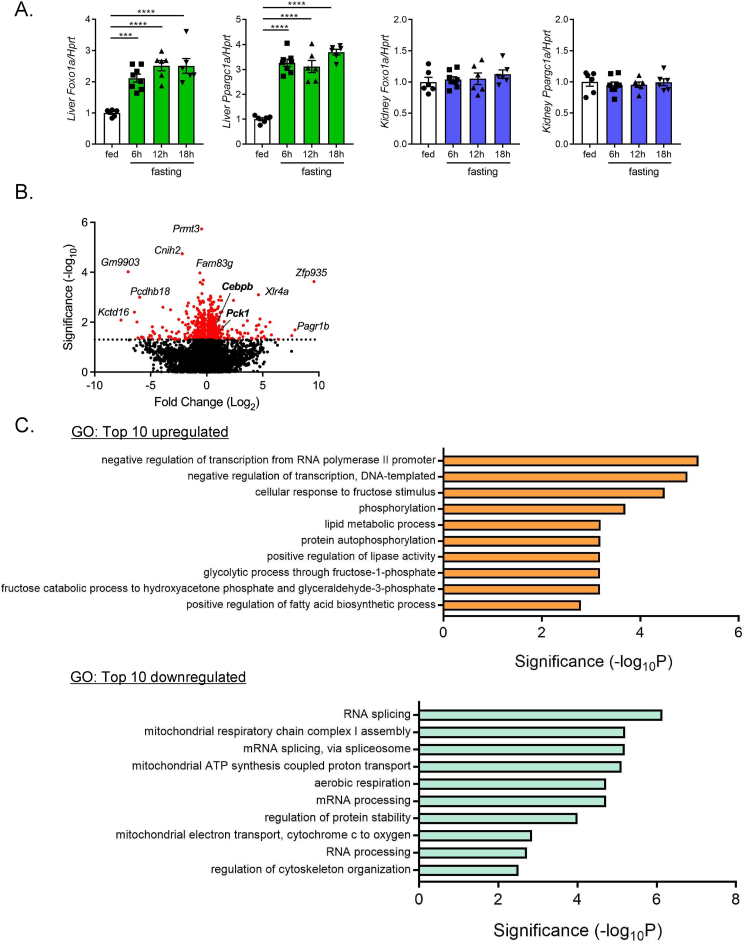
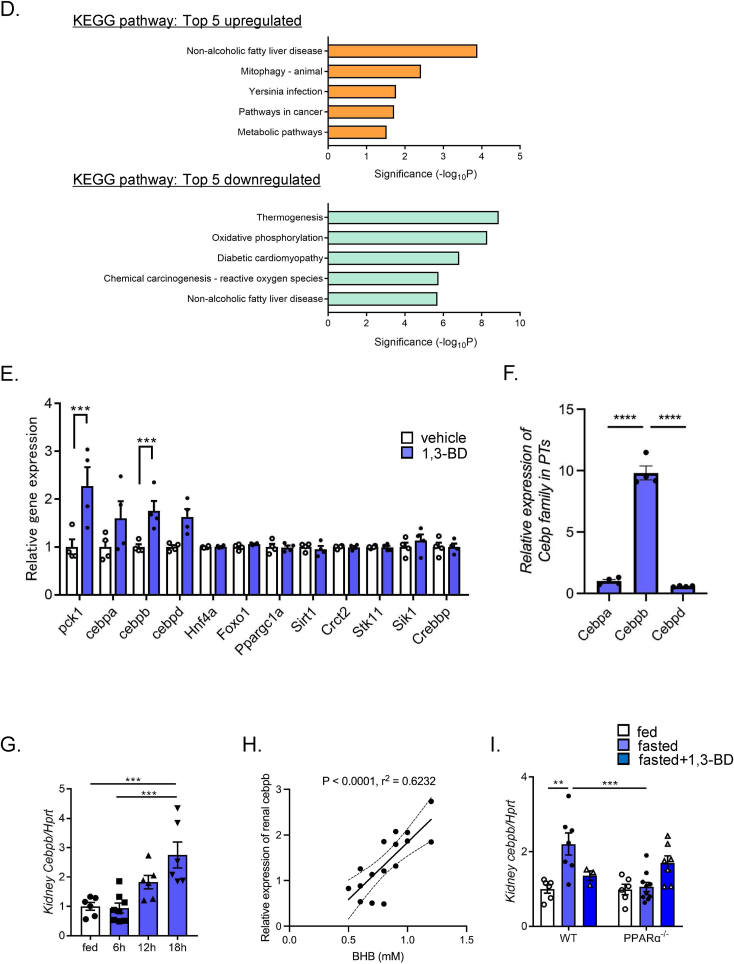
Results: Renal gluconeogenic genes were transactivated concurrently with blood β-hydroxybutyrate uprise under ketogenic states, but the increase was blunted in hypoketogenic PPARα-/- mice. Administration of 1,3-butandiol, a ketone diester, transactivated renal gluconeogenic gene expression in fasted PPARα-/- mice. In addition, HFD-fed mice showed fasting hyperglycemia along with upregulated renal gluconeogenic gene expression, which was blunted in HFD-fed PPARα-/- mice. In vitro experiments and metabolome analysis in renal tubular cells showed that β-hydroxybutyrate directly promotes glucose and NH3 production through transactivating gluconeogenic genes. In addition, RNA-seq analysis revealed that β-hydroxybutyrate-induced transactivation of Pck1 was mediated by C/EBPβ.

Conclusions: Our findings demonstrate that β-hydroxybutyrate mediates hepato-renal interaction to maintain homeostatic regulation of blood glucose and systemic acid-base balance through renal gluconeogenesis regulation.

Keywords: Acid-base homeostasis; Glucose metabolism; Ketone bodies; Renal gluconeogenesis.


Conflict of interest statement

Declaration of competing interest The authors declare that they have no known competing financial interests or personal relationships that could have appeared to influence the work reported in this paper.

Figures

Image 1
Graphical abstract
Figure 1
Figure 1
Gluconeogenic transactivation in liver and kidney after fasting in ND- and HFD-fed mice. A) Blood glucose in mice in a course of fasting (0, 6, 12, 18, and 48 h). B, C) qPCR analysis of gluconeogenic gene expressions (G6pc1 and Pck1) in liver (B), and kidney (C) in a course of fasting (0, 6, 12, 18, and 48 h) (n = 3 to 8). D) Blood glucose and hepatic glycogen content in ND- and HFD-fed mice in fed and 16-hr fasting state. E, F) qPCR analysis of gluconeogenic gene expression in liver (G6pc1 and Pck1) and kidney (G6pc1, Pck1, Snat3, and Gls1) in ND- and HFD-fed mice (n = 8 to 11). G) Glutamine tolerance test in ND-fed (left) and HFD-fed mice (right). After 16-hr fasting, mice were injected with saline or glutamine. BPTES was orally pre-administered 1 h before glutamine injection. (n = 8, each), G), the asterisk (∗) and the dagger (†) denote a statistically significant difference v.s. saline, and v.s. glutamine + vehicle, respectively. Data are expressed as mean ± SEM. ∗p < 0.05, ∗∗p < 0.01, ∗∗∗p < 0.001, ∗∗∗∗p < 0.0001.
Figure 2
Figure 2
Ketone body-induced transactivation of renal gluconeogenic gene and glucose release from kidney. A) Correlation between blood BHB and renal gluconeogenic gene (G6pc1, and Pck1) expression in fasted ND- and HFD-fed mice. B) Comparison of blood BHB concentration and renal gluconeogenic gene expression at different time points of fasting (0, 6, 12, and 18 h) (n = 5 to 8). Correlations (left: BHB vs. renal G6pc1, right: BHB vs. renal Pck1) are shown by scattered plots. C) BG and BHB concentration in mice treated with vehicle (water) or 1,3-BD (n = 6, each). d, e) qPCR analysis of gluconeogenic gene expressions in (D) liver and (E) kidney (G6pc1 and Pck1) in vehicle- or 1,3-BD-treated mice. F) Glutamine tolerance test in vehicle- or 1,3-BD-treated mice (n = 6, each). G) Changes in systemic (left: carotid artery) and renal venous BG concentrations (right) after vehicle or 1,3-BD treatment (n = 3 to 5), F), the asterisk (∗) and the dagger (†) denote a significant difference v.s. saline, and v.s. glutamine (vehicle), respectively. Data are expressed as mean ± SEM. ∗p < 0.05, ∗∗p < 0.01, ∗∗∗p < 0.001, ∗∗∗∗p < 0.0001.
Figure 3
Figure 3
Downregulation of renal gluconeogenic gene expression and its recovery by 1,3-BD administration in PPARα knockout mice. A) Blood glucose and BHB concentration in ND-fed WT mice and PPARα−/− mice (fed and 16-hr fasting with/without 1,3-BD treatment) (n = 3 to 10). B, C) qPCR analysis of gluconeogenic (G6pc1 and Pck1) and ketogenic (Hmgcs2) gene expression in the liver (B) and kidney (G6pc1, Pck1, and Snat3) (C) in ND-fed WT mice and PPARα−/− mice (fed, and 16-hr fasting with/without 1,3-BD treatment). D) Glutamine tolerance test in 16-hr fasted WT and PPARα−/− mice pretreated with saline or 1,3-BD (n = 4 to 8). E) Alterations in body weight during HFD feeding in WT (WT/HFD) and PPARα−/− (PPARα−/−/HFD) mice (n = 5 to 6). F) Blood glucose and BHB concentration in WT/HFD mice and PPARα−/−/HFD mice (fed and 16-hr fasting) (n = 7 to 10). G, H) qPCR analysis of gluconeogenic (G6pc1 and Pck1) gene expression in liver (G) and kidney (G6pc1, Pck1, and Snat3) (H) in WT/HFD mice and PPARα−/−/HFD mice (fed and 16-hr fasting) (n = 8 to 18). Data are expressed as mean ± SEM. ∗∗p < 0.01, ∗∗∗∗p < 0.0001.
Figure 4
Figure 4
Enhanced ketogenesis elicits renal gluconeogenic gene transactivation in insulin receptor mutant (mIR) mice and ketogenic diet-fed mice. A) BG and BHB concentration in ND- and HFD-fed WT and mIR mice (n = 6–8). B) qPCR analysis of gluconeogenic (G6pc1 and Pck1) and ketogenic (Hmgcs2) gene expression in liver (B) and kidney (G6pc1, Pck1, and Snat3) (C) in ND- and HFD-fed WT mice and mIR mice (n = 4–6). (D) Correlation between blood BHB and renal Pck1 expression in WT and mIR mice (left; fed state, right; fasted state). E) Glutamine tolerance test in 16-hr fasted HFD-fed WT and mIR mice (n = 10, each). BPTES was orally pre-administered 1 h before glutamine injection. F) qPCR analysis of hepatic Hmgcs2 and blood BHB concentration in ND- and KD-fed mice (n = 4, each). G) Blood glucose level and hepatic glycogen content in ND- and KD-fed mice. H, I) qPCR analysis of gluconeogenic gene (G6pc1 and Pck1) expression in liver (H) and kidney (G6pc1 and Pck1) (I) in ND- and KD-fed mice. J) Correlation of blood BHB and renal G6pc1 or Pck1 expression in ND- and KD-fed mice. Data are expressed as mean ± SEM. ∗p < 0.05, ∗∗p < 0.01, ∗∗∗p < 0.001, ∗∗∗∗p < 0.0001.
Figure 4
Figure 4
Enhanced ketogenesis elicits renal gluconeogenic gene transactivation in insulin receptor mutant (mIR) mice and ketogenic diet-fed mice. A) BG and BHB concentration in ND- and HFD-fed WT and mIR mice (n = 6–8). B) qPCR analysis of gluconeogenic (G6pc1 and Pck1) and ketogenic (Hmgcs2) gene expression in liver (B) and kidney (G6pc1, Pck1, and Snat3) (C) in ND- and HFD-fed WT mice and mIR mice (n = 4–6). (D) Correlation between blood BHB and renal Pck1 expression in WT and mIR mice (left; fed state, right; fasted state). E) Glutamine tolerance test in 16-hr fasted HFD-fed WT and mIR mice (n = 10, each). BPTES was orally pre-administered 1 h before glutamine injection. F) qPCR analysis of hepatic Hmgcs2 and blood BHB concentration in ND- and KD-fed mice (n = 4, each). G) Blood glucose level and hepatic glycogen content in ND- and KD-fed mice. H, I) qPCR analysis of gluconeogenic gene (G6pc1 and Pck1) expression in liver (H) and kidney (G6pc1 and Pck1) (I) in ND- and KD-fed mice. J) Correlation of blood BHB and renal G6pc1 or Pck1 expression in ND- and KD-fed mice. Data are expressed as mean ± SEM. ∗p < 0.05, ∗∗p < 0.01, ∗∗∗p < 0.001, ∗∗∗∗p < 0.0001.
Figure 5
Figure 5
Renal localization and protein expression levels of PCK1 in various animal models. A) Determination of renal PCK1 distribution by immunostaining. Renal sections were coimmunostained with PCK1 and villin-1, a marker for PTs. (upper: low magnification, lower: high magnification). B) Upregulation of PCK1 intensity in 16-hr fasted mouse renal PTs. Coimmunostaining of PCK1 with THP, a marker for thick ascending limb of Henle, and E-cadherin, a marker for distal tubules and collecting duct. C) Upregulation of PCK1 intensity in renal PTs of HFD-fed mice (fed and fasted) and mIR (fed) mice. D) Western blot analysis of the PCK1 protein expression level in renal cortex during fasting. E-I) PCK1 protein expressions were investigated (E) in ND- and HFD-fed mouse renal cortex (fed and 16-hr fasted), (F) in HFD-fed WT and mIR mouse renal cortex (fed and 16-hr fasted), (G) in vehicle or 1,3-BD-treated mouse renal cortex, (H) in ND- and KD-fed mouse renal cortex, and (I) ND-fed WT and PPARα−/− mouse renal cortex (upper: fed and 16-hr fasted, lower: vehicle and 1,3-BD treatment in 16-hr fasted WT and PPARα−/− mice). Relative PCK1 protein levels are normalized to the total amount of β-actin. Data are expressed as mean ± SEM. ∗p < 0.05, ∗∗p < 0.01, ∗∗∗p < 0.001, ∗∗∗∗p < 0.0001.
Figure 5
Figure 5
Renal localization and protein expression levels of PCK1 in various animal models. A) Determination of renal PCK1 distribution by immunostaining. Renal sections were coimmunostained with PCK1 and villin-1, a marker for PTs. (upper: low magnification, lower: high magnification). B) Upregulation of PCK1 intensity in 16-hr fasted mouse renal PTs. Coimmunostaining of PCK1 with THP, a marker for thick ascending limb of Henle, and E-cadherin, a marker for distal tubules and collecting duct. C) Upregulation of PCK1 intensity in renal PTs of HFD-fed mice (fed and fasted) and mIR (fed) mice. D) Western blot analysis of the PCK1 protein expression level in renal cortex during fasting. E-I) PCK1 protein expressions were investigated (E) in ND- and HFD-fed mouse renal cortex (fed and 16-hr fasted), (F) in HFD-fed WT and mIR mouse renal cortex (fed and 16-hr fasted), (G) in vehicle or 1,3-BD-treated mouse renal cortex, (H) in ND- and KD-fed mouse renal cortex, and (I) ND-fed WT and PPARα−/− mouse renal cortex (upper: fed and 16-hr fasted, lower: vehicle and 1,3-BD treatment in 16-hr fasted WT and PPARα−/− mice). Relative PCK1 protein levels are normalized to the total amount of β-actin. Data are expressed as mean ± SEM. ∗p < 0.05, ∗∗p < 0.01, ∗∗∗p < 0.001, ∗∗∗∗p < 0.0001.
Figure 6
Figure 6
Metabolomic analysis of gluconeogenesis in HK-2 cells. A) Dose-dependent effects of Na BHB (2 mM) on gluconeogenic gene expression (G6PC1 and PCK1) in HK-2 cells (n = 4 to 8). B) Metabolomic analysis of gluconeogenic and citric acid cycle intermediates in HK-2 cells after Na BHB (2 mM) or vehicle treatment (n = 3, each). Glucose release into medium was measured separately. Data are expressed as mean ± SEM. ∗p < 0.05, ∗∗p < 0.01, ∗∗∗p < 0.001.
Figure 7
Figure 7
RNA-seq analysis of isolated PTs from 1,3-BD and vehicle treated mice. A) qPCR analysis of hepatic and renal Foxo1a and Ppargc1a expressions in a course of fasting. RNA-seq analysis was performed using isolated PTs from 1,3-BD or vehicle-treated mice (n = 6 to 8). (B) Volcano plot, the results of (C) gene ontology (GO) analysis, and (D) pathway analysis are shown. E) Comparison of expression levels of gluconeogenesis-related genes in isolated PTs in 1,3-BD or vehicle-treated mice (n = 4, each). F) Comparison of the relative transcript amount of Cebp family in PTs. Data are based on RNA-seq analysis. G) qPCR analysis of renal cebpb expression in a course of fasting (n = 6 to 8), and (H) its correlation with blood BHB. I) qPCR analysis of renal cebpb expression in ND-fed WT and PPARα−/− mice (fed, 16-hr fasted and 1,3-BD treated after 16-hr fasting) (n = 3 to 10). Data are expressed as mean ± SEM. ∗∗p < 0.01, ∗∗∗p < 0.001, ∗∗∗∗p < 0.0001.
Figure 7
Figure 7
RNA-seq analysis of isolated PTs from 1,3-BD and vehicle treated mice. A) qPCR analysis of hepatic and renal Foxo1a and Ppargc1a expressions in a course of fasting. RNA-seq analysis was performed using isolated PTs from 1,3-BD or vehicle-treated mice (n = 6 to 8). (B) Volcano plot, the results of (C) gene ontology (GO) analysis, and (D) pathway analysis are shown. E) Comparison of expression levels of gluconeogenesis-related genes in isolated PTs in 1,3-BD or vehicle-treated mice (n = 4, each). F) Comparison of the relative transcript amount of Cebp family in PTs. Data are based on RNA-seq analysis. G) qPCR analysis of renal cebpb expression in a course of fasting (n = 6 to 8), and (H) its correlation with blood BHB. I) qPCR analysis of renal cebpb expression in ND-fed WT and PPARα−/− mice (fed, 16-hr fasted and 1,3-BD treated after 16-hr fasting) (n = 3 to 10). Data are expressed as mean ± SEM. ∗∗p < 0.01, ∗∗∗p < 0.001, ∗∗∗∗p < 0.0001.
Figure 8
Figure 8
Role of C/EBPβ in regulation of renal gluconeogenesis by BHB. A) Effect of CEBPB siRNA transfection on BHB-mediated gluconeogenic gene expression (G6PC1, PCK1 and CEBPB) in HK-2 cells. Cells were treated with or without BHB at 72-hr after siRNA transfection (n = 3 to 4). B) Effect of single treatment of inhibitors (pimozide, a SCOT inhibitor, and withaferin A (a C/EBPβ inhibitor) on gluconeogenic genes (Pck1 and G6pc1) and Cebpb in isolated PTs (n = 4 to 6). C) Inhibitory effects of withaferin A on BHB-mediated gluconeogenic gene (G6pc1 and Pck1) expression. D) Glucose and NH3 release from isolated PTs from fed- and 16hr fasted-mice. E) Glucose and NH3 release from isolated PTs after vehicle or BHB treatment (n = 4 to 6). Data are expressed as mean ± SEM. ∗p < 0.05, ∗∗p < 0.01, ∗∗∗∗p < 0.0001.

References

    1. Zhang X., Yang S., Chen J., Su Z. Unraveling the regulation of hepatic gluconeogenesis. Front Endocrinol. 2019;9:802. - PMC - PubMed
    1. Legouis D., Faivre A., Cippà P.E., de Seigneux S. Renal gluconeogenesis: an underestimated role of the kidney in systemic glucose metabolism. Nephrol Dial Transplant. 2022;37(8):1417–1425. - PubMed
    1. Gerich J.E., Meyer C., Woerle H.J., Stumvoll M. Renal gluconeogenesis: its importance in human glucose homeostasis. Diabetes Care. 2001;24(2):382–391. - PubMed
    1. Ekberg K., Landau B.R., Wajngot A., Chandramouli V., Efendic S., Brunengraber H., et al. Contributions by kidney and liver to glucose production in the postabsorptive state and after 60 h of fasting. Diabetes. 1999;48(2):292–298. - PubMed
    1. Meyer C., Dostou J.M., Welle S.L., Gerich J.E. Role of human liver, kidney, and skeletal muscle in postprandial glucose homeostasis. Am J Physiol Endocrinol Metab. 2002;282(2):E419–E427. - PubMed