. 2024 Jun;14(6):906-921.
doi: 10.1002/2211-5463.13802. Epub 2024 Apr 11.

Conditional deficiency of Rho-associated kinases disrupts endothelial cell junctions and impairs respiratory function in adult mice

Affiliations

Conditional deficiency of Rho-associated kinases disrupts endothelial cell junctions and impairs respiratory function in adult mice

Takahiro Akamine et al. FEBS Open Bio. 2024 Jun.

Abstract

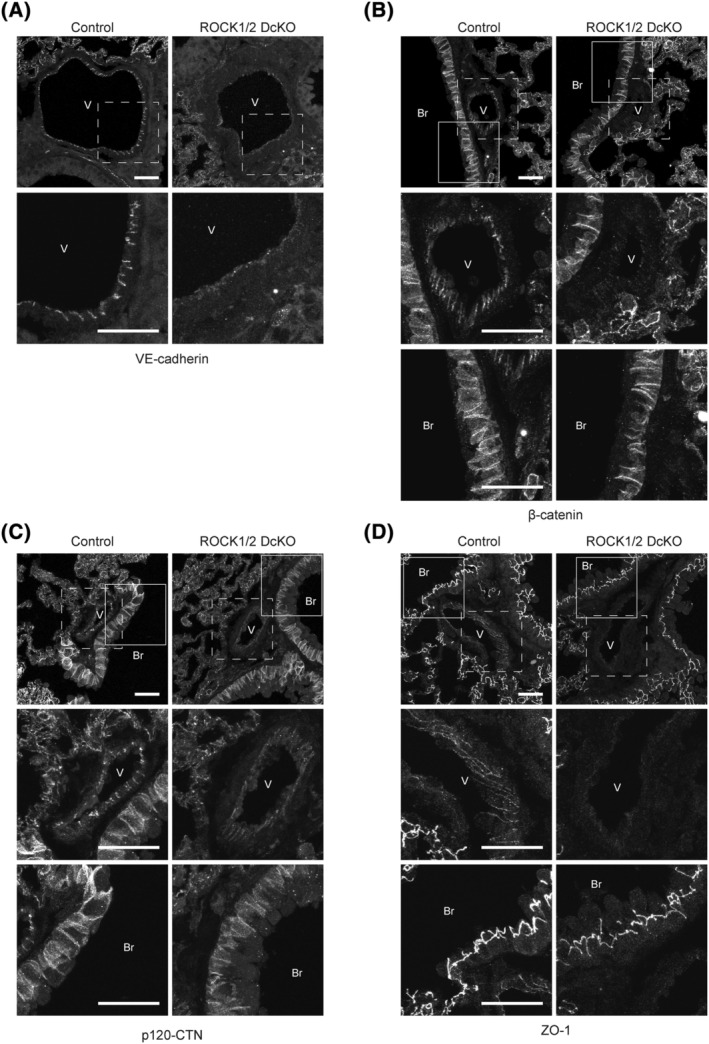
The Ras homology (Rho) family of GTPases serves various functions, including promotion of cell migration, adhesion, and transcription, through activation of effector molecule targets. One such pair of effectors, the Rho-associated coiled-coil kinases (ROCK1 and ROCK2), induce reorganization of actin cytoskeleton and focal adhesion through substrate phosphorylation. Studies on ROCK knockout mice have confirmed that ROCK proteins are essential for embryonic development, but their physiological functions in adult mice remain unknown. In this study, we aimed to examine the roles of ROCK1 and ROCK2 proteins in normal adult mice. Tamoxifen (TAM)-inducible ROCK1 and ROCK2 single and double knockout mice (ROCK1flox/flox and/or ROCK2flox/flox;Ubc-CreERT2) were generated and administered a 5-day course of TAM. No deaths occurred in either of the single knockout strains, whereas all of the ROCK1/ROCK2 double conditional knockout mice (DcKO) had died by Day 11 following the TAM course. DcKO mice exhibited increased lung tissue vascular permeability, thickening of alveolar walls, and a decrease in percutaneous oxygen saturation compared with noninducible ROCK1/ROCK2 double-floxed control mice. On Day 3 post-TAM, there was a decrease in phalloidin staining in the lungs in DcKO mice. On Day 5 post-TAM, immunohistochemical analysis also revealed reduced staining for vascular endothelial (VE)-cadherin, β-catenin, and p120-catenin at cell-cell contact sites in vascular endothelial cells in DcKO mice. Additionally, VE-cadherin/β-catenin complexes were decreased in DcKO mice, indicating that ROCK proteins play a crucial role in maintaining lung function by regulating cell-cell adhesion.

Keywords: ROCK; actin cytoskeleton; cell–cell adhesion; lung function; transgenic mice; vascular permeability.


Conflict of interest statement

The authors declare no conflict of interest.

Figures

Fig. 1
Fig. 1
Generation of Rho‐associated coiled‐coil kinase 1 and Rho‐associated coiled‐coil kinase 2 double conditional knockout (ROCK1/2 DcKO) mice. (A) Protocol for induction of Cre recombinase activity in 8‐week‐old mice administered tamoxifen (TAM; 2 mg day−1, intraperitoneal) once daily for 5 consecutive days. Mice were sacrificed on Days 0, 3, 5, or 7 post‐TAM and organ tissues were harvested for reverse transcription quantitative polymerase chain reaction (RT‐qPCR), western blotting, immunoprecipitation, and histology. (B) RT‐qPCR analysis of Rho‐associated coiled‐coil kinase 1 (ROCK1) and Rho‐associated coiled‐coil kinase 2 (ROCK2) mRNA expression in the lungs of control and ROCK1/2 DcKO mice on Day 5 post‐TAM. Data are shown as the means ± SD of fold changes relative to control mice (n = 3); **P < 0.01 vs. control mice, as determined by Student's t‐test. (C) Western blot analysis of lung lysates from control and ROCK1/2 DcKO mice on Days 5 and 7 post‐TAM using the indicated antibodies. Each group contains protein obtained from three different individuals. (D) Kaplan–Meier survival plots of control and ROCK1/2 DcKO mice post‐TAM. Survival probabilities were calculated using control and ROCK1/2 DcKO mice (n = 13).
Fig. 2
Fig. 2
Pulmonary hemorrhage and impaired respiratory function in Rho‐associated coiled‐coil kinase 1 and Rho‐associated coiled‐coil kinase 2 double conditional knockout (ROCK1/2 DcKO) mice. (A) Representative photographs of lungs from control and ROCK1/2 DcKO mice on Days 5 (top panel) and 7 (bottom panel) following the course of tamoxifen (TAM) treatment. Scale bar: 10 mm. (B) Wet/dry weight ratios of lungs excised from control (n = 3) and ROCK1/2 DcKO (n = 6) mice on Day 5 post‐TAM. Ratios are shown as means ± SD; **P < 0.01 vs. control mice, as determined by Student's t‐test. (C) Relative absorbance of Evans blue dye extracted from lungs of control and ROCK1/2 DcKO mice excised 30 min post‐dye injection on days 5 (n = 4 for control mice and n = 5 for ROCK1/2 DcKO mice; left panel) and 7 (n = 5 for control mice and n = 6 for ROCK1/2 DcKO mice; right panel) post‐TAM and measured at 610 nm. Absorbance values were corrected for each lung weight and shown as means ± SD of fold changes relative to control mice; *P < 0.05, **P < 0.01 vs. control mice, as determined by Student's t‐test. (D) Representative photomicrographs of hematoxylin–eosin stained lung sections in control (left panels) and ROCK1/2 DcKO (middle and right panels) mice on Day 5 post‐TAM. The upper right panel shows a lung section with severe hemorrhages. The lower panels contain enlarged images of the boxed areas in the upper panels. Red blood cells leaking into alveoli (arrows) were observed in ROCK1/2 DcKO mice. Scale bar: 50 μm. Quantification of alveolar wall thickness in hematoxylin–eosin stained lung sections in control and ROCK1/2 DcKO mice on Day 5 post‐TAM. Thicknesses are shown as means ± SD (n = 4); **P < 0.01 vs. control mice, as determined by Student's t‐test. (E) Representative photomicrographs of lungs in control (left) and ROCK1/2 DcKO (right) mice on Day 5 post‐TAM obtained by scanning electron microscopy. Scale bar: 100 μm. (F) Percutaneous oxygen saturation (SpO2) levels in control (n = 3) and ROCK1/2 DcKO (n = 5) mice measured over the course of 7 days post‐TAM. Data are shown as means ± SD; *P < 0.05, **P < 0.01 vs. control mice at the corresponding time points, as determined by Student's t‐test.
Fig. 3
Fig. 3
Migration of neutrophils into alveoli in Rho‐associated coiled‐coil kinase 1 and Rho‐associated coiled‐coil kinase 2 double conditional knockout (ROCK1/2 DcKO) mice. Numbers of total cells, macrophages, and neutrophils in the bronchoalveolar lavage fluid (BALF) of control (n = 8) and ROCK1/2 DcKO (n = 6) mice on Day 5 following the course of tamoxifen (TAM). Cell counts are shown as means ± SD of the total cells counted with a hemocytometer, and the numbers of macrophages or neutrophils calculated from the percentage of 300 cells; **P < 0.01 vs. control mice, as determined by Student's t‐test.
Fig. 4
Fig. 4
Increased levels of interleukin‐6 (IL‐6) and chemokine ligand 2 (CCL2) in the lungs of Rho‐associated coiled‐coil kinase 1 and Rho‐associated coiled‐coil kinase 2 double conditional knockout (ROCK1/2 DcKO) mice. (A) Reverse transcription quantitative polymerase chain reaction (RT‐qPCR) measurement of Il6 and Ccl2 mRNA expression levels in lungs of control (n = 6) and ROCK1/2 DcKO (n = 5) mice on Day 5 following the tamoxifen (TAM) course. Data are shown as the means ± SD of fold changes relative to control mice; *P < 0.05, **P < 0.01 vs. control mice, as determined by Student's t‐test. (B) Enzyme‐linked immuno‐sorbent assay (ELISA) measurements of IL‐6 and CCL2 protein concentrations in bronchoalveolar lavage fluid (BALF) from control (n = 3) and ROCK1/2 DcKO (n = 5) mice on Day 5 post‐TAM. Data are shown as means ± SD; *P < 0.05, **P < 0.01 vs. control mice, as determined by Student's t‐test. (C) Liquid chromatography–tandem mass spectrometry (LC–MS/MS) measurements of histamine content in control and ROCK1/2 DcKO mice on Day 5 post‐TAM. The histamine peak areas were corrected for each internal standard peak area. Data are shown as means ± SD of fold changes relative to control mice (n = 3), and were analyzed by Student's t‐test. (D) RT‐qPCR analysis of mRNA expression of tumor necrosis factor‐α (Tnf‐α; n = 6 for control mice and n = 5 for ROCK1/2 DcKO mice), interleukin‐1β (Il1b; n = 4 for control mice and n = 5 for ROCK1/2 DcKO mice), nitric oxide related genes (Nos2, Nos3; n = 4 per group), and vascular endothelial growth factor (Vegfa; n = 5 per group) in lungs of control and ROCK1/2 DcKO mice on Day 5 post‐TAM. Data are shown as means ± SD of fold changes relative to control mice and were analyzed by Student's t‐test.
Fig. 5
Fig. 5
Phalloidin intensity is reduced in the lungs of Rho‐associated coiled‐coil kinase 1 and Rho‐associated coiled‐coil kinase 2 double conditional knockout (ROCK1/2 DcKO) mice. Representative images of phalloidin staining in the lungs of control mice and ROCK1/2 DcKO mice on Days 0, 3, and 5 following the course of tamoxifen (TAM) treatment. Low (left panels) and high (right panels) magnification images are shown. High magnification images of entire tissue were acquired every 0.7 μm, and the overlay images are shown. Scale bars: 50 μm. Two lines were drawn in each low magnification image. Phalloidin fluorescence intensity in the alveoli was measured at the intersection of the lines. Intensities of 10 or more points per section were averaged and shown at the means ± SD of fold changes relative to controls, with sections from three individuals/group observed (n = 3); *P < 0.05, **P < 0.01 vs. control mice, as determined by Student's t‐test.
Fig. 6
Fig. 6
Decrease in localization of vascular endothelial (VE)‐cadherin, β‐catenin, p120‐catenin (p120‐CTN) and zonula occludens‐1 (ZO‐1) to lung endothelial cells in Rho‐associated coiled‐coil kinase 1 and Rho‐associated coiled‐coil kinase 2 double conditional knockout (ROCK1/2 DcKO) mice. (A) Upper panels: representative images of lung sections from lungs harvested from control and ROCK1/2 DcKO mice on Day 5 following the course of tamoxifen (TAM) treatment and stained with antibodies against VE‐cadherin. The lower panels contain enlarged images of the boxed areas in the upper panels. Images of entire tissue were acquired every 0.7 μm, and the overlay images are shown. Scale bars: 30 μm. (B–D) Upper panels: representative images of lung sections from lungs harvested from control and ROCK1/2 DcKO mice on Day 5 following the course of TAM treatment and stained with antibodies against β‐catenin (B), p120‐CTN (C), and ZO‐1 (D). The middle or lower panels contain enlarged images of the boxed areas (dotted or solid line) in the upper panels, respectively. Images of entire tissue were acquired every 0.7 μm, and the overlay images are shown. Scale bars: 30 μm. In panels A–D, V or Br indicates a pulmonary vessel or bronchus, respectively.
Fig. 7
Fig. 7
Suppression of vascular endothelial (VE)‐cadherin/β‐catenin complex formation caused by loss of Rho‐associated coiled‐coil kinase (ROCK) activity. (A, B) Immunocomplexes and total lung lysates from control and ROCK1/2 double conditional knockout (ROCK1/2 DcKO) mice on Days 5 or 7 following the tamoxifen (TAM) course were analyzed by coimmunoprecipitation (IP) and western blotting with the indicated antibodies. (A) Day 5 lung lysates: co‐IP with anti‐β‐catenin antibody and western blotting with the indicated antibodies. Each group contains protein obtained from two different individuals. (B) Day 7 lung lysates: western blotting with the indicated antibodies. Each group contains protein obtained from three different individuals. (C) eEND2 cells cultured on plastic dishes with or without Matrigel and treated with 15 μm Y‐27632 for 1 h, followed by co‐IP with anti‐β‐catenin antibody or western blotting of immunocomplexes and total eEND2 cell lysates with the indicated antibodies. The intensities of VE‐cadherin bands were corrected for the intensities of the corresponding β‐catenin bands. The ratios are presented as fold changes relative to dimethyl sulfoxide (DMSO) control‐treated cells.

Similar articles

References

    1. Blanchoin L, Boujemaa‐Paterski R, Sykes C and Plastino J (2014) Actin dynamics, architecture, and mechanics in cell motility. Physiol Rev 94, 235–263. - PubMed
    1. Heng YW and Koh CG (2010) Actin cytoskeleton dynamics and the cell division cycle. Int J Biochem Cell Biol 42, 1622–1633. - PubMed
    1. Svitkina T (2018) The actin cytoskeleton and actin‐based motility. Cold Spring Harb Perspect Biol 10, a018267. - PMC - PubMed
    1. Williams TD and Rousseau A (2022) Actin dynamics in protein homeostasis. Biosci Rep 42, BSR20210848. - PMC - PubMed
    1. Li M, Peng L, Wang Z, Liu L, Cao M, Cui J, Wu F and Yang J (2023) Roles of the cytoskeleton in human diseases. Mol Biol Rep 50, 2847–2856. - PubMed