. 2024 Apr 11;15(1):3138.
doi: 10.1038/s41467-024-47253-0.

PRPF8-mediated dysregulation of hBrr2 helicase disrupts human spliceosome kinetics and 5´-splice-site selection causing tissue-specific defects

Affiliations

PRPF8-mediated dysregulation of hBrr2 helicase disrupts human spliceosome kinetics and 5´-splice-site selection causing tissue-specific defects

Robert Atkinson et al. Nat Commun. .

Abstract

The carboxy-terminus of the spliceosomal protein PRPF8, which regulates the RNA helicase Brr2, is a hotspot for mutations causing retinitis pigmentosa-type 13, with unclear role in human splicing and tissue-specificity mechanism. We used patient induced pluripotent stem cells-derived cells, carrying the heterozygous PRPF8 c.6926 A > C (p.H2309P) mutation to demonstrate retinal-specific endophenotypes comprising photoreceptor loss, apical-basal polarity and ciliary defects. Comprehensive molecular, transcriptomic, and proteomic analyses revealed a role of the PRPF8/Brr2 regulation in 5'-splice site (5'SS) selection by spliceosomes, for which disruption impaired alternative splicing and weak/suboptimal 5'SS selection, and enhanced cryptic splicing, predominantly in ciliary and retinal-specific transcripts. Altered splicing efficiency, nuclear speckles organisation, and PRPF8 interaction with U6 snRNA, caused accumulation of active spliceosomes and poly(A)+ mRNAs in unique splicing clusters located at the nuclear periphery of photoreceptors. Collectively these elucidate the role of PRPF8/Brr2 regulatory mechanisms in splicing and the molecular basis of retinal disease, informing therapeutic approaches.


Conflict of interest statement

The authors declare no competing interests. The funders had no role in study design, data collection and analysis, decision to publish, or preparation of the manuscript.

Figures
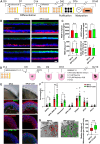
Fig. 1
Fig. 1. Generation and characterisation of RPE and retinal organoids from RP13 and isogenic controls (RP13-Cas9).
A Schematic of iPSC-RPE differentiation; (B) Ezrin (green) and collagen IV (red) indicate that RP13-Cas9 iPSC-RPE have more protein present at the apical and basal membranes, respectively, relative to positions of nuclei (blue, Hoescht). Scale bar is 10 µm; (C) Functional characterisation of RP13 and RP13-Cas9 RPE cells. From left to right: Concentration of PEDF in apical transwell compartment of RP13 iPSC-RPE (4123 ± 1576 ng/ml, n = 3) was significantly higher for RP13-Cas9 control (2467 ± 1472 ng/ml, n = 3); concentration of VEGF in the basal compartment was similar between RP13 (10.9 ± 0.7 ng/ml, n = 3) and RP13-Cas9 iPSC-RPE (12.3 ± 2.1 ng/ml, n = 3); transepithelial resistance (TEER) values for RP13 (median = 222 Ω*cm2, LQ = 172 Ω*cm2, UQ = 298 Ω*cm2, min =  88 Ω*cm2, max = 510 Ω*cm2, n = 102) and RP13-Cas9-RPE (median = 227 Ω*cm2, LQ = 111 Ω*cm2, UQ = 292 Ω*cm2, min = 47 Ω*cm2, max = 525 Ω*cm2, n = 118) were not significantly different (p = 0.12); percentage of cells with internalised POS were not significantly different between RP13 (58 ± 13%, n = 3) and RP13-Cas9 (54 ± 17%, n = 3); (D) Schematic of iPSC-RO differentiation; (E) Bright field of ROs edge showing the brush border (scale bar 100 µm) and photoreceptors (Recoverin) comprised of red-green cones (OPN1LW/MW) and rods (Rhodopsin), and retinal ganglion cells (SNCG) cell (scale bar 50 µm); (F) Quantitative immunofluorescence analysis showing reduced cone, rod, and retinal ganglion cell presence in RP13 organoids (SNCG p = 0.039, OPN1 LW/MW p = 0.016, RHO p = 0.040, OPN1SW p = 0.085, PROX1 p = 0.099, AP2α p = 0.41). Data shown as mean ± SEM, n = 6; (G) Representative TEM images (left) showing elongated or swollen mitochondria, scale bar is 1 μm. Data shown in boxplots is median, box limits are 1st (LQ) and 3rd (UQ) quartiles, whiskers are maximum and minimum limits. Boxplots (right) quantifies reduced number of mitochondria in RP13 photoreceptor (PR) cell body (median = 70, LQ = 58, UQ = 95.3, min = 10, max = 150, n = 3) compared to RP13-Cas9 (median = 103.5, LQ = 77, UQ = 129, min = 33, max = 158, n = 3), p = 0.0042. Statistical significance was determined using paired 2-tailed t test (F and G) or 2-tailed Student’s t test (C). A and D were created with BioRender.com.
Fig. 2
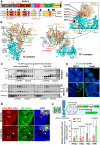
Fig. 2. The p.H2309P mutation in the PRPF8 Jab1/MPN tail does not disruptU4/U6.U5 tri-snRNP stability.
A Domain organisation of human PRPF8 (top), indicating RP mutations in PRPF8 Jab1/MPN and C-terminal tail regions (middle). NTD, N-terminal domain; NTDL, NTD linker; HB, helical bundle; RT, reverse transcriptase-like; En, endonuclease-like; RH, RNase H-like domain. Sequence alignment of the PRPF8 C-terminal region (bottom). Triangles, circles and cross indicate missense, frameshift and nonsense mutations, respectively; (B) 3D structures of PRPF8 (wheat), hBrr2 (cyan) and catalytic core RNAs in B and Bact spliceosomes (PDB IDs: 6AHD, 5Z56). Pre-mRNA, U6, U2 and U5 snRNAs shown in red, green, blue and orange, respectively. The hBrr2's catalytically active N-terminal (NC) and inactive C-terminal (CC) cassettes are labelled. The 5’SS/U6 ACAGA-box, pre-mRNA 5’-exon/U5-loop I, U4/U6 stem I, hBrr2 loading region on U4 snRNA and PRPF8 Jab1/MPN domain labelled as indicated on B-complex. Inset shows 3D structure of PRPF8 Jab1/MPN domain (wheat) complexed to hBrr2 (cyan) within spliceosomal Bact, showing PRPF8 C-terminal tail insertion into the hBrr2 RNA binding tunnel. p.H2309 and other RP-linked residues are highlighted by red or black spheres, respectively. RP-linked mutations (S1087L, R1090L) in hBrr2’s RNA binding tunnel are indicated (green); (C) Glycerol gradient fractionation of RP13 or Cas9-RPE whole cell extracts analysed by Northern blotting (top) or Western blotting (bottom). Additional bands seen in the Northern blot of control fractions 1-7 that are under-represented in the RP13 fractions are due to nonspecific binding of the probes to the whole cell extracts nucleic acids; (D) RNA‐FISH labelling of U5 snRNA (red) in Cajal bodies (anti‐coilin, green; arrows indicate clusters) in RP13-Cas9 and RP13 photoreceptors. Insets show magnified selected regions. Scale bar 10 µm; (E) Immunostaining of RPE and ROs with SC35 showing dispersion of nuclear speckles in RP13-photoreceptor and RPE cells. Scale bar 10 µm. The experiments were repeated twice in C and D and three times in (E, F); Bar graphs showing splicing efficiency of the intervening intron. To control for viral transduction efficiency, the luminescence of intron-containing transcript was normalised against the intronless transcript (n = 2 biologically independent samples). Two-tailed t test p-values shown above the bars. The schematic was created with BioRender.com.
Fig. 3
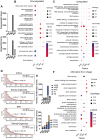
Fig. 3. Bulk RNA-Seq analysis of RP13- and RP13-Cas9-derived cells and organoids.
A Bar charts showing the higher number of DEGs in RP13-ROs and RPE cells; (B) GO enrichment analysis of genes downregulated and (C) upregulated in RP13-tissues, as determined using DESeq. Between 13 and 16 terms with the lowest adjusted p-values are displayed; (D) Density histogram showing the standard deviation of Percent Spliced In (PSI) values in RP13 and RP13-Cas9 derived cells and organoids, as measured using MAJIQ. Each data point was calculated using an f-test, but the overall p value in each graph between RP13 and RP13-Cas9 was obtained using an independent t test (E) Bar charts showing the higher number of differential ASEs as well as CSEs in RP13-ROs and RPE cells; (F) GO enrichment analysis of genes identified by rMATS as exhibiting differential exon usage. Fifteen terms with the lowest adjusted p-values are displayed. Abbreviations: BP – biological process, CC- cellular component, MF – molecular function, SE – skipped exon, RI -retained intron, MXE – mutually exclusive exons, A3SS – alternative 3’ splice site, A5SS – alternative 5’ splice site. B, C, and F) One-sided Fisher’s Exact Test with p-value adjustment for multiple comparisons (Benjamini & Hochberg) was carried out.
Fig. 4
Fig. 4. RP13- RPE cilia have increased length, abnormal morphology and altered transition zone structure.
A PRPF8 localisation to proximal ciliary membrane (ARL13B) in RP13 and RP13-Cas9-RPE cells, scale bar 10 μm; (B) Bar chart of cilia incidence, n = 15 fields of view from 3 donors and controls; (C) Boxplot of cilia length, n = 3901 and 3630 for RP13 (median = 2.96 μm, LQ = 2.36 μm, UQ = 3.63 μm, min = 1.09 μm, max = 7.72 μm, n = 3901) and RP13-Cas9 (median = 2.66 μm, LQ = 2.19 μm, UQ = 3.24 μm, min = 1.10 μm, max = 7.89 μm, n = 3630), p = 2.4 × 10−53, respectively where n is the total number of cilia from 3 donors and controls; (D) Representative image of a normal cilium, scale bar 1 μm. Blue arrowhead indicates “tail-like” morphology. Bar graph quantifies the percentage of normal cilia, n = 1499 and 1986 cilia analysed in Cas9 and RP13-RPE cells respectively (p = 0.0099); (E) Representative image of cilium without proximal ARL13B localisation, scale bar 1 μm. Bar graph quantifies the percentage of cilia without this localisation in RP13 and RP13-Cas9-RPE; n = 15 fields of view from 3 donors and controls (p = 0.0033); (F) Representative image and quantification of abnormal “blob”-shaped cilium, scale bar 1 μm; n = 15 fields of view from 3 donors (p = 0.00049); (G) Ciliary volume and length quantified using SBF-SEM, n = 184 individual cilia from 3 donors and controls, scale bar 1 μm; (H) iPSC-RPE cilia labelled for polyglutamylated tubulin (monoclonal antibody GT335), scale bar is 1 μm. The white arrowhead indicates the mother centriole (MC), and the purple arrowhead indicates the daughter centriole (DC, in RP13-RPE only). The yellow line indicates the ciliary transition zone (TZ). Boxplot quantifies average TZ length in RP13 (median = 0.40 μm, LQ = 0.35 μm, UQ = 0.46 μm, min = 0.24 μm, max = 0.59 μm, n = 27) and RP13-Cas9 (median = 0.29 μm, LQ = 0.21 μm, UQ = 0.36 μm, min = 0.12 μm, max =  0.57 μm, n = 36) iPSC-RPE cilia; n is number of cilia (p = 1.25 × 10−6); (I) ARL13B and CEP290 localisation, with bar graph expressing co-localisation as Pearson’s correlation coefficient, n = 15 fields of view obtained from 3 donors and controls (p = 0.0031); scale bar 400 nm; (J) Representative GT335 and IFT88 localisation using super-resolution microscopy, scale bar 1 µm. Bar graph quantifies mean IFT88 fluorescence intensity, n = 15 fields of view obtained from 3 donors and controls (p = 0.00012). B, C, EJ results are mean ± SEM; statistical significance analysed by two-tailed Student’s t-test with Welch’s correction (*P-value 0.05, **P-value < 0.01, ***P-value < 0.001, ****P-value < 0.0001.
Fig. 5
Fig. 5. Accumulation of active spliceosomes and poly(A)+ RNA in unique splicing clusters of human RP13 photoreceptors.
A Western blotting of the whole extracts from the KiOs, RPE and ROs tissues for the indicated splicing proteins. The beta-actin was used as a loading control for quantification; (B) Graphs showing quantification of p-SF3B1 (245.9 ± 4.4) and p-PRPF31 (145.4 ± 22.9) Western blot bands in RP13 RPE relative to the Cas9 controls (100.0 ± 0.0). The differences between RP13 and controls (two samples in each group) were only significant for p-SF3B1 (P-value = 0.0009), (***P-value < 0.001, two-tailed t test); (C) In photoreceptor cells active spliceosomes marked with p-SF3B1 (red) are localised in SC35 (green) clusters adjacent to DAPI-stained DNA foci (blue) at the periphery of the nucleus. The insets show the magnification of the selected regions. The experiment was repeated three times, independently. Scale bar 10 µm; (D) Accumulation of active spliceosomes (p-SF3B1, red) in splicing clusters (SC35, green) of RP13 photoreceptors. The insets show the magnification of the selected regions. The experiment was repeated three times, independently. Scale bar 10 µm; (E) Quantification of the intensities of p-SF3B1 clusters in RP13 versus Cas9 control photoreceptors (n ≥ 120 cells analysed) in (D); (F) Increased levels of poly(A)+ RNA (red) within the splicing clusters (SC35, green) in RP13-photoreceptors, monitored by RNA FISH followed by immunostaining for SC35. The insets show the zoom of the selected regions. The arrow indicates RNAs localised to the nuclear periphery in the control. The experiment was repeated two times, independently. Scale bar 10 µm; (G) Quantification of the co-localisation of poly(A)+ RNA with SC35-positive clusters in RP13 versus RP13-Cas9-photoreceptors (n ≥ 150 cells analysed) in (F); (H) Immunofluorescence imaging of photoreceptors labelled with RNAPII (green), p-SF3B1 (red) and counterstained with DAPI (blue) showing concentration of RNAPII in the splicing clusters in photoreceptors. The inset shows the magnification of the selected region. The arrow indicates RNAPII localised to the nuclear periphery. The experiment was repeated three times, independently. Scale bar 10 µm; (I) Schematic representation of the nuclear architecture in human photoreceptors showing their unique chromatin organisation and splicing clusters. The schematic was created with BioRender.com.
Fig. 6
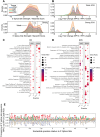
Fig. 6. PRPF8 iCLIP provides information on the interaction between PRPF8 and cognate snRNAs.
A Scatter plots showing the abundance of RNAs bound to PRPF8 in RP13- and RP13-Cas9 iPSC-derived tissues. Across all tissues, there is a relatively high level of U5 (RNU5), U6 (RNU6), and U4 (RNU4) snRNAs bound to PRPF8; (B) Line graphs showing the interaction profile between PRPF8 and U5 (RNU5), U6 (RNU6), and U4 (RNU4) snRNAs. A high number of reads suggests a strong interaction between PRPF8 and nucleotides at that position of the snRNA. Regions with strong binding to PRPF8 are highlighted in yellow (U5), light and dark green (U6), and blue (U4). Note the tissue-specific effect on PRPF8-U6 interactions in ROs and RPE, but not iPSCs and KiOs, comprising the binding of a 20-nucleotide region of U6 (nucleotides 26–46). The number of reads detected in RP13 tissues is plotted as a red line whereas those in RP13-Cas9 are plotted in green. An increase in binding between PRPF8 and a region of U6 (RNU6) (light green) was observed in both replicates of ROs and RPE cells. A similar increase in binding is apparent between PRPF8 and U4 (RNU4), although this effect was not reproducible across experiments; (C) Illustration showing the RNA-RNA interactions present in the pre-activated spliceosome (B). Most regions of the snRNAs identified as having a strong interaction with PRPF8 in (B) are highlighted in the colours used in (B), except for the dark green region in U6. The highly bound region of U6 that is highlighted in light green contains the ACAGA box; (D) Illustration showing the RNA-RNA interactions present in the activated spliceosome (Bact). All regions of the snRNAs identified as having a strong interaction with PRPF8 are highlighted in the colours used in (B). The dark green region of U6 maps to the U6-ISL which forms during B-complex activation.
Fig. 7
Fig. 7. PRPF8 iCLIP provides information on the interaction between PRPF8 and pre-mRNA.
A PRPF8 does not selectively bind to 3’ splice sites. The 3’SS strengths of bound pre-mRNA fragments are normally distributed, as would be expected for random sequences. PRPF8 selectively binds to 5’SSs. The biphasic distribution of 5’SS strengths has two maxima (approximate maxent5 scores of 2 and 9) separated by a local minima. These were categorised into three 5’SS strengths: weak (maxent5 score <3), strong (maxent5 score > 8), and intermediate (maxent5 score between 3 and 8); (B) Histograms showing fold changes (RP13/RP13-Cas9) of weak and strong 5’SSs. KiOs and iPSCs histograms have more pronounced peaks with low fold change values. RPE and ROs histograms have flatter distributions with a greater proportion of the values present in the tails of the curve. The kurtosis of the ROs and RPE graphs is lower than iPSCs and KiOs (Fig. S10C); (C) Gene set enrichment analysis of differentially bound weak and strong 5’SSs in ROs showing enrichment for transcripts encoding proteins mediating transcription and ciliary functions (e.g., RNA polymerase II transcription, cilium assembly, cargo trafficking to periciliary membrane); (D) Gene set enrichment analysis of differentially bound weak and strong 5’SSs in RPE. Direction down and up refers to positive and negative fold changes in (RP13/RP13-Cas9), respectively. GSEAPY interface for Enrichr with Fisher’s exact test was used in (C, D); (E) Gene sequence plot showing differential inclusion of nucleotides at weak 5’SSs with upregulated or downregulated binding to PRPF8 in ROs (B).
Fig. 8
Fig. 8. Differential expression of proteome between RP13 and RP13-Cas9.
A–C Volcano plots showing the log2 fold change against the two-tailed t-test derived −log10 statistical p-value for all proteins (represented by 2 or more unique peptides) and differentially expressed (DE) between RP13- and RP13-Cas9-derived tissues (A) 4535 unique proteins, DE = 203), RPE (B) 4574 unique proteins, DE = 56) and KiOs (C) 4294 unique proteins, DE = 4). Different RP13- and RP13-Cas9-ROs had consistent high correlation coefficients of R = 0.96–0.99, respectively. Upregulated and downregulated proteins are shown in magenta and blue, respectively. PRPF8 is labelled in red and proteins associated with retinal degeneration are labelled in green; (D, E) Top GO terms (in the domain of cellular components) related to proteins with significant differential expression in ROs (D) and RPE (E); (F, G) Correlation between proteomics, transcriptomics and iCLIP data in RP13 versus control ROs (F) and RPE (G); Scatter plot of protein abundance ratios against corresponding mRNA ratios is plotted. The changes in iCLIP ratios are displayed using a colour gradient. Selected hits are labelled. The colourless datapoints represent proteins that were not identified in the iCLIP experiments.

Similar articles

Cited by

References

    1. Wahl MC, Will CL, Lührmann R. The Spliceosome: design principles of a dynamic RNP machine. Cell. 2009;136:701–718. doi: 10.1016/j.cell.2009.02.009. - DOI - PubMed
    1. Agafonov DE, et al. Molecular architecture of the human U4/U6.U5 tri-snRNP. Science. 2016;351:1416–1420. doi: 10.1126/science.aad2085. - DOI - PubMed
    1. Yang C, et al. Pre-mRNA processing factors and retinitis pigmentosa: RNA splicing and beyond. Front. Cell Dev. Biol. 2021;9:700276. doi: 10.3389/fcell.2021.700276. - DOI - PMC - PubMed
    1. Mordes D, et al. Pre-mRNA splicing and retinitis pigmentosa. Mol. Vis. 2006;12:1259–1271. - PMC - PubMed
    1. Galej WP, Hoang Duong Nguyen T, Newman AJ, Nagai K. Structural studies of the spliceosome: zooming into the heart of the machine This review comes from a themed issue on Macromolecular machines. Curr. Opin. Struct. Biol. 2014;25:57–66. doi: 10.1016/j.sbi.2013.12.002. - DOI - PMC - PubMed

Supplementary concepts