. 2024 Apr 11;15(1):3149.
doi: 10.1038/s41467-024-47242-3.

Nardilysin-regulated scission mechanism activates polo-like kinase 3 to suppress the development of pancreatic cancer

Affiliations

Nardilysin-regulated scission mechanism activates polo-like kinase 3 to suppress the development of pancreatic cancer

Jie Fu et al. Nat Commun. .

Abstract

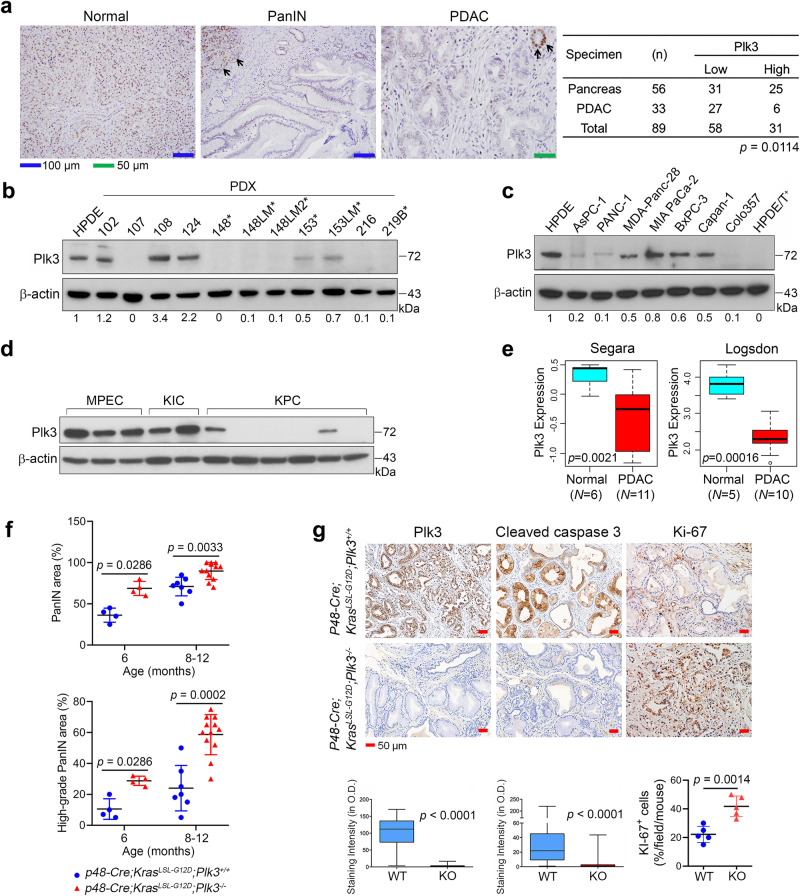
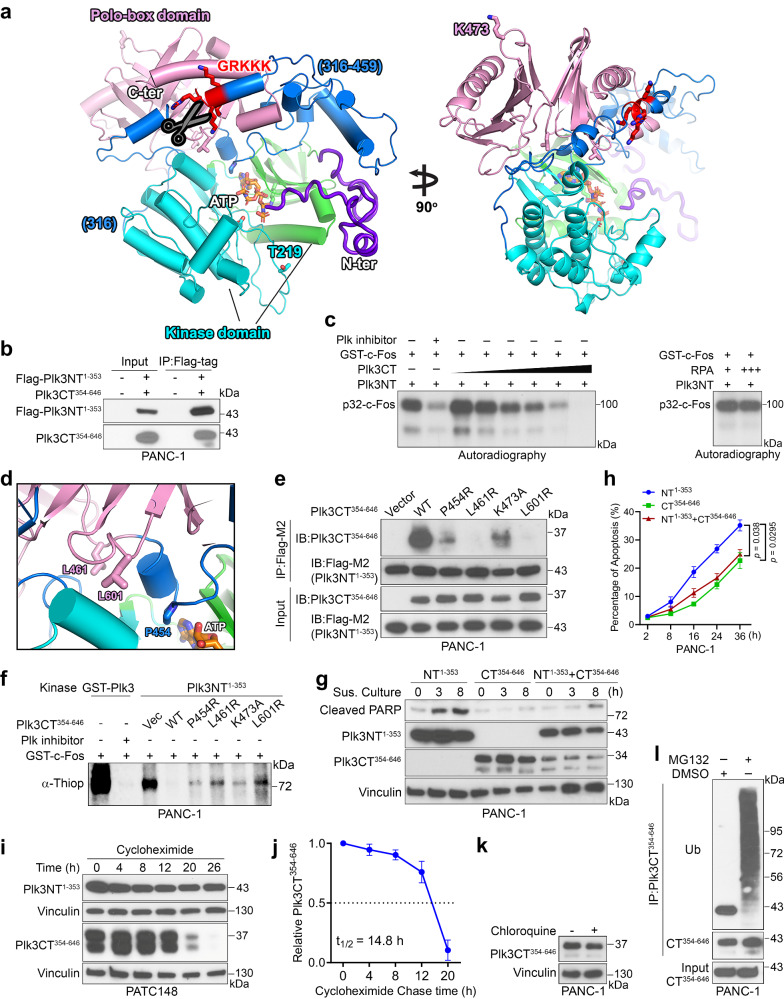
Pancreatic ductal adenocarcinoma (PDAC) develops through step-wise genetic and molecular alterations including Kras mutation and inactivation of various apoptotic pathways. Here, we find that development of apoptotic resistance and metastasis of KrasG12D-driven PDAC in mice is accelerated by deleting Plk3, explaining the often-reduced Plk3 expression in human PDAC. Importantly, a 41-kDa Plk3 (p41Plk3) that contains the entire kinase domain at the N-terminus (1-353 aa) is activated by scission of the precursor p72Plk3 at Arg354 by metalloendopeptidase nardilysin (NRDC), and the resulting p32Plk3 C-terminal Polo-box domain (PBD) is removed by proteasome degradation, preventing the inhibition of p41Plk3 by PBD. We find that p41Plk3 is the activated form of Plk3 that regulates a feed-forward mechanism to promote apoptosis and suppress PDAC and metastasis. p41Plk3 phosphorylates c-Fos on Thr164, which in turn induces expression of Plk3 and pro-apoptotic genes. These findings uncover an NRDC-regulated post-translational mechanism that activates Plk3, establishing a prototypic regulation by scission mechanism.


Conflict of interest statement

The authors declare no competing interests.

Figures

Fig. 1
Fig. 1. Plk3 expression is reduced in human PDAC, and deleting Plk3 promoted KrasLSL-G12D-driven PDAC development and metastasis in mice.
a Representative micrographs of Plk3-stained tissue sections showing strong nuclear Plk3 expression in normal pancreas and loss of Plk3 expression in PDAC and PanIN lesions. Strong nuclear expression of Plk3 in normal pancreas serves as an internal positive control in PanIN and PDAC lesions (middle and right panels, arrows). p = 0.0114, Fisher’s exact test. b, c Immunoblots of p72Plk3 in a panel of PDX cell lines (b), in human PDAC cell lines and tumorigenic HPDE/T+ cells (c). * indicates cells derived from liver metastases of primary PDAC. The Plk3:β-actin ratios are shown at the bottom. d Immunoblot of p72Plk3 in three mouse pancreatic epithelial cell lines (MPEC) and PDAC cell lines derived from multiple KIC and KPC mouse models. e Box plots of Plk3 expression in the Segara and Logsdon cancer microarray datasets from Oncomine (https://www.oncomine.com), student t-test. f Quantification of the PanIN areas and PanIN grading in pancreatic tissues, obtained from 6- and 8- to 12-month-old p48-cre;KrasLSL-G12D;Plk3+/+ (Plk3-WT) and p48-cre;KrasLSL-G12D;Plk3/ (Plk3-KO) mice. Higher-grade PanIN lesions are defined as PanIN-1B, PanIN-2, and PanIN-3 lesions; n = 4 Plk3-WT and 4 Plk3-KO independent mice of 6 months old; n = 7 Plk3-WT and 12 KO independent mice of 8–12 months old. Error bars, mean ± SD; unpaired Student t-test (two tailed) with Welch’s correction for PanIN areas and Mann–Whitney test (two tailed) for grading. g IHC staining for Plk3, cleaved caspase-3, and Ki-67 in Plk3-WT and -KO mice (n = 5). The quantification shows the number or proportion of cells positive for each marker. O.D., optical density. Data in (bd) are representative of two independent experiments with similar results. Error bars, mean ± SD (f, ki-67 in g), two-tailed unpaired t-test (f, ki-67 in g). Box plots indicate minima (lower end of whisker), maxima (upper end of whisker), median (center), 25th percentile (bottom of box), and 75th percentile (top of box) (e, g). Source data are provided as a Source Data file.
Fig. 2
Fig. 2. Proteolytic processing of p72Plk3 to generate p41Plk3 is important for induction of anoikis.
a Left, immunoblot of Plk3 expression under a Dox-inducible system in HPNE cells treated with Dox for the indicated times. Middle and right, apoptosis-inducing activity of HPNE/iPlk3 as evaluated using Annexin V/PI staining and flow cytometry analysis. b, c Immunoblots of cleaved PARP in HPDE cells (b) and PDAC cells (c) grown in suspension (Sus. Culture) on polyHEMA pre-coated plates at the indicated times. C.B.S., Coomassie blue–stained protein bands as a loading control. d, e Immunoblots of cleaved PARP in HPDE cells with stable shRNA-mediated knockdown of Plk3 (d) and stably reconstituted with Flag-Plk3 (e). f Immunoblot of p72Plk3 and p41Plk3 in PANC-1 cells transfected with N-terminal Flag-p72Plk3. g Immunoblot of p72Plk3 and p41Plk3 in a panel of PDX cell lines grown in suspension culture for 48 h. hj Immunoblots of p72Plk3 and p41Plk3 in HPDE cells (h), PATC50 cells, PANC-1 cells (i), and 293T cells (j) grown in suspension for the indicated times. k, l Immunoblot of p72Plk3, p41Plk3 expression (k) and flow cytometry analysis of apoptosis-inducing activity (l) of indicated PDAC cells that were lentivirally transduced to express the sgRNA targeting Plk3 or non-targeting control sgRNA. Cells grow on tissue culture plates (Attached) or polyHEMA-coated plates in suspension (Suspension). The p41Plk3:p72Plk3 ratios are shown at the bottom. m, n Immunoblots of p72Plk3 and p32Plk3 in PANC-1 cells grown in suspension condition. Expression of Plk3 aa 354-646 in lane 4 in (n) was used as a positive control. o Immunoblot of p38Plk1 expression in PANC-1 cells transfected with Myc-p68Plk1 in suspension culture for the indicated times. p Immunoblot of Plk1 cleavage in the indicated PDAC cells transfected with Plk1 shRNA. The p41Plk3:p72Plk3 ratios or p32Plk3:p72Plk3 ratios are shown at the bottom in (f, hj, and m). Data are representative of two independent experiments with similar results (a left, bk, mp). n = 3 independent experiments (a, l). Error bars, mean ± SEM (a right, l), two-tailed unpaired t-test (a right), ANOVA analysis (l). Source data are provided as a Source Data file.
Fig. 3
Fig. 3. Identification of the proteolytic cleavage site in the DR1 domain of Plk3.
a Top, the Plk3 protein disorder plot was generated by GeneSilico MetaDisorder server (http://genesilico.pl/metadisorder/). The Solvent accessibility was predicted by RaptorX server. Bottom, the Plk3 domain diagram matching the disorder tendency is shown. b Schematic diagram of Flag-tagged Plk3 and mutants with DR1 region and the NRDC cleavage site depicted. ce Colony-formation assay (c, d) and flow cytometry analysis of apoptosis-inducing activity (e) from PANC-1 cells transfected with indicated Flag-tagged Plk3 or mutants (Plk3NT1-353 is p41Plk3). f Immunoblots of p72Plk3 and p41Plk3 (left) and cleaved PARP (right) at the indicated times in PATC50 cells transfected with Flag-tagged WT p72Plk3 or Plk3 mutants and grown under suspension conditions. g, h Immunoblot of p72Plk3 and p41Plk3 expression (g) and flow cytometry analysis of apoptosis-inducing activity (h) from PDAC cells transfected with indicated Flag-tagged Plk3-WT or mutants and grown under suspension conditions for 36 h. i Immunoblot of p72Plk3 and p41Plk3 expression in PATC148 cells that were lentivirally transduced to express the sgRNA targeting NRDC or non-targeting control sgRNA, and then stably transfected with p72Plk3 or p72Plk3R354G under a Dox-inducible system. j Immunoblot of p68Plk1 and p38Plk1 expression in PANC-1 cells that were stably transfected with Plk1 or Plk1R337G after the CRISPR/Cas9 deletion of NRDC. Cells in i and j were grown in suspension culture for 48 h. k PATC148 cells stably expressing Dox-inducible p72Plk3 or p72Plk3R354G were lentivirally transduced to express NRDC WT or H233G/H237G/E236G mutant. Lysates were subjected to immunoblot to assess the cleavage of Plk3. Data are representative of two independent experiments with similar results (f, g, ik). Error bars, mean ± SEM (d, e, h), n = 3 independent experiments, two-tailed unpaired t-test (d, e, h). Source data are provided as a Source Data file.
Fig. 4
Fig. 4. Phosphoinositide 3-kinase regulates NRDC activity for Plk3 and Plk1 activation via centaurin-α1.
a Immunoprecipitation and IB detection of NRDC-Plk3 interactions in PANC-1 cells transfected with Flag-tagged Plk3-WT, R354G, or Δ326–377 mutants. b p41Plk3 expression under a Dox-inducible system in PATC148 cells treated with Dox for the indicated times. c, d Results of immunofluorescence (c) and immunoblot (d) performed to show localization of p72Plk3, p41Plk3, and NRDC and to detect interactions between p72Plk3 or p41Plk3 and NRDC in PATC148 cells with Dox-inducible expression of p72Plk3 or p41Plk3. Bar, 10 μM. e, f Immunoblots of p72Plk3, p41Plk3, and cleaved PARP expression in PATC148/ip72Plk3 cells (e) and p72Plk3-transfected PANC-1 cells (f) treated with PI3K inhibitor LY294002 (20 µM) for indicated times. g p72Plk3 and p41Plk3 expression in PANC-1 cells co-transfected with Plk3 and a vector control or the PI3K catalytic unit p110α. h p41Plk3, NRDC, and p110α expression in a panel of PDAC cell lines and HPDE cells grown in suspension for 36 h. i, m Immunoblots of p72Plk3 and p41Plk3 (i) or p68Plk1 and p38Plk1 (m) in PTEN+/+ and PTEN/ MEF cells transfected with p72Plk3 or p68Plk1 in suspension culture for indicated times. j IP and IB detection of increased binding of NRDC with α-centaurin and decreased binding of Plk3 with NRDC in PANC-1 cells transfected with Flag-p72Plk3 and treated with or without LY294002 (32 μM). k IP and IB detection of Plk1-NRDC interactions in PANC-1 cells. l Immunoblot of p68Plk1 and p38Plk1 in Plk1 transfected PANC-1 cells treated with LY294002 (20 µM) for different times. Data in (a, b, dm) are representative of two independent experiments with similar results. Source data are provided as a Source Data file.
Fig. 5
Fig. 5. C-terminal p32Plk3 inhibits N-terminal p41Plk3 kinase activity and apoptosis-inducing activity.
a Model of Plk3 structure predicted by Rosetta server from a close Plk1 structural homolog (PDB: 4j7b) shows interactions between kinase domain (two lobes in cyan and green ribbon), flexible N-terminus region (purple) and Polo-box domain (pink), connected by a flexible linker region (blue) containing the NRDC cleavage site (GRKKK). ATP analog, AMPPNP (orange sticks), is modeled at the hinge between the two lobes of the kinase domain by superimposition with Plk1 kinase domain (PDB: 2ou7). b IP and IB detection of N- and C-terminus Plk3 interaction in cells transfected with Flag-Plk3NT1-353 and Plk3CT354-646. c In vitro kinase assay of recombinant GST-Plk3NT in the presence of increased MBP-Plk3CT-His or a non-relevant protein, RPA with or without treatment with Plk inhibitor. Substrate c-Fos identification is described in Fig. 6. d Selected separation-of-function residues at the interface of kinase and PBD are shown in sticks. e, f IP and IB detection of N- and C-terminus Plk3 interactions (e) and in vitro kinase assay of N-terminus Plk3 (f) in PANC-1 cells transfected with Flag-Plk3NT1-353 and Plk3CT354-646 or mutants. g, h Immunoblot of cleaved PARP (g) and apoptosis-inducing activity (h) in PANC-1 cells transfected with NT1-353, CT354-646 of Plk3 alone, or co-transfected with NT1-353 and CT354-646 of Plk3. i N- and C-terminus Plk3 expression in NT1-353- or CT354-646-Plk3 transfected PATC148 cells treated with cycloheximide (10 µg/ml) at the indicated time points. j Quantification of cycloheximide assays to depict Plk3CT354-646 expression vs. timed cycloheximide treatment. Dotted line indicates 50% of initial Plk3CT354-646 protein signal. k Immunoblot of C-terminus Plk3 in PANC-1 cells transfected with Plk3CT354-646 followed by chloroquine treatment (10 µM). l Immunoblot of ubiquitination of C-terminus Plk3 in Plk3CT354-646-transfected PANC-1 cells treated with DMSO or MG132 (10 µM). Each experiment was repeated an additional time with similar results (b, c, eg, i, k, l). Error bars, mean ± SEM (h, j), n = 3 independent experiments, two-tailed unpaired t-test (h, j). Source data are provided as a Source Data file.
Fig. 6
Fig. 6. Activated p41Plk3 phosphorylates c-Fos at Thr164 and regulates a Plk3/c-Fos feed-forward pathway to promote apoptosis.
a IP and IB analysis of the interaction between Plk3WT or mutants and c-Fos in PANC-1 cells. be qRT-PCR analysis of c-Fos–regulated pro-apoptotic or cell-cycle–related (b, c) and anti-apoptotic (d, e) gene expression in HPNE cells with inducible expression of p72Plk3 or p41Plk3. f In vitro kinase assay using p72Plk3-SFB (boxed, S protein-FLAG-streptavidin binding peptide, tagged at Plk3 C-terminus), Flag-p41Plk3 (boxed), or Flag-p72Plk3KD (kinase-dead K91R mutant) immunoprecipitated from 293T cells to incubate with purified recombinant GST–c-Fos with or without Plk inhibitor. P53 and c-Fos phosphorylation by recombinant GST-Plk3 (a mixture of p72Plk3 and p41Plk3) was used as positive control; phosphorylation was detected by α-ThioP (asterisk). g In vitro kinase assay showing Plk3-mediated phosphorylation of c-Fos caused c-Fos migration to a higher molecular weight position. Shifted and unshifted c-Fos bands (Lane 3) with (Lane 4) or without (Lane 3) Plk inhibitor treatment were analyzed by mass spectrometry to deduce phosphorylation sites. c-Fos alone (Lane 2) was analyzed by mass spectrometry to exclude the c-Fos auto-phosphorylation. Both GST-Plk3 and GST–c-Fos are purified proteins as described in (f). Gel was stained by Coomassie blue. h, i qRT-PCR (h) and IB (i) analysis of p72Plk3 expression in c-Fos–transfected PANC-1 cells. j Chromatin IP assay and real-time PCR comparing the ratio of anti–c-Fos antibody to IgG at the indicated Plk3 promoter region. k Effects of expressing c-Fos WT and T164A mutant on the activity of Plk3 reporter in inducible PATC148/ip41Plk3 cells. ln Apoptosis-inducing activity (l, m) and immunoblot of cleaved PARP (n) in inducible148/ip41Plk3 cells stably transfected with c-Fos WT or T164A mutant. Data are representative of two independent experiments with similar results (a, f, g, i, n). Error bars, mean ± SEM (be, h, j, k, m), n = 3 independent experiments, two-tailed unpaired t-test (be, h, j, k, m), Source data are provided as a Source Data file.
Fig. 7
Fig. 7. Activated p41Plk3 suppressed PDAC tumorigenesis and metastasis.
a Left, pancreatic tissues or tumors removed on day 40 from nude mice (n = 5 mice/group) orthotopically injected with PATC148 cells (1 × 105 cells) harboring indicated p72Plk3, NRDC, and mutants. Right, tumor weight analysis. b, c Growth curve (b) and flow cytometry analysis (c) in PATC148 cells with inducible expression of p72Plk3 and p41Plk3 under the suspension culture at the indicated times. d Left, pancreatic tissues or tumors removed on day 53 from nude mice (n = 5) orthotopically injected with PATC148 cells (1 × 105 cells) with inducible expression of p72Plk3 or p41Plk3. Right, tumor weight analysis. e, f The rates of tumor formation, invasion, or metastasis (e) and hematoxylin and eosin stains of tissues and lesions (f) of the indicated groups in d. Arrowheads indicate liver or lung metastasis; arrow shows liver invasion. Bar, 100 µm. a, df +, on: mice were fed with Dox-containing water upon cell inoculation and continued for the indicated times. -, off: mice were maintained Dox-free. g Kaplan-Meier analysis of mice with AsPC-1 cells that grew for 2 weeks in a subcutaneous xenograft, after which liposome-mediated gene delivery of the indicated expression vectors was performed. VCTL, vector control (n = 5 mice/group). p value was calculated by Log-rank test. h The proposed working model of Plk3 and Plk1 activation. Error bars, Mean ± SD (a, d) or ± SEM (b, c), n = 3 independent experiments (b, c), two-tailed unpaired t-test (ad). Source data are provided as a Source Data file.

References

    1. Rahib L, et al. Projecting cancer incidence and deaths to 2030: the unexpected burden of thyroid, liver, and pancreas cancers in the United States. Cancer Res. 2014;74:2913–2921. doi: 10.1158/0008-5472.CAN-14-0155. - DOI - PubMed
    1. Rahib L, Wehner MR, Matrisian LM, Nead KT. Estimated projection of US cancer incidence and death to 2040. JAMA Netw. Open. 2021;4:e214708. doi: 10.1001/jamanetworkopen.2021.4708. - DOI - PMC - PubMed
    1. Bardeesy N, DePinho RA. Pancreatic cancer biology and genetics. Nat. Rev. Cancer. 2002;2:897–909. doi: 10.1038/nrc949. - DOI - PubMed
    1. Bardeesy N, Sharpless NE, DePinho RA, Merlino G. The genetics of pancreatic adenocarcinoma: a roadmap for a mouse model. Semin. Cancer Biol. 2001;11:201–218. doi: 10.1006/scbi.2000.0371. - DOI - PubMed
    1. Wang W, et al. The nuclear factor-kappa B RelA transcription factor is constitutively activated in human pancreatic adenocarcinoma cells. Clin. Cancer Res. 1999;5:119–127. - PubMed

MeSH terms