. 2024 Apr 11;11(1):363.
doi: 10.1038/s41597-024-03171-w.

An open source knowledge graph ecosystem for the life sciences

Affiliations

An open source knowledge graph ecosystem for the life sciences

Tiffany J Callahan et al. Sci Data. .

Abstract

Translational research requires data at multiple scales of biological organization. Advancements in sequencing and multi-omics technologies have increased the availability of these data, but researchers face significant integration challenges. Knowledge graphs (KGs) are used to model complex phenomena, and methods exist to construct them automatically. However, tackling complex biomedical integration problems requires flexibility in the way knowledge is modeled. Moreover, existing KG construction methods provide robust tooling at the cost of fixed or limited choices among knowledge representation models. PheKnowLator (Phenotype Knowledge Translator) is a semantic ecosystem for automating the FAIR (Findable, Accessible, Interoperable, and Reusable) construction of ontologically grounded KGs with fully customizable knowledge representation. The ecosystem includes KG construction resources (e.g., data preparation APIs), analysis tools (e.g., SPARQL endpoint resources and abstraction algorithms), and benchmarks (e.g., prebuilt KGs). We evaluated the ecosystem by systematically comparing it to existing open-source KG construction methods and by analyzing its computational performance when used to construct 12 different large-scale KGs. With flexible knowledge representation, PheKnowLator enables fully customizable KGs without compromising performance or usability.


Conflict of interest statement

The authors declare no competing interests.

Figures

Fig. 1
Fig. 1
A Knowledge Representation of the Levels of Biological Organization Underlying Human Disease. This knowledge graph provides a representation of our currently accepted knowledge of the Central Dogma expanded to include pathways, variants, pharmaceutical treatments, and diseases. At a high level this knowledge graph represents anatomical entities such as tissues, cells, and bodily fluids containing genomic entities such as DNA, RNA, mRNA, and proteins. DNA encodes genes that are processed into mRNA and translated into proteins, which can interact with each other. Genes can also be altered by variants and may cause disease. Finally, proteins also have molecular functions and participate in pathways and biological processes.
Fig. 2
Fig. 2
Types of Knowledge Graphs used in the Life Sciences. This figure provides examples of three types of knowledge graphs that are typically used in the Life Sciences. All knowledge graphs are modeling the Mondo concept ABCD syndrome (MONDO:0010895). (a) illustrates a simple graph-based representation where two nodes are connected by an edge and nodes and edges are assigned attributes in the form of key-value pairs. (b) illustrates a hybrid or property graph-based representation where edges are represented as sets of three nodes (each composed of a subject, predicate, and object) called triples, often based on the RDF/RDFS standards. (c) illustrates a complex or OWL-graph-based representation where edges are represented as triples and these representations are augmented with additional OWL expressivities such as domain/range or cardinality restrictions. Acronyms: HP (Human Phenotype Ontology); MONDO (Mondo Disease Ontology); OWL (Web Ontology Language); RDF (Resource Description Framework); RDFS (Resource Description Framework Syntax); RO (Relation Ontology).
Fig. 3
Fig. 3
The PheKnowLator Ecosystem. This figure provides an overview of the PheKnowLator ecosystem. The ecosystem consists of three components as indicated by the gray boxes: (1) Knowledge Graph Construction Resources, which consist of resources to download and process data and an algorithm to customize the construction of large-scale heterogeneous biomedical knowledge graphs; (2) Knowledge Graph Benchmarks, which consist of prebuilt KGs that can be used to systematically assess the effects of different knowledge representations on downstream analyses, workflows, and learning algorithms; and (3) Knowledge Graph Tools to use knowledge graphs, cloud-based data storage, APIs, and triplestores. Acronyms: NT (N-Triples file format); OWL (Web Ontology Language); PKL (Python pickle file format); SPARQL (SPARQL Protocol and RDF Query Language).
Fig. 4
Fig. 4
Open-Source Knowledge Graph Construction Methods - Survey Results. This figure presents the open-source knowledge graph construction methods identified on GitHub and the results of the survey assessment. (a) The final set of 16 knowledge graph construction methods surveyed according to the year they were first published on GitHub. (b) A chart of the methods evaluated in terms of the different survey categories. The survey was scored out of a total score of five points, which was derived as the sum of the ratios of coverage, each out of one point, for the five categories: KG Construction Functionality (10 questions); Availability (two questions); Usability (nine questions); Maturity (five questions); and Reproducibility (six questions). Acronyms: iASiS, Automated Semantic Integration of Disease-Specific Knowledge; KaBOB, Knowledge Base Of Biomedicine; KG, (Knowledge Graph); KGX (Knowledge Graph Exchange); KGTK (Knowledge Graph Toolkit); SeMi (SEmantic Modeling machine).
Fig. 5
Fig. 5
An Overview of the PKT Human Disease Mechanism Knowledge Graph. This figure provides a high-level overview of the primary node and edge types in the PKT Human Disease Mechanism knowledge graph. (a) illustrates the relationships between the core set of Open Biological and Biomedical Ontology (OBO) Foundry ontologies when including their imported ontologies (as of August 2022). (b) illustrates the edges or triples that are added to the core set of merged ontologies in (a). Shared colors between (a) and (b) represent a single resource. For example, chemicals, cofactors, and catalysts share the same color (maroon) and are part of ChEBI. This is the same for the RO, which is represented in (b) as the black lines between nodes. The green and yellow rectangles indicate data sources that are not from an OBO Foundry ontology and the specific ontology used to integrate them with the core set of ontologies in (a). For example, variant, transcript, and gene data are connected to the core ontology set via the SO. Acronyms: CL (Cell ontology); CLO (Cell Line Ontology); ChEBI (Chemical Entities of Biological Interest); GO (Gene Ontology); HPO (Human Phenotype Ontology); Mondo (Mondo Disease Ontology); PRO (Protein Ontology); PW (Pathway Ontology); SO (Sequence Ontology); VO (Vaccine Ontology); Uberon (Uber-Anatomy Ontology).
Fig. 6
Fig. 6
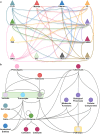
The Impact of Knowledge Model Harmonization on the Semantically Abstracted PKT Human Disease Knowledge Graphs. The figure visualizes the impact of knowledge model harmonization on the semantically abstracted PKT Human Disease benchmark Knowledge Graphs. The top row of figures (ad) were built using the class-based knowledge model varying: (a) standard relations without harmonization; (b) standard relations with harmonization; (c) inverse relations without harmonization; (d) inverse relations with harmonization. The bottom row of figures (e-h) were built using the instance-based knowledge model varying: (e) standard relations without harmonization; (f) standard relations with harmonization; (g) inverse relations without harmonization; (h) inverse relations with harmonization. Nodes are colored by type: anatomical entities (light blue), chemical entities (light purple), diseases (red), genes (purple), genomic features (light green), organisms (yellow), pathways (dark green), phenotypes (magenta), proteins (dark blue), molecular sequences (orange), transcripts (turquoise), and variants (light pink).
Fig. 7
Fig. 7
Description Logics Approaches to Knowledge Modeling. This figure provides a simple example of two approaches for modeling knowledge within a Description Logics architecture. (a) The TBox includes classes (i.e., “Gene”, “DNA sequence”, and “Cell nucleus”), properties (i.e., “located in” and “is a”), and the assertions between classes (i.e., “Gene is a DNA sequence” and “Gene located in Cell nucleus”). (b) The ABox includes instances of classes (i.e., “Endothelin receptor type B”) represented in the TBox and assertions about those instances (i.e., “Endothelin receptor type B, instance of, Gene” and “Endothelin receptor type B, causes, ABCD syndrome”). Please note that this figure is a simplification and was inspired by Fig. 2 from Thessen et al..
Fig. 8
Fig. 8
An Example of How Variant-Disease Edges are Created in the PKT Human Disease Mechanism Knowledge Graph. This figure provides an end-to-end example of how variant-disease edges are created in the PKT Human Disease Mechanism knowledge graph. Beginning with the Data Preparation stage, in Step 1, the primary data source (i.e., ClinVar data) is downloaded and cleaned, which includes steps such as replacing “NaN” values with “None”, removing bad or missing identifiers, unnesting the data, and reformatting identifiers. The cleaned data (highlighted in yellow) are output for ingestion into the Knowledge Graph Construction stage. In Step 2, metadata are extracted from the primary data source to create labels, synonyms, and descriptions for each identifier. Step 3 leverages a manually curated resource (highlighted in green) to map variant identifiers to a PKT core ontology. In this case, variant identifiers are aligned to the Sequence Ontology (SO) by their type, and the final mapping is output to subclass_construction_map.pkl which is one of the required inputs for constructing a knowledge graph (highlighted in purple; cited example is from the May 2021 Class-Standard Relation-OWL build). In Step 4, the final step of this stage, the remaining required input documents for constructing a knowledge graph are updated with the resources created in the prior steps. In the Knowledge Graph Construction stage, the cleaned variant data are downloaded and an edge list is built. This edge list can then be used to construct the 12 different knowledge graphs shown in the bottom right gray box. In this example, the class-based semantically abstracted knowledge graphs are the same whether harmonization is applied or not, which is often the case for class-based builds that leverage Open Biological and Biomedical Ontology Foundry ontologies. See the Data_Preparation.ipynb Jupyter Notebook (https://github.com/callahantiff/PheKnowLator/blob/master/notebooks/Data_Preparation.ipynb) for code to process all resources used in the PKT Human Disease knowledge graph. Acronyms: PKT (PheKnowLator). Note. A UUID is a blank or anonymous node that is created from an md5 hash of concatenated Universal Resource Identifiers (URIs). The URIs used in the hash string include the subject and object URIs (each appended with “subject” and “object,” respectively) in addition to a relation. All UUIDs created during construction are explicitly defined within the PKT namespace (https://github.com/callahantiff/PheKnowLator/pkt/).

References

    1. Agrawal R, Prabakaran S. Big data in digital healthcare: lessons learnt and recommendations for general practice. Heredity. 2020;124:525–534. doi: 10.1038/s41437-020-0303-2. - DOI - PMC - PubMed
    1. van Dijk EL, Auger H, Jaszczyszyn Y, Thermes C. Ten years of next-generation sequencing technology. Trends Genet. 2014;30:418–426. doi: 10.1016/j.tig.2014.07.001. - DOI - PubMed
    1. Gupta, N. & Verma, V. K. Next-Generation Sequencing and Its Application: Empowering in Public Health Beyond Reality. in Microbial Technology for the Welfare of Society (ed. Arora, P. K.) 313–341 (Springer Singapore, Singapore, 2019).
    1. Graw S, et al. Multi-omics data integration considerations and study design for biological systems and disease. Mol Omics. 2021;17:170–185. doi: 10.1039/D0MO00041H. - DOI - PMC - PubMed
    1. Reuter JA, Spacek DV, Snyder MP. High-throughput sequencing technologies. Mol. Cell. 2015;58:586–597. doi: 10.1016/j.molcel.2015.05.004. - DOI - PMC - PubMed

MeSH terms