. 2024 Apr 11;15(1):3151.
doi: 10.1038/s41467-024-47501-3.

Adaptive expansion of ERVK solo-LTRs is associated with Passeriformes speciation events

Affiliations

Adaptive expansion of ERVK solo-LTRs is associated with Passeriformes speciation events

Guangji Chen et al. Nat Commun. .

Abstract

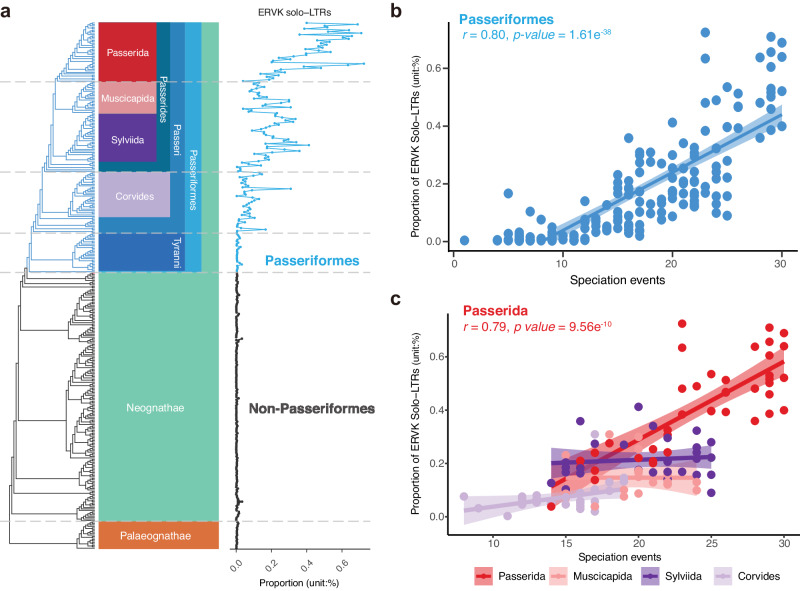
Endogenous retroviruses (ERVs) are ancient retroviral remnants integrated in host genomes, and commonly deleted through unequal homologous recombination, leaving solitary long terminal repeats (solo-LTRs). This study, analysing the genomes of 362 bird species and their reptilian and mammalian outgroups, reveals an unusually higher level of solo-LTRs formation in birds, indicating evolutionary forces might have purged ERVs during evolution. Strikingly in the order Passeriformes, and especially the parvorder Passerida, endogenous retrovirus K (ERVK) solo-LTRs showed bursts of formation and recurrent accumulations coinciding with speciation events over past 22 million years. Moreover, our results indicate that the ongoing expansion of ERVK solo-LTRs in these bird species, marked by high transcriptional activity of ERVK retroviral genes in reproductive organs, caused variation of solo-LTRs between individual zebra finches. We experimentally demonstrated that cis-regulatory activity of recently evolved ERVK solo-LTRs may significantly increase the expression level of ITGA2 in the brain of zebra finches compared to chickens. These findings suggest that ERVK solo-LTRs expansion may introduce novel genomic sequences acting as cis-regulatory elements and contribute to adaptive evolution. Overall, our results underscore that the residual sequences of ancient retroviruses could influence the adaptive diversification of species by regulating host gene expression.


Conflict of interest statement

The authors declare no competing interests.

Figures

Fig. 1
Fig. 1. Solo-LTRs in bird genomes display different patterns from those of mammals and reptiles.
a Phylogenetic tree with the proportion of solo-LTRs (the inner circle) and the ratio of solo-LTR (outer circle) in birds (n = 362), reptiles (n = 23), and mammals (n = 20). The inner circle represents the proportion of solo-LTRs relative to the genome size. The outer circle represents the ratio of solo-LTRs to total LTRs length, indicating the frequency of solo-LTRs formation. Taxonomic information follows classifications in Howard and Moore. b Solo-LTRs counts were positively correlated with genome size in mammals (n = 20) and reptiles (n = 22), but not in birds (n = 345). Bird and reptile species with potentially problematic assemblies (genome size < 800 Mb or scaffold N50 < 20 kb) were filtered to reduce the bias of assembly quality. Dots correspond to individual species, with red dots indicating bird species, purple dots indicating reptile species, and blue dots indicating mammal species. Correlation analysis was performed by using Pearson correlation at 95% confidence interval, and colored regions indicate the 95% confidence interval for each regression line. Source data are provided as a Source Data file.
Fig. 2
Fig. 2. ERVK solo-LTRs accumulate during speciation events in Passeriformes.
a Phylogenetic tree illustrating the proportion of ERVK solo-LTRs in 362 bird species. Branches correspond to different species; from top to bottom, the branches above the five gray dashed lines correspond to species in Passerida, Passerides, Passeri, Passeriformes, and Neognathae, respectively. Based on the B10K family-level bird phylogeny. b ERVK solo-LTRs positively correlated with the number of speciation events in Passeriformes. c The positive correlation can also be observed in the parvorder Passerida. Each dot represents a species and each color of dots represents a clade of birds (n = 169, 41, 20, 33, and 30 for Passeriformes, Passerida, Muscicapida, Sylviida and Corvides, respectively). Speciation events were measured as the number of nodes along a path from the Passeriformes ancestor node to the tips of each species, based on B10K family-level bird phylogeny. Colored regions indicate the 95% confidence interval for each regression line in (b, c). Correlation analysis was performed by using Pearson correlation at 95% confidence interval. Source data are provided as a Source Data file.
Fig. 3
Fig. 3. Indication of the ongoing accumulation of ERVK solo-LTRs.
a Shared ERVK solo-LTRs constitute a large portion of all ERVK solo-LTRs in 41 Passerida bird species among 143 Passeri bird species. b Heatmap of the RNA expression levels of ERVK retroviral genes (n = 120) among three reproductive tissues and four other tissues. We applied a log10(count + 1) transformation to the normalized count for visualization. The black and gray cubes indicate significantly different levels of RNA expression between the ovary, testis, or primordial germ cells (PGC) in comparison with other organs (thresholds: log2 (fold change) > = 1 with Benjamini-Hochberg adjusted p-value < 0.05). c Upset plot illustrating the polymorphic status of ERVK solo-LTRs shared among the zebra finch population (n = 19). The top bars indicate the number of shared ERVK solo-LTRs, which are two or higher. Silhouettes of the testis, ovary, blood and brain are modified from the images by brgfx on www.freepik.com. Source data are provided as a Source Data file.
Fig. 4
Fig. 4. ERVK solo-LTRs function as regulatory elements in the brain of the zebra finch.
a In zebra finch, the number of genes located within 2 kb, 5 kb, and 10 kb flanking regions of the regulatory elements overlap with 5535 ERVK solo-LTRs. b Significantly enriched GO terms of 1640 genes on molecular function were visualized by REVIGO tool. c Volcano plot shows DEGs between the brain tissues of zebra finch and chicken among 12,028 orthologous genes. Horizontal red dashed line indicates the cutoff of Benjamini-Hochberg adjusted p-value = 0.05, and the vertical black dashed lines indicate a 2-fold change. d Genomic collinearity plot of ITGA2 gene showed that the solo-LTRs residue overlapped with H3K27ac signal in zebra finch. Silhouettes of the zebra finch and chicken are from https://www.phylopic.org/. e Fluorescence in situ hybridization (FISH) microscope photographs of the brain of a zebra finch. Expression signals of ITGA2 and SCG10 were indicated in red and cyan, respectively. The SCG10 gene, which encodes a neuron-specific stathmin protein, was used as control. The blue signal, obtained from 4’ 6-diamidino-2-phenylindole (DAPI) staining, shows the location of the nucleus. The HVC, RA, and Area X regions are labeled according to the schematic diagram, which was modified based on the data retrieved from the ZEBrA database (Oregon Health & Science University, Portland, OR 97239; http://www.zebrafinchatlas.org). f Relative ITGA2 expression to the DAPI signal revealed that ITGA2 was highly expressed in the zebra finch compared to the chicken. The ITGA2 and DAPI signals were measured using the “Analytical Particle” function of the software FIJI, with ten random samples (n = 10) taken from regions throughout the whole brain. g Dual-luciferase reporter assay in the UMNSAH/DF-1 cell line demonstrated the potential cis-regulation activity of the 405 bp ERVK solo-LTRs insertion located upstream of the ITGA2 gene in the zebra finch. Relative luciferase activity was determined with n = 9 biologically independent repetitions for each experimental group. Horizontal lines indicate the mean (± s.d.) in (f, g). Welch’s two-tailed t-test was conducted using GraphPad Prism (p-value: **** < 0.0001) in (f, g). Source data are provided as a Source Data file.

Similar articles

Cited by

References

    1. Ryan FP. Human endogenous retroviruses in health and disease: a symbiotic perspective. J. R. Soc. Med. 2004;97:560–565. doi: 10.1177/014107680409701202. - DOI - PMC - PubMed
    1. Coffin, J. M. Structure and classification of retroviruses. In The Retroviridae 19–49 (Springer US, 1992).
    1. Vitte C, Panaud O. Formation of solo-LTRs through unequal homologous recombination counterbalances amplifications of LTR retrotransposons in rice Oryza sativa L. Mol. Biol. Evol. 2003;20:528–540. doi: 10.1093/molbev/msg055. - DOI - PubMed
    1. Baucom RS, et al. Exceptional diversity, non-random distribution, and rapid evolution of retroelements in the B73 maize genome. PLoS Genet. 2009;5:e1000732. doi: 10.1371/journal.pgen.1000732. - DOI - PMC - PubMed
    1. Vitte C, Panaud O. LTR retrotransposons and flowering plant genome size: emergence of the increase/decrease model. Cytogenet. Genome Res. 2005;110:91–107. doi: 10.1159/000084941. - DOI - PubMed