. 2024 Apr 12;14(1):8507.
doi: 10.1038/s41598-024-58868-0.

Single-B cell analysis correlates high-lactate secretion with stress and increased apoptosis

Affiliations

Single-B cell analysis correlates high-lactate secretion with stress and increased apoptosis

Olivia T M Bucheli et al. Sci Rep. .

Abstract

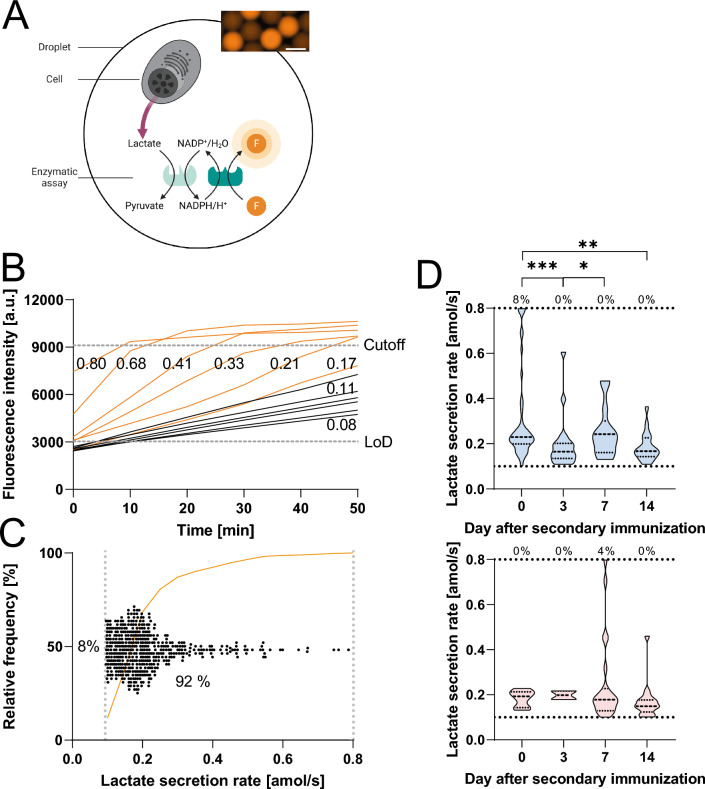
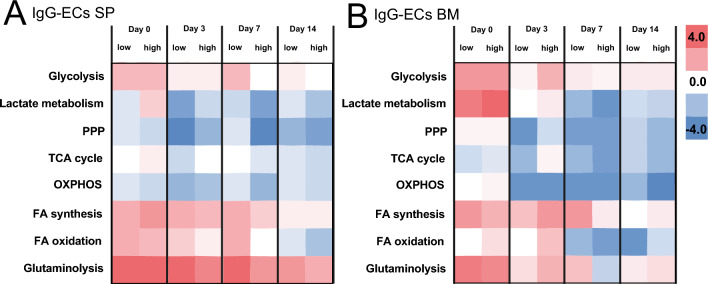
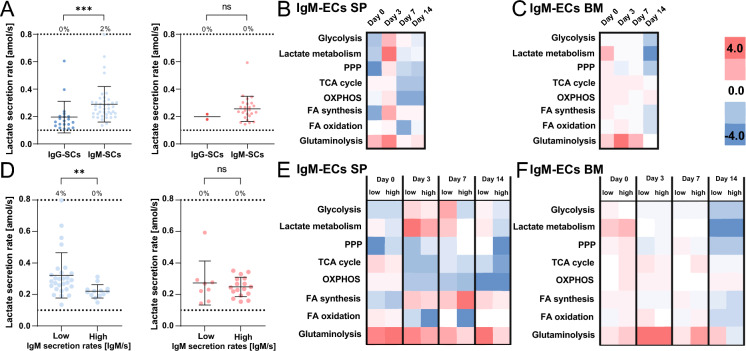
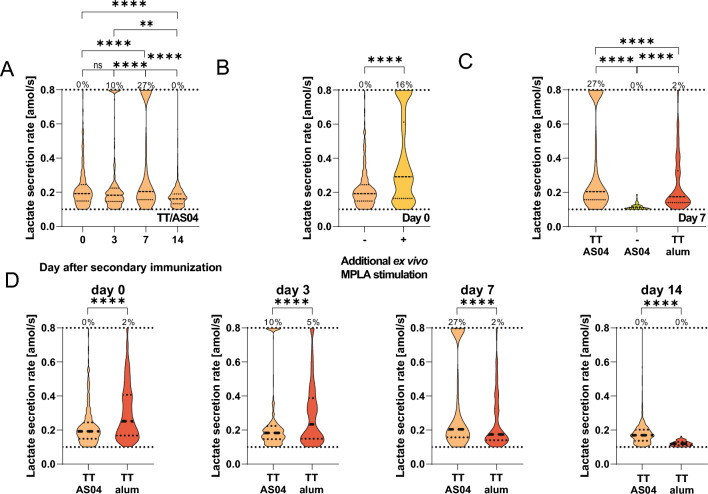
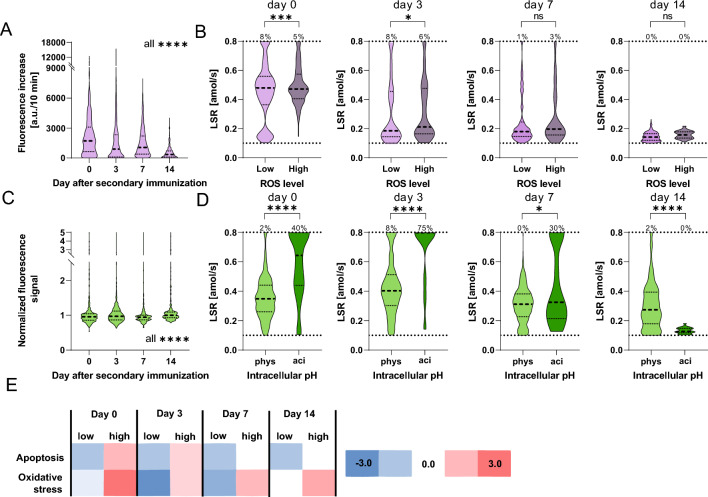
While cellular metabolism was proposed to be a driving factor of the activation and differentiation of B cells and the function of the resulting antibody-secreting cells (ASCs), the study of correlations between cellular metabolism and functionalities has been difficult due to the absence of technologies enabling the parallel measurement. Herein, we performed single-cell transcriptomics and introduced a direct concurrent functional and metabolic flux quantitation of individual murine B cells. Our transcriptomic data identified lactate metabolism as dynamic in ASCs, but antibody secretion did not correlate with lactate secretion rates (LSRs). Instead, our study of all splenic B cells during an immune response linked increased lactate metabolism with acidic intracellular pH and the upregulation of apoptosis. T cell-dependent responses increased LSRs, and added TLR4 agonists affected the magnitude and boosted LSRhigh B cells in vivo, while resulting in only a few immunoglobulin-G secreting cells (IgG-SCs). Therefore, our observations indicated that LSRhigh cells were not differentiating into IgG-SCs, and were rather removed due to apoptosis.

Keywords: Antibody secretion; Apoptosis; B cell differentiation; Cellular survival; Metabolic flux; Multilevel analysis; Single-cell analysis.


Conflict of interest statement

The authors declare no competing interests.

Figures

Figure 1
Figure 1
Summary of the induced immune response. (A) Employed immunization scheme and days of analysis. (B) Schematic representation of the bioassays to assess IgG secretion and affinity. The IgG secretion and affinity bioassay was a relocation sandwich immunoassay consisting of paramagnetic nanoparticles that form an elongated object in a magnetic field. Fluorescence images of the bioassays after 50 min are shown. Scale bar 50 μm. (C) Frequency of IgG-SCs (4 mice with measurements in the presence and the absence of the lactate assay, i.e., nmeasurements = 8, Grubb's test was used to identify outliers). Cells with an IgG secretion rate equal or above the LoD (≥ 3 IgG/s) were defined as IgG-SCs. (D) The distribution of IgG secretion rates of IgG-SCs in the spleen (blue, left) and bone marrow (red, right) during the immune response. Data from four mice were pooled for the respective anatomical compartment and day (ncells = 187, 46, 96, and 82 in the spleen on days 0–14, ncells = 35, 37, 140, and 133 in the bone marrow on days 0–14). The percentage above the dotted line indicated the frequency of cells with an IgG secretion rate equal or above the assay's quantitative range (≥ 375 IgG/s). (E) The distribution of affinity slopes of IgG-SCs in the spleen (blue, left) and bone marrow (red, right) during the immune response. Data from four mice were pooled for the respective anatomical compartment and day (ncells = 85, 40, 56, and 74 in the spleen on days 0–14, ncells = 28, 30, 140, and 120 in the bone marrow on days 0–14). (F,G) Analysis of gene expression changes of DEGs (average log twofold change) of selected metabolic pathways in IgG-ECs of the (E) spleen and (F) bone marrow on days 0, 3, 7, and 14. For the gene markers used to identify IgG-ECs, please refer to SITable 1. Cells from two mice were pooled in a ratio of 1:1 prior to scRNA-Seq, and sequences in the range of 800–5′500 cells were analyzed. Legend: pentose phosphate pathway (PPP), tricarboxylic acid (TCA) cycle, oxidative phosphorylation (OXPHOS), fatty acid (FA) synthesis, and FA β-oxidation (FA oxidation). For definition of glycolysis, lactate metabolism and TCA cycle see SIFigure 3. The level of statistical significance is denoted as *p < 0.05, **p < 0.01, ***p < 0.001 and ****p < 0.0001. Panel B was created with BioRender.com.
Figure 2
Figure 2
Lactate bioassay and cellular measurements. (A) Schematic representation of the bioassay to assess lactate secretion. The lactate assay consisted of an enzymatic kit resulting in a fluorescent product in proportion to the secreted lactate. A fluorescence image of the bioassay after 50 min is shown. Scale bar 50 μm. (B) Example traces from droplets containing an individual B cell (orange, n = 6) and droplets without a cell (black, n = 6) and the corresponding LSRs in [amol/s]. The LoD and cutoff are shown. (C) The secretion rate of 500 randomly selected B cells was obtained from four mice on day 0, whereby 92% of cells displayed a secretion rate within the quantitative range. Every dot represents a cell, the cumulative frequency is shown (orange), and the dotted grey lines represent the LoD and cutoff value. (D) LSRs of IgG-SCs in the spleen (blue, top) and bone marrow (red, bottom) during the immune response. Data from four mice were pooled for the respective anatomical compartment and day. The percentage above the dotted line indicated the frequency of cells with a LSR equal or above the assay's quantitative range. ncells in the distributions in (D) are between 13 and 51 in the spleen and 2 to 23 in the bone marrow. The level of statistical significance is denoted as *p < 0.05, **p < 0.01, ***p < 0.001 and ****p < 0.0001. Panel A was created with BioRender.com.
Figure 3
Figure 3
Comparison of the most relevant metabolic pathways and how their activity changed during the immune response based on gene expression changes of DEGs (average log twofold change) in IgG-ECs exhibiting low and high expression levels of IGHG in the (A) spleen and (B) bone marrow. IgG-ECs were categorized based on their IGHG expression level (threshold log2 FC 1), whereby 800–5′500 cells were analyzed.
Figure 4
Figure 4
(A) Comparison of LSRs of IgG- and IgM-SCs of the spleen (blue, left, ncells = 20 and 41, respectively) and bone marrow (red, right ncells = 2 and 25, respectively). LSRs of individual cells, represented by a dot, are displayed. The percentage above the dotted line indicated the frequency of cells with a LSR equal or above the assay’s quantitative range (ncells = 20 IgG-SCs, 41 IgM-SCs for spleen, ncells = 2 IgG-SCs, 25 IgM-SCs for bone marrow). (B,C) Comparison of metabolic pathways activities of IgM-ECs of the (b) spleen and (C) bone marrow during the immune response. (D) Distribution of the LSRs between IgMlow- and IgMhigh-SCs in the spleen (blue, left) and bone marrow (red, right). IgM-SCs were divided based on their IgM secretion rate (threshold 100 IgM/s, ncells = 28 high, 13 low for spleen, ncells = 8 high, 17 low for bone marrow). (E,F) Comparison of metabolic pathways activities between IgMlow- and IgMhigh-ECs of the (E) spleen and (f) bone marrow. IgM-ECs were divided based on their IGHM expression level (threshold log2 FC 1). The level of statistical significance is denoted as *p < 0.05, **p < 0.01, ***p < 0.001 and ****p < 0.0001. Scale bars for B, C, E, and F are displayed in the figure.
Figure 5
Figure 5
(A) Distribution of LSRs of all splenic B cells encapsulated during the measurements after immunization with TT/AS04. The secretion rate of 500 randomly selected B cells was obtained from four mice per day. The frequency above the dotted line indicated the frequency of cells with a LSR equal or above the assay’s quantitative range. (B) Ex vivo stimulation of splenic B cells harvested on day 0 with MPLA (1 μg per 1 × 106 cells/mL, 37 °C, 4 h) resulted in a significant shift to higher LSRs (-: untreated cells, + : stimulated cells). The LSRs of 500 randomly selected B cells obtained from four mice per condition are displayed, whereby the untreated cells are identical to the cells displayed in Fig. 5A, day 0. (C) Comparison of LSRs of splenic B cells on day 7 after two immunizations with TT/AS04 (from Fig. 5A), AS04 (i.e., without antigen), and TT/alum (i.e., without MPLA). A total of 500 B cells were randomly selected per condition for comparison. (D) The distributions of LSRs from splenic B cells induced by immunization with TT/AS04 (from Fig. 5A) or TT/alum were significantly different over the observed timespan of the immune response. While TT/alum resulted in a distribution of secretion rates spanning the quantitative spectrum, TT/AS04 resulted in two populations, one with moderate and one with secretion rates ≥ 0.8 amol/s. The level of statistical significance is denoted as *p < 0.05, **p < 0.01, ***p < 0.001 and ****p < 0.0001.
Figure 6
Figure 6
(A) Distribution of the increases in cellular fluorescence intensities, which served as an indicator of the cellular ROS production level of splenic B cells during the immune response (in purple). A random selection of 125 cells per mouse (4 mice) was pooled, and the distributions were significantly different from each other on all days (p < 0.0001). (B) Comparison of LSR distributions of the same cells categorized into ROSlow and ROShigh. The frequency above the dotted line indicated the frequency of cells with a LSR equal or above the assay's quantitative range. (C) Distribution of the normalized fluorescence signal of splenic B cells indicating the pHi throughout the immune response (in green). A random selection of 125 cells per mouse (3 mice) was pooled, and the distributions were significantly different from each other on all days (p < 0.0001). (D) The cells were categorized according to their pHi into cells with physiological (phys) or acidic (aci) pHi, and their distributions of LSRs were compared. The number above the dotted line indicated the frequency of cells with a LSR equal or above the quantitative range on the respective day. (E) Correlation between lactate metabolism and expression level of genes associated with apoptosis and oxidative stress in splenic B cells throughout the immune response. Cells were categorized according to lactate dehydrogenase (LDH) encoding gene expression into ‘low’ and ‘high’. The level of statistical significance is denoted as *p < 0.05, **p < 0.01, ***p < 0.001 and ****p < 0.0001.

Similar articles

Cited by

References

    1. Ruprecht CR, Lanzavecchia A. Toll-like receptor stimulation as a third signal required for activation of human naive B cells. Eur. J. Immunol. 2006;36(4):810–816. - PubMed
    1. Akkaya M, et al. Second signals rescue B cells from activation-induced mitochondrial dysfunction and death. Nat. Immunol. 2018;19(8):871–884. - PMC - PubMed
    1. Elgueta R, et al. Molecular mechanism and function of CD40/CD40L engagement in the immune system. Immunol. Rev. 2009;229(1):152–172. - PMC - PubMed
    1. Pone EJ, et al. BCR-signalling synergizes with TLR-signalling for induction of AID and immunoglobulin class-switching through the non-canonical NF-kappaB pathway. Nat. Commun. 2012;3:767. - PMC - PubMed
    1. Lam JH, Baumgarth N. Toll-like receptor mediated inflammation directs B cells towards protective antiviral extrafollicular responses. Nat. Commun. 2023;14(1):3979. - PMC - PubMed

LinkOut - more resources