. 2024 Apr 11;15(1):3140.
doi: 10.1038/s41467-024-47454-7.

Spatiotemporal immune atlas of a clinical-grade gene-edited pig-to-human kidney xenotransplant

Affiliations

Spatiotemporal immune atlas of a clinical-grade gene-edited pig-to-human kidney xenotransplant

Matthew D Cheung et al. Nat Commun. .

Abstract

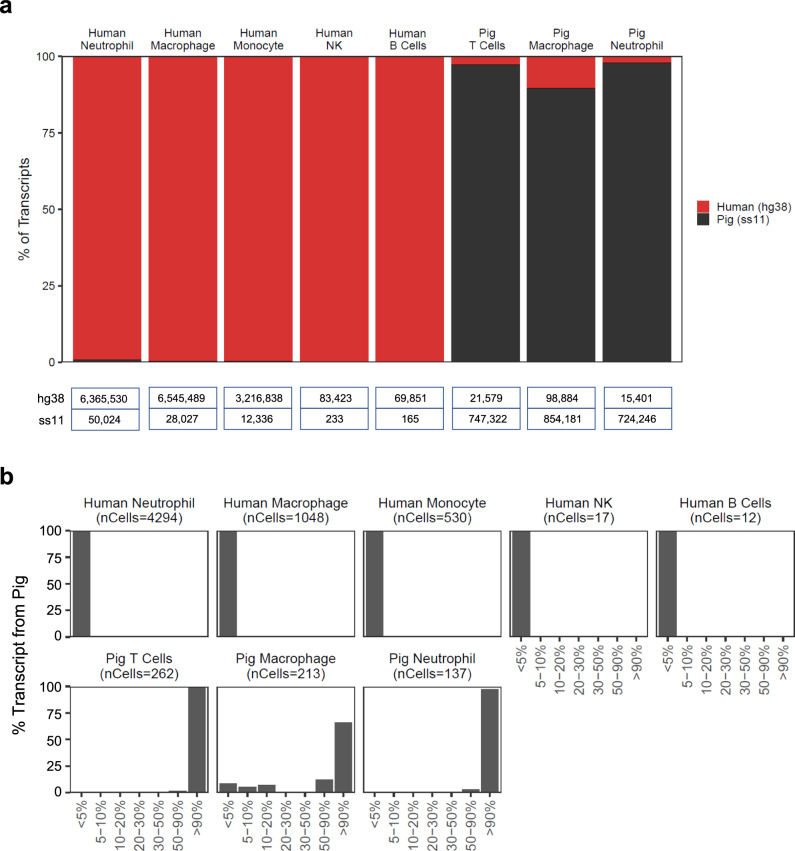
Pig-to-human xenotransplantation is rapidly approaching the clinical arena; however, it is unclear which immunomodulatory regimens will effectively control human immune responses to pig xenografts. Here, we transplant a gene-edited pig kidney into a brain-dead human recipient on pharmacologic immunosuppression and study the human immune response to the xenograft using spatial transcriptomics and single-cell RNA sequencing. Human immune cells are uncommon in the porcine kidney cortex early after xenotransplantation and consist of primarily myeloid cells. Both the porcine resident macrophages and human infiltrating macrophages express genes consistent with an alternatively activated, anti-inflammatory phenotype. No significant infiltration of human B or T cells into the porcine kidney xenograft is detectable. Altogether, these findings provide proof of concept that conventional pharmacologic immunosuppression may be able to restrict infiltration of human immune cells into the xenograft early after compatible pig-to-human kidney xenotransplantation.


Conflict of interest statement

The following authors receive or have received salary support from a research grant from United Therapeutics: R.A., E.D.W., C.F.F., D.E., B.J.O., M.B., G.B., J.P., R.R., S.C.L., A.F.R., J.E.L., and P.M.P. The remaining authors declare no competing interests.

Figures

Fig. 1
Fig. 1. Composition of CD45+ immune cells collected from the porcine xenograft explant.
The 10-GE porcine xenografts were removed from the brain-dead human recipient three days after xenotransplantation, and single-cell RNA-sequencing was performed on FACS-enriched immune cells from the right xenograft using pig- and human-specific CD45+ antibodies. Data were aligned to the hybrid human-porcine reference genome. a&b) UMAP of sorted CD45+ cells (n = 6513 cells) colored by cell type (a) and species (b). c, d Enumeration of sequenced human and porcine immune cells. e Expression of select marker genes in human and pig immune cell clusters.
Fig. 2
Fig. 2. Assessment of species mapping at the individual transcript and cellular levels.
Single-cell RNA-sequencing was performed on FACS-enriched immune cells from the xenograft explant as in Fig. 1. Data were aligned to the hybrid human-porcine reference genome. a Species origin of all transcripts for a given immune cell cluster. Table at the bottom enumerates the transcript number for each cluster that mapped to the hg38 (human) or ss11 (pig) portion of the hybrid reference genome. Additional details of pig macrophage transcripts mapping to the hg38 component of the porcine-human hybrid reference genome are given in Supplementary Fig. 4. b The frequency of cells that have low or high levels of transcripts derived from the pig.
Fig. 3
Fig. 3. No detection of human T or B lymphocytes in the porcine kidney xenografts.
Spatial transcriptomics was performed on serial needle core biopsies of 10-GE porcine kidneys before and after transplantation into a brain-dead human recipient. Biopsies were obtained from either the right (pre-transplant and day 3 samples) or left (day 1 and day 3T) xenografts. Cell type signatures were identified from reference transcriptomes using cell2location (for Pig T cells, top plots in 3a) or expression of individual marker genes (e.g. CD3E and CD19) for adaptive immune cell types that were not well represented in CD45+ immune cells sorted from the xenograft explants (see Fig. 1) and were therefore not included in the reference transcriptomes passed to cell2location. a No detection of human T cell genes in xenograft biopsies at any time point (left) with quantification of gene expression levels (right). Pig T cells were readily detectable in the xenograft (top row). b Calculated total (left) and normalized (right) cell abundance for various pig T cells in the indicated biopsies. Note that cell abundance for human T cells was imputed from expression of hg38-CD3E, ss11-CD19, and hg38-CD19 genes as shown (a). c No detection of human B cell genes in xenograft biopsies at any time point (left) with quantification of gene expression levels (right). Pre-tx pre-transplant. day 3T biopsy was taken on post-transplant day 3 at study termination.
Fig. 4
Fig. 4. Limited infiltration of the porcine kidney xenograft by human myeloid immune cells.
Spatial transcriptomics was performed on serial needle core biopsies of 10-GE porcine kidneys before and after transplantation into a brain-dead human recipient. Biopsies were obtained from either the right (pre-transplant and day 3 samples) or left (day 1 and day 3T) xenografts. Cell type signatures were identified from reference transcriptomes using cell2location. a Human myeloid cells are detected in biopsies of the porcine kidney xenograft three days after transplantation. Capture spot color corresponds to cell abundance, and color scales to the right of each spatial plot indicate cell abundance. Note that scaling is conserved across time for a given cell type but differs between macrophages (cell abundance range: 0–2) and neutrophils (cell abundance range: 0–1). Visualization of cell abundance in a given capture spot is thus capped at 1 or 2 cells. b Calculated total (left) and normalized (right) cell abundance for various immune cell types in the indicated biopsies. For clarity, quantification of B cells is not shown. c Tissue zones and spatial co-localization of immune and kidney parenchymal cells were determined using the non-negative matrix factorization (NMF) of the deconvolution output in cell2location. The dot plot represents relative NMF weights of detected cell types (rows) across NMF “facts” (NMF factor) that correspond to cellular compartments/zones. Co-localized cell types can be found within each respective NMF compartment/zone. Of note, the size of the day 1 biopsy (<200 capture spots) did not permit co-localization analysis. The dot color and size is a representation of the proportion of cells of each respective cell type. Pre-tx pre-transplant. Day 3T biopsy was taken on post-transplant day 3 at study termination.
Fig. 5
Fig. 5. Predominance of M2-like macrophages in the porcine kidney xenograft.
scRNA-seq was performed on CD45+ immune cells sorted from the right porcine kidney xenograft at explant (see Supplementary Fig. 3), and macrophage clusters were selected for analysis. a Expression of M1 (red) and M2 (blue) genes in human and pig macrophages (see Supplementary Dataset 1 and ref. for full gene list). b Expanded view of top 50 most highly expressed M1 and M2 genes in each species. Note M2 > M1 genes for both species. c Composite gene expression score of pig and human macrophages of M1-like pro-inflammatory (red) and M2-like anti-inflammatory (blue) gene signatures. UMAPs were generated from re-clustering of macrophage clusters selected from Supplementary Fig. 3. d Expression of select anti- and pro-inflammatory cytokine genes in pig and human macrophages. Average gene expression is visualized such that the mean of the scaled expression dataset is set at 0 with a standard deviation of 1. ss11-IL6 was not detected.

Update of

References

    1. Wolfe RA, et al. Comparison of mortality in all patients on dialysis, patients on dialysis awaiting transplantation, and recipients of a first cadaveric transplant. N. Engl. J. Med. 1999;341:1725–1730. doi: 10.1056/NEJM199912023412303. - DOI - PubMed
    1. United States Renal Data System. 2020 USRDS Annual Data Report: Epidemiology of Kidney Disease in the United States. (National Institutes of Health, National Institute of Diabetes and Digestive and Kidney Diseases, Bethesda, MD, 2020).
    1. Porrett PM, et al. First clinical-grade porcine kidney xenotransplant using a human decedent model. Am. J. Transplant. 2022;22:1037–1053. doi: 10.1111/ajt.16930. - DOI - PubMed
    1. Montgomery RA, et al. Results of two cases of pig-to-human kidney xenotransplantation. N. Engl. J. Med. 2022;386:1889–1898. doi: 10.1056/NEJMoa2120238. - DOI - PubMed
    1. Griffith BP, et al. Genetically modified porcine-to-human cardiac xenotransplantation. N. Engl. J. Med. 2022;387:35–44. doi: 10.1056/NEJMoa2201422. - DOI - PMC - PubMed