. 2024 May;21(5):809-813.
doi: 10.1038/s41592-024-02237-2. Epub 2024 Apr 11.

brainlife.io: a decentralized and open-source cloud platform to support neuroscience research

Soichi Hayashi #  1 Bradley A Caron #  1   2 Anibal Sólon Heinsfeld  2 Sophia Vinci-Booher  1   3 Brent McPherson  1   4 Daniel N Bullock  1 Giulia Bertò  2 Guiomar Niso  1   5 Sandra Hanekamp  2 Daniel Levitas  1   2 Kimberly Ray  2 Anne MacKenzie  2 Paolo Avesani  6 Lindsey Kitchell  1   7 Josiah K Leong  1   8 Filipi Nascimento-Silva  1 Serge Koudoro  1 Hanna Willis  9 Jasleen K Jolly  10 Derek Pisner  2 Taylor R Zuidema  1 Jan W Kurzawski  11 Kyriaki Mikellidou  12   13 Aurore Bussalb  14 Maximilien Chaumon  14 Nathalie George  14 Christopher Rorden  15 Conner Victory  16 Dheeraj Bhatia  2 Dogu Baran Aydogan  17   18 Fang-Cheng F Yeh  19 Franco Delogu  16 Javier Guaje  1 Jelle Veraart  11 Jeremy Fischer  1 Joshua Faskowitz  1 Ricardo Fabrega  1 David Hunt  1 Shawn McKee  20 Shawn T Brown  21 Stephanie Heyman  22 Vittorio Iacovella  23 Amanda F Mejia  1 Daniele Marinazzo  24 R Cameron Craddock  2 Emanuale Olivetti  23 Jamie L Hanson  19 Eleftherios Garyfallidis  1 Dan Stanzione  2 James Carson  2 Robert Henschel  1 David Y Hancock  1 Craig A Stewart  1 David Schnyer  2 Damian O Eke  25 Russell A Poldrack  26 Steffen Bollmann  27 Ashley Stewart  27 Holly Bridge  9 Ilaria Sani  28   29 Winrich A Freiwald  28 Aina Puce  1 Nicholas L Port  1 Franco Pestilli  30   31
Affiliations

brainlife.io: a decentralized and open-source cloud platform to support neuroscience research

Soichi Hayashi et al. Nat Methods. 2024 May.

Erratum in

  • Author Correction: brainlife.io: a decentralized and open-source cloud platform to support neuroscience research.
    Hayashi S, Caron BA, Heinsfeld AS, Vinci-Booher S, McPherson B, Bullock DN, Bertò G, Niso G, Hanekamp S, Levitas D, Ray K, MacKenzie A, Avesani P, Kitchell L, Leong JK, Nascimento-Silva F, Koudoro S, Willis H, Jolly JK, Pisner D, Zuidema TR, Kurzawski JW, Mikellidou K, Bussalb A, Chaumon M, George N, Rorden C, Victory C, Bhatia D, Aydogan DB, Yeh FF, Delogu F, Guaje J, Veraart J, Fischer J, Faskowitz J, Fabrega R, Hunt D, McKee S, Brown ST, Heyman S, Iacovella V, Mejia AF, Marinazzo D, Craddock RC, Olivetti E, Hanson JL, Garyfallidis E, Stanzione D, Carson J, Henschel R, Hancock DY, Stewart CA, Schnyer D, Eke DO, Poldrack RA, Bollmann S, Stewart A, Bridge H, Sani I, Freiwald WA, Puce A, Port NL, Pestilli F. Hayashi S, et al. Nat Methods. 2024 Jun;21(6):1131. doi: 10.1038/s41592-024-02296-5. Nat Methods. 2024. PMID: 38714873 Free PMC article. No abstract available.

Abstract

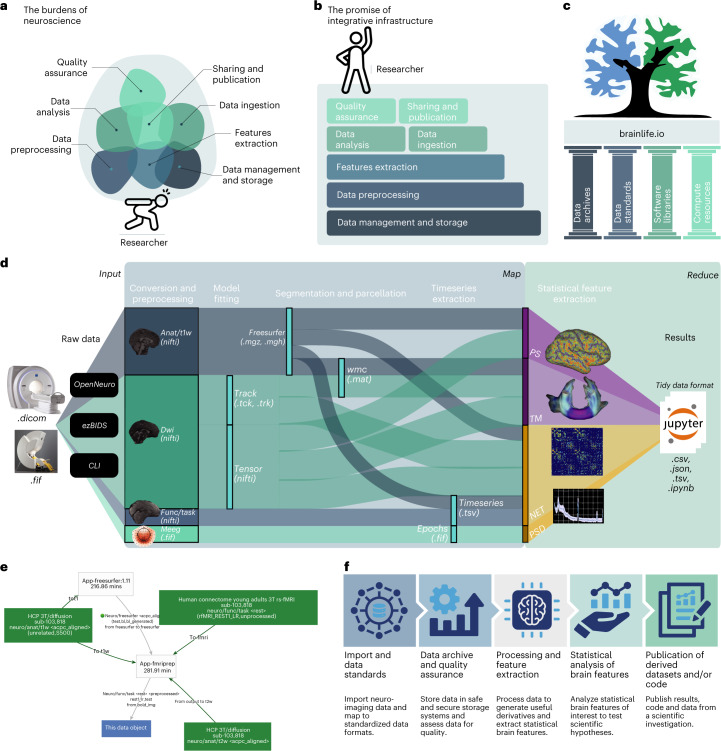
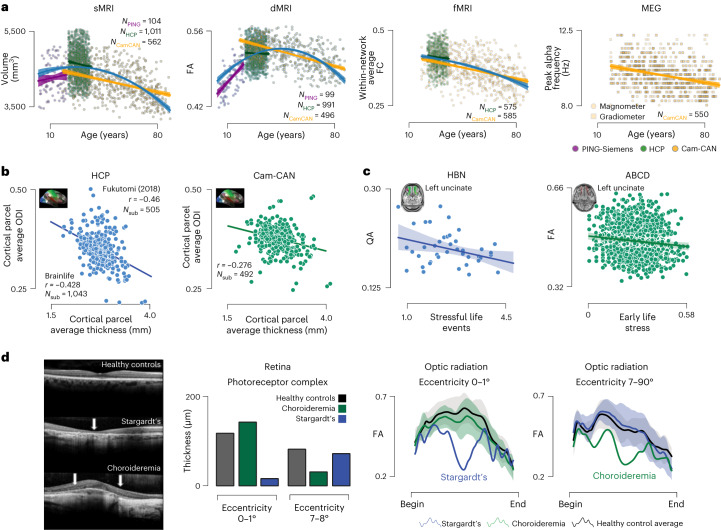
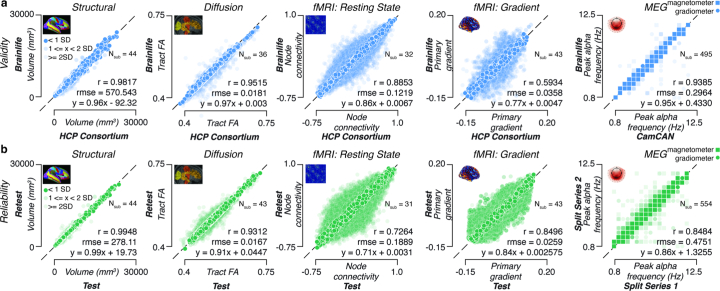
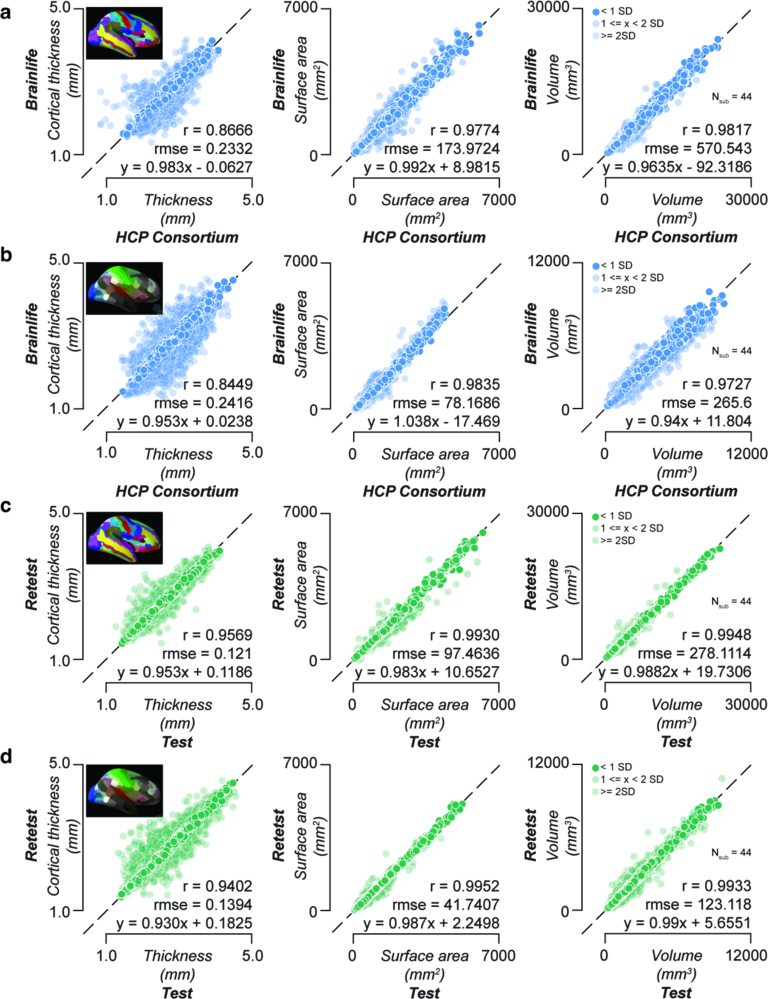
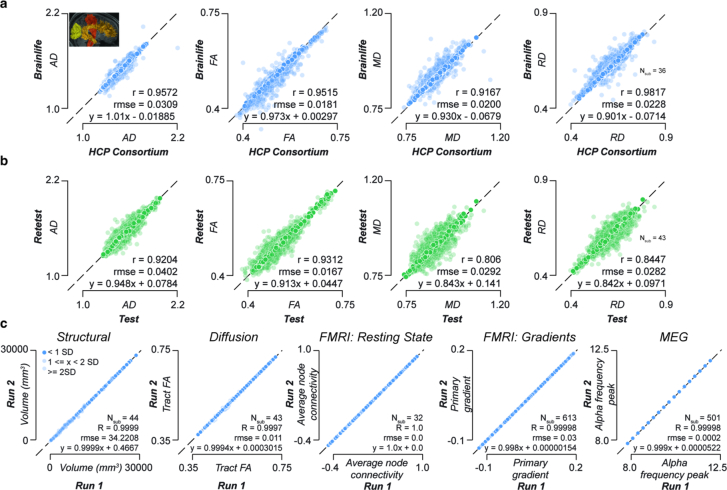
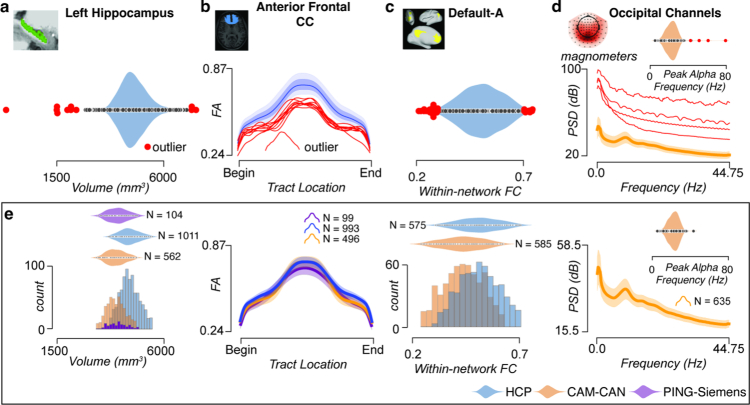
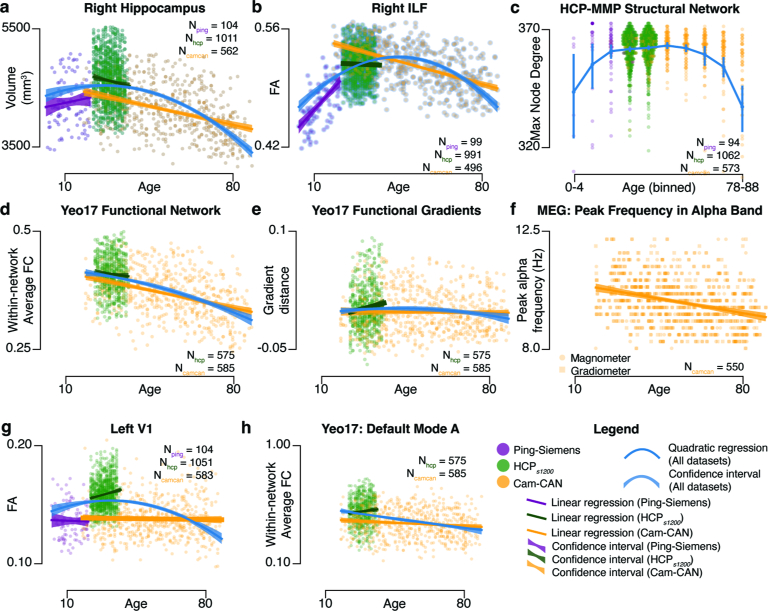
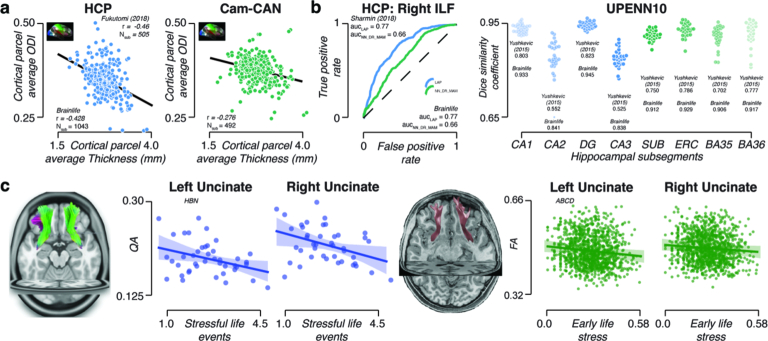
Neuroscience is advancing standardization and tool development to support rigor and transparency. Consequently, data pipeline complexity has increased, hindering FAIR (findable, accessible, interoperable and reusable) access. brainlife.io was developed to democratize neuroimaging research. The platform provides data standardization, management, visualization and processing and automatically tracks the provenance history of thousands of data objects. Here, brainlife.io is described and evaluated for validity, reliability, reproducibility, replicability and scientific utility using four data modalities and 3,200 participants.


Conflict of interest statement

F.P. received a Microsoft Faculty Fellowship, and Microsoft Azure sells Cloud Services. S.T.B. works for Hewlett-Packard Enterprise, which sells computing services. A.D.B. is an employee of BioSerenity, a company that develops medical devices to help diagnose and monitor patients with chronic diseases. S.H. is an employee of SHEGEL SPRL/BVBA a legal firm with expertise in data protection law. The other authors declare no competing interests.

Figures

Fig. 1
Fig. 1. The burdens of neuroscience and the promise of integrative infrastructure.
a, A figurative representation of the current major burdens of performing neuroimaging investigations. b, Our proposal for integrative infrastructure that coordinates services required to perform FAIR, reproducible, rigorous and transparent neuroimaging research thereby lifting the burden from the researcher. c, brainlife.io rests on the foundational pillars of the open science community such as data archives, standards, software libraries and compute resources. d, brainlife.io’s Map step takes MRI, MEG and EEG data and processes them to extract statistical features of interest. brainlife.io’s reduce step takes the extracted features and serves them to Jupyter Notebooks for statistical analysis. PS, parc-stats datatype; TM, tractmeasures datatype; NET, network datatype and CLI, common line interface. e, The brainlife.io technology automates capture of data provenance. All data objects on brainlife.io are stored with a record of the apps, app versions and parameters used to process the data. f, The primary services are provided to the user by brainlife.io. Panels a and b adapted from ref. under a Creative Commons license CC BY 4.0.
Fig. 2
Fig. 2. brainlife.io supports scientific discovery and replication.
a–d, Identifying unique relationships with brain features over the lifespan. a, Relationship between participant age and right hippocampal volume, right inferior longitudinal fasciculus (FA, within-network average functional connectivity (FC) derived using the Yeo17 atlas and peak frequency in the alpha band derived from magnetometer (squares) and gradiometers (circles) from MEG data. These analyses include participants from the PING (purple), HCP1200 (green) and Cam-CAN (yellow) datasets. Linear regressions were fitted to each dataset, and a quadratic regression was fitted to the entire dataset (blue). b,c, Replication and generalization of previously reported scientific findings. b, Average cortical hcp-mmp parcel thickness (Nstruc = 322) compared to parcel the ODI from the NODDI model mapped to the cortical surface (inset) of the HCPS1200 dataset (Nsub = 1,043) and Cam-CAN (Nsub = 492) dataset compared to the parcel-average cortical thickness. c, Stressful life events were obtained from the NLES survey from HBN participants (Nsub = 42) compared to uncinate-average normalized quantitative anisotropy (QA). Mean linear regression (blue line) fits and standard deviation (shaded blue). Early life stress was obtained from multiple surveys collected from ABCD participants (Nsub = 1,107) compared to uncinate-average FA. Linear regression (green line) fits the data with standard deviation (shaded green). d, Identification of clinical biomarkers. d, Retinal optical coherence tomography images from healthy controls (top row), patients with Stargardt’s disease (middle row) and patients with Choroideremia (bottom row). From these images, photoreceptor complex thickness was measured for each group (controls, gray; Choroideremia, green; Stargardt’s, blue) in two distinct areas of the retina: the fovea (eccentricities 0–1°) and periphery (eccentricities 7–8°). In addition, optic radiations carrying information for each retinal area were segmented and FA profiles were mapped. Average profiles with standard error (shaded regions) were computed. One participant with Stargardt and one with Choroideremia were identified each having FA profiles that deviated from healthy controls.
Extended Data Fig. 1
Extended Data Fig. 1. Platform Architecture.
a. Map of the locations of critical hubs for brainlife.io. b. Map the locations of critical facets of this research, including project infrastructure (that is compute resources), collaborators, and data sources. As the United States and Europe are home to many of the infrastructural resources, collaborators, and data sources, more details for these regions are provided (insets). c. brainlife.io’s Amaretti links data archives, software libraries, and computing resources. Specifically, ‘Apps’ (containerized services defined on GitHub.com) are automatically matched with data stored in the ‘Warehouse’ with computing resources. Statistical analyses can be implemented using Jupyter Notebooks. d. brainlife.io provides efficient docking between data archives, processing apps, and compute resources via a centralized service. e. Apps use standardized Datatypes and allow ‘smart docking’ only with compatible data objects. App outputs can be docked by other Apps for further processing.
Extended Data Fig. 2
Extended Data Fig. 2. Platform Usage.
a. Top left. Number of users submitting more than 10 jobs per month. Top middle. Number of projects over time. Top right. Number of Apps over time. Bottom left. Data storage across all Projects. Bottom middle. Compute hours across all Projects (data only available 6 months post project start). Bottom right. Lines of code in the top 50 most-used Apps. b. Top left. User communities. Top right. App categories. Bottom left. Percent of total jobs launched with the software library installed (percentage for jobs of top 50 most-used Apps). Bottom right. Datasets sources. c. Map of the locations of the users that created an account and accessed brainlife.io. This map is a proxy to the level of attention the platform achieved worldwide.
Extended Data Fig. 3
Extended Data Fig. 3. Data processing validity and reliability analysis.
Top row (a): Validity measures derived using the HCP Test-Retest (HCPTR) data. Each dot corresponds to the ratio for a given subject between data preprocessed and provided by the HCP Consortium vs data preprocessed on brainlife.io in a given measure for a given structure. Pearson’s correlation (r), root mean squared error (rmse), and a linear fit between the test and retest results were calculated. Parcel volume (mm3). Tract-average fractional anisotropy (FA). Node-wise functional connectivity (FC)*. Primary gradient value derived from resting-state fMRI*. Peak frequency (Hz) in the alpha band derived from MEG. Data from magnetometer sensors are represented as squares, and data from gradiometer sensors are represented as circles. Dark colors represent data within ±1 standard deviation (SD. 50% opacity represents data within 1-2 SD. 25% opacity represents data outside 2 SD. *A representative 5% of data presented. Bottom row (b): Test-retest reliability measures derived from derivatives of the HCPTR dataset generated using brainlife.io. Each dot corresponds to the ratio between a test-retest subject and a given measure for a given structure. Pearson’s correlation (r), root mean squared error (rmse), and a linear fit between the test and retest results were calculated.Parcel volume (mm3). Tract-average fractional anisotropy (FA). Node-wise functional connectivity (FC)*. Primary gradient value derived from resting-state fMRI*. Peak frequency (Hz) in the alpha band derived from MEG using the Cambridge (Cam-CAN) dataset. Data from magnetometer sensors are represented as squares, and data from gradiometer sensors are represented as circles. Dark colors represent data within ±1 standard deviation (SD. 50% opacity represents data within 1-2 SD. 25% opacity represents data outside 2 SD. *A representative 5% of data presented.
Extended Data Fig. 4
Extended Data Fig. 4. Processing with brainlife.io is valid and test-retest reliability is high - Structural MRI.
Top rows: Validity measures derived using the HCPTR data preprocessed and provided by the HCP Consortium compared to data preprocessed on brainlife.io. Each dot corresponds to the ratio for a given subject between data preprocessed and provided by the HCP Consortium vs data preprocessed on brainlife.io in a given measure for a given structure. Pearson’s correlation (r), root mean squared error (rmse), and a linear fit between the test and retest results were calculated and provided. a. Destrieux Parcel thickness (mm), surface area (mm2), and volume (mm3). b. HCP-mmp Parcel thickness (mm), surface area (mm2), and volume (mm3). Dark colors represent data within ± 1 standard deviation. 50% opacity represents data within 1-2 standard deviations. 25% opacity represents data outside 2 standard deviations. Bottom rows: Test-retest reliability measures derived from derivatives of the HCPTR dataset generated using brainlife.io. Each dot corresponds to the ratio between a test-retest subject and a given measure for a given structure. Pearson’s correlation (r), root mean squared error (rmse), and a linear fit between the test and retest results were calculated and provided. c. Destrieux Parcel thickness (mm), surface area (mm2), and volume (mm3). d. HCP-mmp Parcel thickness (mm), surface area (mm2), and volume (mm3). Dark colors represent data within ± 1 standard deviation. 50% opacity represents data within 1-2 standard deviations. 25% opacity represents data outside 2 standard deviations.
Extended Data Fig. 5
Extended Data Fig. 5. Processing with brainlife.io is valid, reliable, and reproducible.
Top row: Validity measures derived using the HCPTR data preprocessed and provided by the HCP Consortium compared to data preprocessed on brainlife.io. Each dot corresponds to the ratio for a given subject between data preprocessed and provided by the HCP Consortium vs data preprocessed on brainlife.io in a given measure for a given structure. Pearson’s correlation (r), root mean squared error (rmse), and a linear fit between the test and retest results were calculated and provided. v. Tract average AD, FA, MD, and RD. Dark colors represent data within ±1 standard deviation. 50% opacity represents data within 1-2 standard deviations. 25% opacity represents data outside 2 standard deviations. Bottom row: Test-retest reliability measures derived from derivatives of the HCPTR dataset generated using brainlife.io. Each dot corresponds to the ratio between a test-retest subject and a given measure for a given structure. Pearson’s correlation (r), root mean squared error (rmse), and a linear fit between the test and retest results were calculated and provided. w. Tract average AD, FA, MD, and RD. Dark colors represent data within ±1 standard deviation. 50% opacity represents data within 1-2 standard deviations. 25% opacity represents data outside 2 standard deviations. c. Computational reproducibility values derived by repeating runs of brainlife.io Apps using the HCPTR dataset and the CAN dataset. Each dot corresponds to the ratio for a given subject between repeated runs of each App for a given structure. Pearson’s correlation (r), root mean squared error (rmse), and a linear fit between the repeated runs was calculated. Destrieux Atlas Parcels volume (mm3). Tract-average fractional anisotropy (FA). Node-average functional connectivity (FC). Primary gradient values derived from resting state fMRI. Peak alpha frequency (Hz) in the alpha band derived from MEG.
Extended Data Fig. 6
Extended Data Fig. 6. Reference datasets for quality assurance.
Example workflow for building normative reference ranges for multiple derived statistical products (cortical parcel volume, white matter tract profilometry, within-network functional connectivity, and power-spectrum density (PSD)). a. Cortical volumes of the left hippocampus from HCP participants. Red dots indicate outlier data points. b. Average fractional anisotropy (FA) profiles (blue line) plotted with two standard deviations (shaded regions). Red lines indicate outlier profiles. c. Within-network functional connectivity for the nodes within the Default-A network using the Yeo17 atlas. Red dots indicate outlier data points. d. Average PSD from occipital channels using magnetometer sensors from Cam-CAN participants with one standard deviation (shaded regions). Red lines indicate outlier participants. Peak alpha frequency distribution was also computed, and outliers were detected (inset). e. Normative reference distributions for each derived statistical product across the PING (purple), HCP (blue), and Cam-CAN (orange) datasets. These distributions have had outliers removed. An example of the brainlife.io visualization for reference datasets can be found in Fig. S5. Data are presented as mean values ± SEM.
Extended Data Fig. 7
Extended Data Fig. 7. Lifelong brain maturation estimated across datasets.
Relationship between subject age and a. Right hippocampal volume, b. Right inferior longitudinal fasciculus (ILF) fractional anisotropy (FA), c. maximum node degree of density network derived using the hcp-mmp atlas, d*. Within-network average functional connectivity (FC) derived using the Yeo17 atlas, e*. Functional gradient distance for visual resting state network derived from the Yeo17 atlas, and f. Peak frequency in the alpha band derived from magnetometer (squares) and gradiometers (circles) from MEG data. These analyses include subjects from the PING (purple), HCPs1200 (green), and Cam-CAN (yellow) datasets. Linear regressions were fit to each dataset, and a quadratic regression was fit to the entire dataset (blue). * All points in e, and f are presented. See Fig. 2a. Relationship between age of subject and g. Cortical fractional anisotropy (FA) of the left V1, h. Within-network average functional connectivity (FC) from the Yeo17 Default Mode - A network. These analyses include subjects from the PING (purple), HCPs1200 (green), and CAN (yellow) datasets. Linear regressions were fit to each dataset, and a quadratic regression was fit to the entire dataset (blue).
Extended Data Fig. 8
Extended Data Fig. 8. Replication of previous studies using brainlife.io.
a. Average cortical hcp-mmp parcel thickness (Nstruc = 322) compared to parcel orientation dispersion index (ODI) from the NODDI model mapped to the cortical surface (inset) of the HCPS1200 dataset (Nsub = 1,043) and Cam-CAN (Nsub = 492) dataset compared to the parcel-average cortical thickness. b. Receiver operator curves (ROC) comparing the performance of segmentation of the Right ILF using two automated segmentation methods (LAP: blue, NN_DR_MAM: green) in a subset of the HCPS1200 dataset (Nsub = 15). Dice coefficients between manual and automated segmentation of the hippocampus using AHSS method in UPENN dataset. c. Stressful life events obtained from Negative Life Events Schedule (NLES) survey from Healthy Brain Network participants (Nsub = 42) compared to Uncinate-average normalized Quantitative Anisotropy (QA). Mean linear regression (blue line) fits and standard deviation (shaded blue). Early life stress was obtained from multiple surveys collected from ABCD participants (Nsub = 1,107) compared to Uncinate-average Fractional Anisotropy (FA). Linear regression (green line) fits the data with standard deviation (shaded green). See Fig. 2b,c.

Update of

  • brainlife.io: A decentralized and open source cloud platform to support neuroscience research.
    Hayashi S, Caron BA, Heinsfeld AS, Vinci-Booher S, McPherson B, Bullock DN, Bertò G, Niso G, Hanekamp S, Levitas D, Ray K, MacKenzie A, Kitchell L, Leong JK, Nascimento-Silva F, Koudoro S, Willis H, Jolly JK, Pisner D, Zuidema TR, Kurzawski JW, Mikellidou K, Bussalb A, Rorden C, Victory C, Bhatia D, Baran Aydogan D, Yeh FF, Delogu F, Guaje J, Veraart J, Bollman S, Stewart A, Fischer J, Faskowitz J, Chaumon M, Fabrega R, Hunt D, McKee S, Brown ST, Heyman S, Iacovella V, Mejia AF, Marinazzo D, Craddock RC, Olivetti E, Hanson JL, Avesani P, Garyfallidis E, Stanzione D, Carson J, Henschel R, Hancock DY, Stewart CA, Schnyer D, Eke DO, Poldrack RA, George N, Bridge H, Sani I, Freiwald WA, Puce A, Port NL, Pestilli F. Hayashi S, et al. ArXiv [Preprint]. 2023 Aug 11:arXiv:2306.02183v3. ArXiv. 2023. Update in: Nat Methods. 2024 May;21(5):809-813. doi: 10.1038/s41592-024-02237-2. PMID: 37332566 Free PMC article. Updated. Preprint.

References

    1. Poldrack RA, et al. Scanning the horizon: towards transparent and reproducible neuroimaging research. Nat. Rev. Neurosci. 2017;18:115–126. doi: 10.1038/nrn.2016.167. - DOI - PMC - PubMed
    1. Wilkinson MD, et al. The FAIR Guiding Principles for scientific data management and stewardship. Sci. Data. 2016;3:160018. doi: 10.1038/sdata.2016.18. - DOI - PMC - PubMed
    1. Nichols TE, et al. Best practices in data analysis and sharing in neuroimaging using MRI. Nat. Neurosci. 2017;20:299–303. doi: 10.1038/nn.4500. - DOI - PMC - PubMed
    1. Gorgolewski KJ, et al. The Brain Imaging Data Structure, a format for organizing and describing outputs of neuroimaging experiments. Sci. Data. 2016;3:160044. doi: 10.1038/sdata.2016.44. - DOI - PMC - PubMed
    1. Van Essen DC, et al. The Human Connectome Project: a data acquisition perspective. Neuroimage. 2012;62:2222–2231. doi: 10.1016/j.neuroimage.2012.02.018. - DOI - PMC - PubMed

Grants and funding