Observational Study
. 2024 Apr;30(4):990-1000.
doi: 10.1038/s41591-024-02848-4. Epub 2024 Apr 11.

Feasibility of functional precision medicine for guiding treatment of relapsed or refractory pediatric cancers

Affiliations
Observational Study

Feasibility of functional precision medicine for guiding treatment of relapsed or refractory pediatric cancers

Arlet M Acanda De La Rocha et al. Nat Med. 2024 Apr.

Abstract

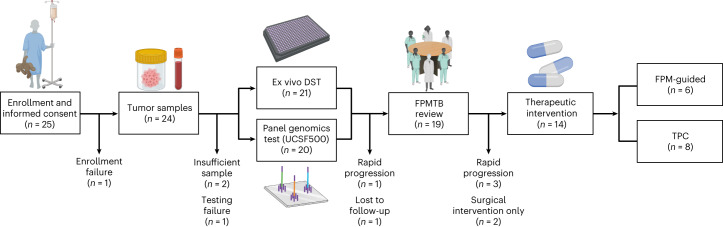
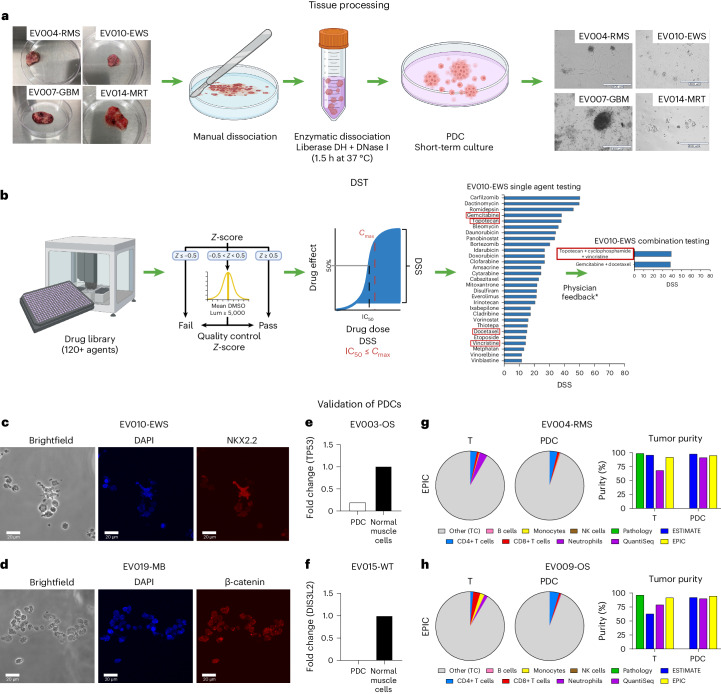
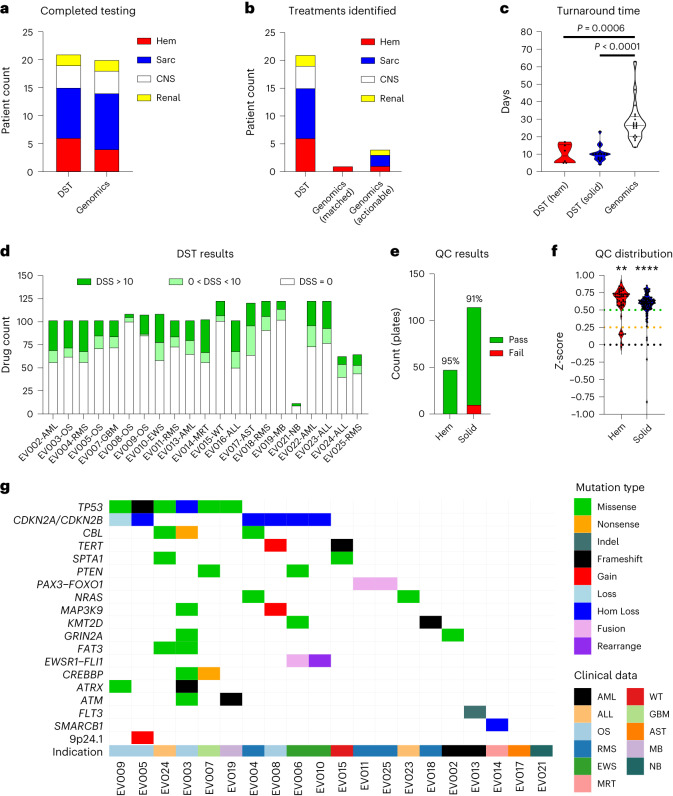
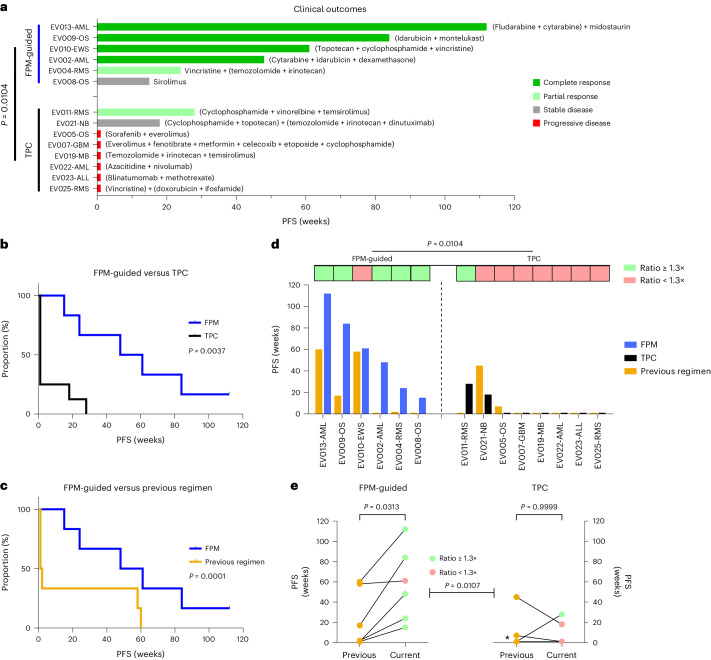
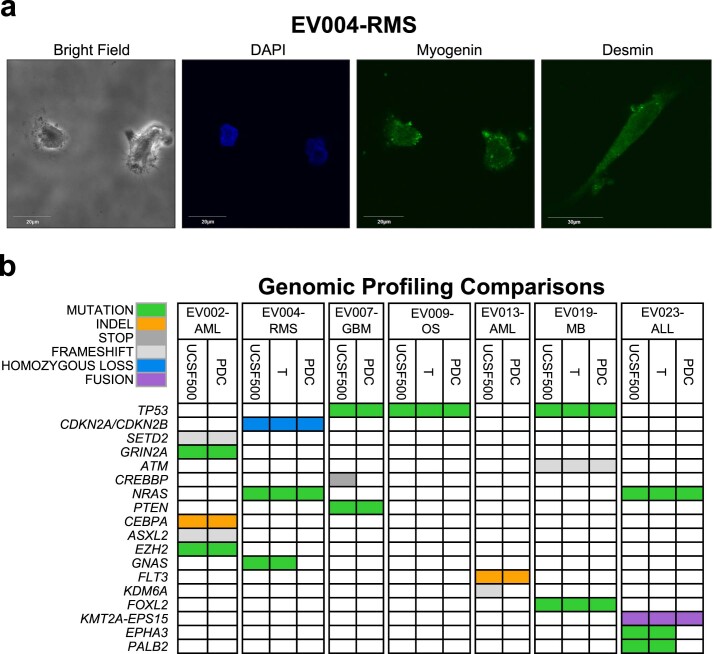
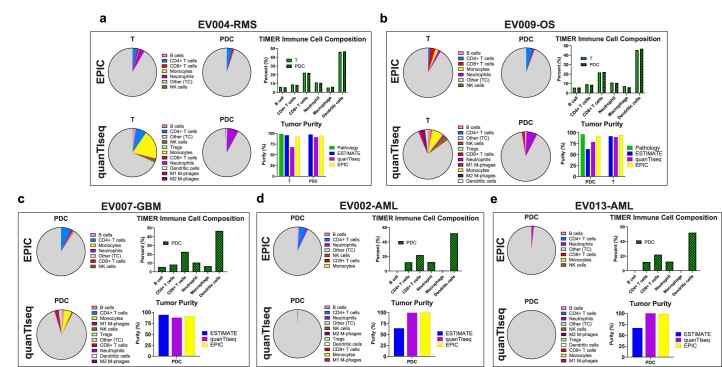
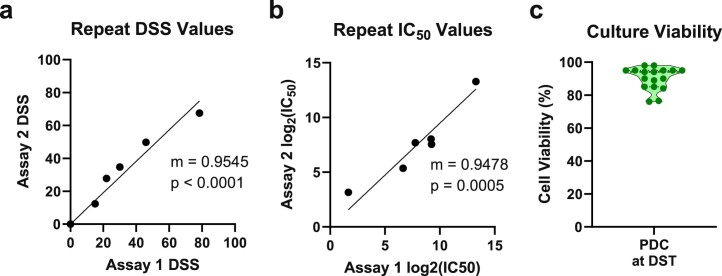
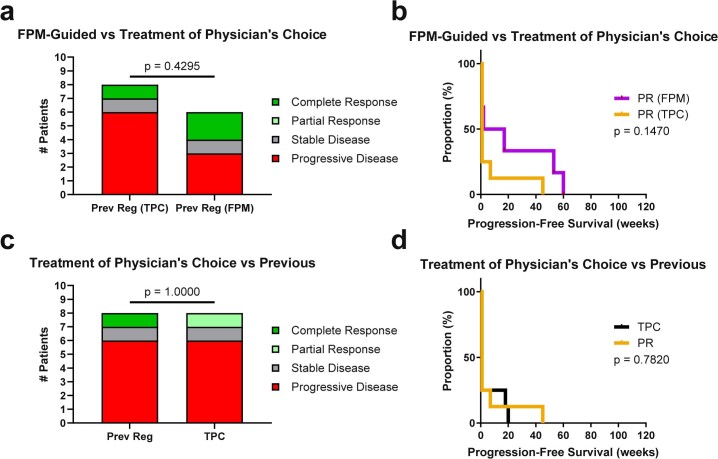
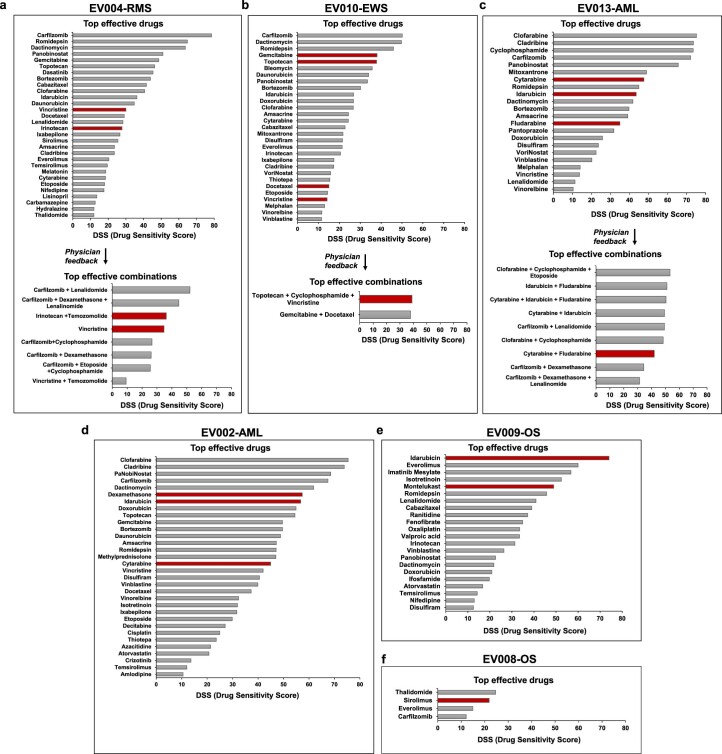
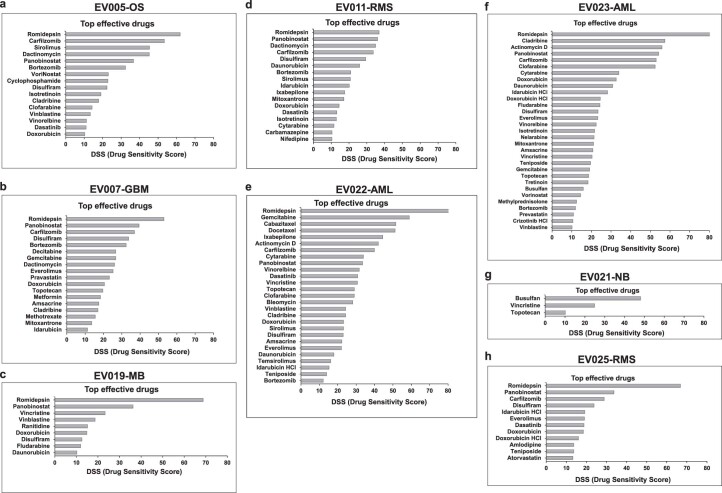
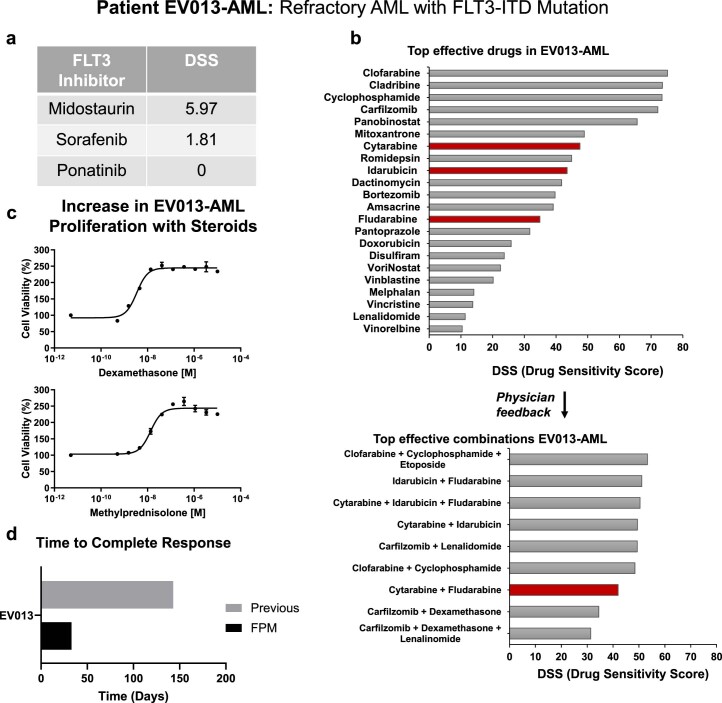
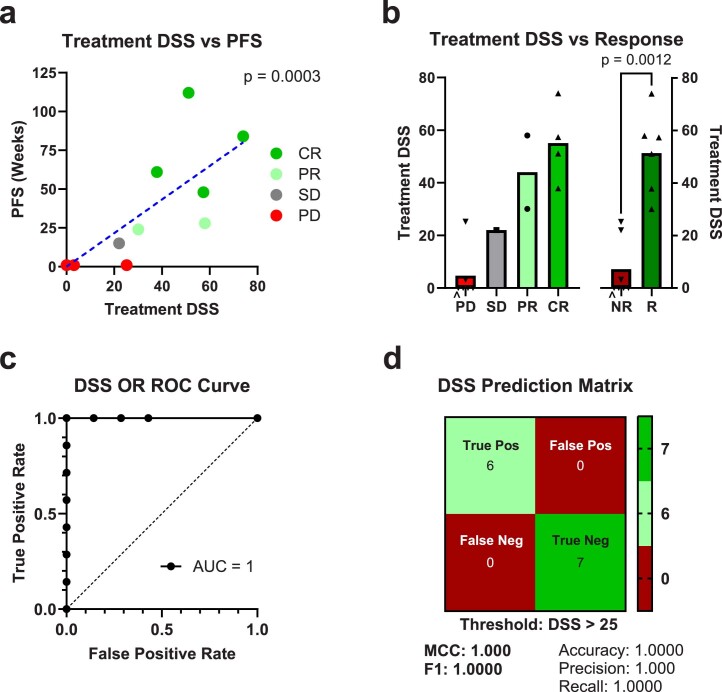
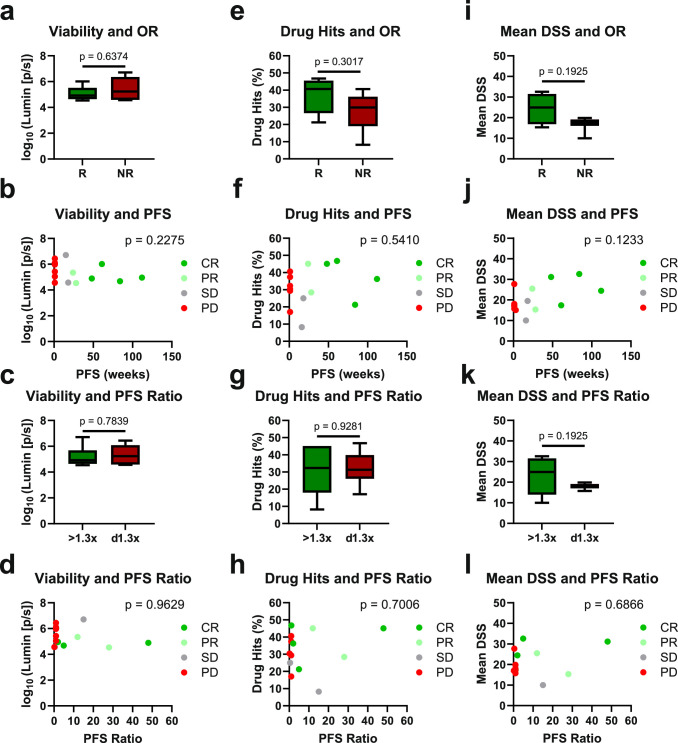
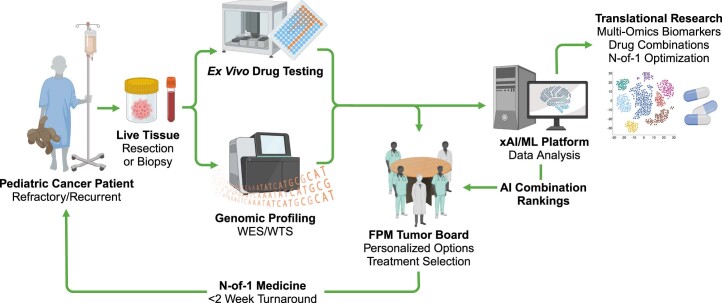
Children with rare, relapsed or refractory cancers often face limited treatment options, and few predictive biomarkers are available that can enable personalized treatment recommendations. The implementation of functional precision medicine (FPM), which combines genomic profiling with drug sensitivity testing (DST) of patient-derived tumor cells, has potential to identify treatment options when standard-of-care is exhausted. The goal of this prospective observational study was to generate FPM data for pediatric patients with relapsed or refractory cancer. The primary objective was to determine the feasibility of returning FPM-based treatment recommendations in real time to the FPM tumor board (FPMTB) within a clinically actionable timeframe (<4 weeks). The secondary objective was to assess clinical outcomes from patients enrolled in the study. Twenty-five patients with relapsed or refractory solid and hematological cancers were enrolled; 21 patients underwent DST and 20 also completed genomic profiling. Median turnaround times for DST and genomics were within 10 days and 27 days, respectively. Treatment recommendations were made for 19 patients (76%), of whom 14 received therapeutic interventions. Six patients received subsequent FPM-guided treatments. Among these patients, five (83%) experienced a greater than 1.3-fold improvement in progression-free survival associated with their FPM-guided therapy relative to their previous therapy, and demonstrated a significant increase in progression-free survival and objective response rate compared to those of eight non-guided patients. The findings from our proof-of-principle study illustrate the potential for FPM to positively impact clinical care for pediatric and adolescent patients with relapsed or refractory cancers and warrant further validation in large prospective studies. ClinicalTrials.gov registration: NCT03860376 .


Conflict of interest statement

N.E.B. is co-founder of and holds shares in First Ascent Biomedical. D.J.A. is co-founder of and holds shares in First Ascent Biomedical. M.F., Z.K., H.A. and O.M.M. are employees of KIDZ Medical Services. The other authors declare no competing interests.

Figures

Fig. 1
Fig. 1. Flow diagram showing FPM workflow.
FPM workflow including patient enrollment, sample collection, functional ex vivo drug sensitivity testing and molecular tumor profiling, and report delivery to the FPMTB for clinical decision-making. Numbers at each exit and endpoint represent patient numbers. Created with BioRender.com.
Fig. 2
Fig. 2. Dissociation of tumor tissue workflow, DST analysis and validation of patient-derived tumor cultures.
a, Tissue processing and derivation of short-term PDCs, including representative images of received tissues (left) and derived PDCs (right) from EV004-RMS, EV007-GBM, EV010-EWS and EV014-MRT. b, Ex vivo DST using a library of more than 125 FDA-approved drugs, post-endpoint quality control process based on Z-prime scores, IC50 and DSS analysis, and representative results from single agent testing for EV010-EWS followed by physician-selected drug combinations (if additional PDC material remained). Lum, luminescence. * indicates physician feedback guided selection of tested drug combinations. The slim red borders around single agents on the left indicate those included in combination testing, The thick red border on the right indicates the final drug combination used for the patient. c,d, Molecular characterization and validations of PDCs assessed by immunofluorescence detection of pathology-defined markers in EV010-EWS (c) and EV019-MB (d). Immunofluorescence images of one independent experiment (due to limited PDC material). e,f, Analysis of RT–qPCR to confirm loss of TP53 transcripts in EV003-OS (e) and DIS3L2 transcripts in EV015-WT (f). g,h, Immune cell type deconvolution and tumor purity analysis from tumor tissue at enrollment (T) and PDC in EV004-RMS (g) and EV009-OS (h) using bulk RNA-seq deconvolution tools EPIC, ESTIMATE and quanTIseq (right panel). Representative pie charts present EPIC deconvolution results. TC, tumor cell. Portions of panels a and b were created with BioRender.com.
Fig. 3
Fig. 3. FPM workflow is feasible and actionable in a clinically relevant timeframe.
a, Results returned from patient sample testing through DST and genomic profiling, distributed by cancer type. CNS, central nervous system; Hem, hematological; Sarc, sarcoma. b, Distribution of patients with reported therapeutic options identified through DST, identified by genomics as an approved therapy matching the patient’s cancer type (Matched) and identified by genomics as an approved therapy in other cancer types (Actionable). c, Distribution of turnaround time in days for DST of hematological cancer samples and solid cancer samples, as well as UCSF500 genomics panel assays. P values determined by adjusted Kruskal–Wallis test (P < 0.0001). d, Distribution of single agent DSS for each patient (ineffective, DSS = 0 (white); moderately effective, 0 < DSS ≤ 10 (light green); effective, DSS > 10 (dark green)). e, Number and percent of DST plates that passed quality control analysis for hematological and solid cancers. QC, quality control. f, Z-prime scores of quality control from DST plates for hematological and solid cancers. P values determined by two-sided one-sample Wilcoxon tests. Hem, P = 0.0045; solid, P = 0.00001. **P < 0.01, ****P < 0.0001. g, Genomic landscape of variants identified through genomic tumor panel profiling using UCSF500. Genes with alterations in two or more patient samples or alterations with matched therapies are reported. Hom, homozygous.
Fig. 4
Fig. 4. FPM-guided therapies provide significant clinical benefit in patients with refractory or relapsed pediatric cancer.
a, Swimmer plot illustrating patient best objective response and PFS to treatments assigned following FPMTB review, grouped by FPM-guided and TPC-treated patients. Agents beside each patient represent treatments given during the study. P value determined by two-sided Barnard’s test. b, Comparison of PFS in the TPC-treated and FPM-guided cohorts. P value determined by logrank test analysis of Kaplan–Meier survival data. c, Comparison between the PFS of the trial regimen and the PFS of the patient’s previous regimen in the FPM-guided cohort. P value is from two-sided Cox proportional hazards test of paired survival data. d, Comparison of PFS from the previous regimen (orange in bar graph) and trial regimens for both FPM-guided (blue in bar graph) and TPC (black in bar graph) cohorts, with indications for patients with a PFS ratio of ≥1.3× (light green boxes above indicated patients) and <1.3× (light red boxes above indicated patients). P value determined by two-sided Barnard’s test analysis of occurrences of PFS ratio of ≥1.3×. e, Difference in PFS of the previous regimens and trial regimens for FPM-guided (left) and TPC-treated (right) cohorts. Asterisk, five patients who received TPC and had the same previous and trial regimen PFS. P values for each cohort determined by two-sided paired Wilcoxon test. P value between cohort determined by two-sided Mann–Whitney U-test of PFS ratio values. Light green dots indicate patients with a PFS ratio of ≥1.3× (top), light red dots indicate patients with a PFS ratio of <1.3×, and orange dots indicate the PFS of the previous regimen for both cohorts.
Extended Data Fig. 1
Extended Data Fig. 1. Immunofluorescence and Genomic Profiling Validation of PDCs.
(a) Immunofluorescence analysis confirming the presence of pathology markers myogenin and desmin in EV004-RMS. Images taken at 90x using a laser scanning confocal microscope (Fluoview FV10i, Olympus) utilizing the FV10 image software. Representative images of one independent experiment due to limited PDC material. (b) Comparison of genomic alterations detected in UCSF500 tumor panel profiling with genomic profiling of original tumor sample at enrollment (T) and PDC at time of DST for EV002-AML, EV004-RMS, EV007-GBM, EV009-OS, EV013-AML, EV019-MB, EV023-ALL. Color code on the left indicates type of variant identified from UCSF500 profiling.
Extended Data Fig. 2
Extended Data Fig. 2. RNA-seq and Tumor Purity Validation of PDCs.
Immune cell type deconvolution and tumor purity analysis was done from original tissue (T) and PDCs (when available). a) Analysis of EV004-RMS. Bulk RNA-seq was deconvoluted using the analysis tools EPIC (Top Left, T and PDC) and quanTIseq (Bottom Left, T and PDC). Immune cell composition (T and PDC) was analyzed using TIMER (Top Right). Tumor purity analysis was done using pathology analysis (T, in green), ESTIMATE (T and PDC, in blue), quanTIseq (T and PDC, in purple), and EPIC (T and PDC, in yellow). A similar approach was used in b) EV009-OS, c) EV007-GBM, d) EV002-AML and e) EV013-AML.
Extended Data Fig. 3
Extended Data Fig. 3. Additional Repeatability and Viability Metrics.
(a) Correlation of DSS values from repeated assays (p = 0.00001). m represents the slope of the linear regression line; p value is from two-sided Pearson correlation analysis. b) Correlation of log2(IC50) values from repeated assays. m represents the slope of the linear regression line; p value is from two-sided Pearson correlation analysis. c) Percent cell viability of the PDCs at the time of DST assay.
Extended Data Fig. 4
Extended Data Fig. 4. Additional Outcome Analysis.
(a) Overall response distributions of therapeutic response prior to study enrollment in TPC cohort and FPM-guided patients. P values from two-sided Barnard’s test comparing ORR. (b) Kaplan-Meier survival curves of previous regimen PFS in TPC and FPM-guided patients. P values from Logrank test analysis of PFS data. (c) OR distributions of previous versus current regimen in TPC cohort. P values from two-sided McNemar’s Paired test comparing ORR. (d) Kaplan-Meier survival curves of the previous versus current regimen PFS in TPC cohort. P values from two-sided Cox Proportional Hazard test analysis of paired PFS data. PR = Previous Regimen, TPC = Treatment of Physician’s Choice, FPM = FPM-guided.
Extended Data Fig. 5
Extended Data Fig. 5. Top effective drugs for FPM-guided patients.
DSS for top effective single agents (top) and top effective physician-requested combinations (bottom), defined as DSS > 10, are shown for (a) EV004-RMS, (b) EV010-EWS, (c) EV013-AML, (d) EV002-AML, (e) EV009-OS, and (f) EV008-OS. Drugs and combinations selected for therapy by treating physician marked in red.
Extended Data Fig. 6
Extended Data Fig. 6. Top effective drugs for TPC patients.
DSS for top effective agents, defined as DSS > 10, are shown for (a) EV005-OS, (b) EV007-GBM, (c) EV019-MB, (d) EV011-RMS, (e) EV022-AML, (f) EV023-ALL, (g) EV021-NB, and (h) EV025-RMS.
Extended Data Fig. 7
Extended Data Fig. 7. Additional data from EV013-AML.
(a) DSS from clinically available FLT3 inhibitors (b) Top effective single agent drugs (top) followed by physician-selected drug combinations (bottom) (c) Dose-response from steroid agents tested in EV013-AML-derived cells. (n = 1 due to limited PDC material). Data is presented as mean cell viability values +/− SEM. (d) Comparison of time to complete response following previous and FPM-guided regimens.
Extended Data Fig. 8
Extended Data Fig. 8. Post-hoc analyses correlating DST results with clinical outcomes.
(a) Plot of the relationship between PFS and DSS of associated treatments in FPM-guided patients. P value is from two-sided Spearman correlation of DSS and PFS. Blue dashed line represents a line of simple linear regression. (b) Distribution of DSS separated by response type (left) and response class (NR = Non-Responder, R = Responder) in patients reviewed by the FPMTB. P value is from two-sided Mann-Whitney U test comparing DSS in R and NR classes. CR = complete response, PR = partial response, SD = stable disease, PD = progressive disease. Data are presented as mean values with individual points. In the left panel, PD represents n = 6 patients, SD represents n = 1 patient, PR represents n = 2 patients, CR represents n = 4 patients. In the right panel, NR represents n = 7 patients, R represents n = 6 patients. ^ indicates n = 4 points are at 0. (c) Receiver operating characteristic (ROC) curve of true positive rate and false positive rate of DSS-based response prediction. d) Confusion matrix and associated statistical values of DSS predicted and actual OR in FPM-guided patients and TPC patients at optimal threshold (DSS > 25). Prediction performance metrics (Accuracy, Precision/Positive Predictive Value, Negative Predictive Value, Recall, MCC, F1) are provided below the confusion matrix.
Extended Data Fig. 9
Extended Data Fig. 9. Post-hoc analyses correlating patient-specific clinical outcomes with DST assay measures.
Analysis of relationship between viability of untreated control cells determined by luminescence, and (a) objective response (OR), (b) PFS, (c) PFS ratio ≥ 1.3x status, and (d) PFS ratio. Analysis of relationship between percentage of drugs showing any effectiveness and (e) OR (f) PFS, (g) PFS ratio ≥ 1.3x status, and (h) PFS ratio. Analysis of relationship between average DSS of drugs showing any effectiveness and (i) OR, (j) PFS, and (k) PFS ratio ≥ 1.3x status, and (l) PFS ratio. No significant relationship was identified between any confounding variable and any outcome measure. P values in a, c, e, g, l, and k determined by two-sided Kolmogorov-Smirnov tests comparing medians of classes. P values in b, d, f, h, j, and l determined by two-sided Spearman correlation analyses comparing confounding variables with outcomes. R = Responder, NR = Non-Responder, CR = complete response, PR = partial response, SD = stable disease, and PD = progressive disease. In all box and whisker plots in panels a, c, e, g, i, and k, the lower box line represents the low quartile (25th percentile), the center line represents the median (50th percentile), the top line represents the upper quartile, and the whiskers represent the minimum and maximum. R represents n = 6 patients, and NR represents n = 8 patients. Similarly, ≥1.3x represents n = 6 patients, and <1.3x represents n = 8 patients.
Extended Data Fig. 10
Extended Data Fig. 10. Integration of FPM and explainable artificial intelligence/machine learning (xAI/ML) for advancing personalized medicine workflows.
Workflow diagram depicting the sequential process of the FPM and xAI/ML approach for enhancing individualized cancer medicine. Patients are enrolled followed by a biopsy/resection of the tumor sample. Live patient-derived cultures undergo high-throughput ex vivo DST assay in combination with molecular tumor profiling using whole-exome sequencing and whole-transcriptome sequencing. The results of both the DST and molecular profiling are reported to the FPM tumor board (FPMTB) to make informed treatment decisions based on each individual patient’s profile. The xAI/ML platform simultaneously analyzes DST results, molecular profiling data and existing knowledge of drug interactions to provide potential drug combinations tailored to each patient’s specific tumor characteristics, as well as uncovers potential multi-omics biomarkers. The drug combination rankings will also be reported to the FPM tumor board for treatment decision-making. The process will enable the FPMTB to make treatment decisions in a clinically actionable timeframe (less than 2 weeks) for each individual patient. The workflow shows the multidimensional and personalized approach for further development of personalized cancer medicine. Created with BioRender.com.

References

    1. Siegel, R. L., Miller, K. D., Wagle, N. S. & Jemal, A. Cancer statistics, 2023. CA Cancer J. Clin.73, 17–48 (2023). - PubMed
    1. Adamczewska-Wawrzynowicz, K. et al. Modern treatment strategies in pediatric oncology and hematology. Discov. Oncol.14, 98 (2023). - PMC - PubMed
    1. Aguilera, D. et al. Response to bevacizumab, irinotecan, and temozolomide in children with relapsed medulloblastoma: a multi-institutional experience. Child Nerv. Syst.29, 589–596 (2013). - PMC - PubMed
    1. Morash, M., Mitchell, H., Beltran, H., Elemento, O. & Pathak, J. The role of next-generation sequencing in precision medicine: a review of outcomes in oncology. J. Pers. Med.8, 30 (2018). - PMC - PubMed
    1. Wong, M. et al. Whole genome, transcriptome and methylome profiling enhances actionable target discovery in high-risk pediatric cancer. Nat. Med.26, 1742–1753 (2020). - PubMed

Publication types

Associated data