. 2024 May;9(5):1340-1355.
doi: 10.1038/s41564-024-01638-5. Epub 2024 Apr 11.

Single-molecule epitranscriptomic analysis of full-length HIV-1 RNAs reveals functional roles of site-specific m6As

Affiliations

Single-molecule epitranscriptomic analysis of full-length HIV-1 RNAs reveals functional roles of site-specific m6As

Alice Baek et al. Nat Microbiol. 2024 May.

Abstract

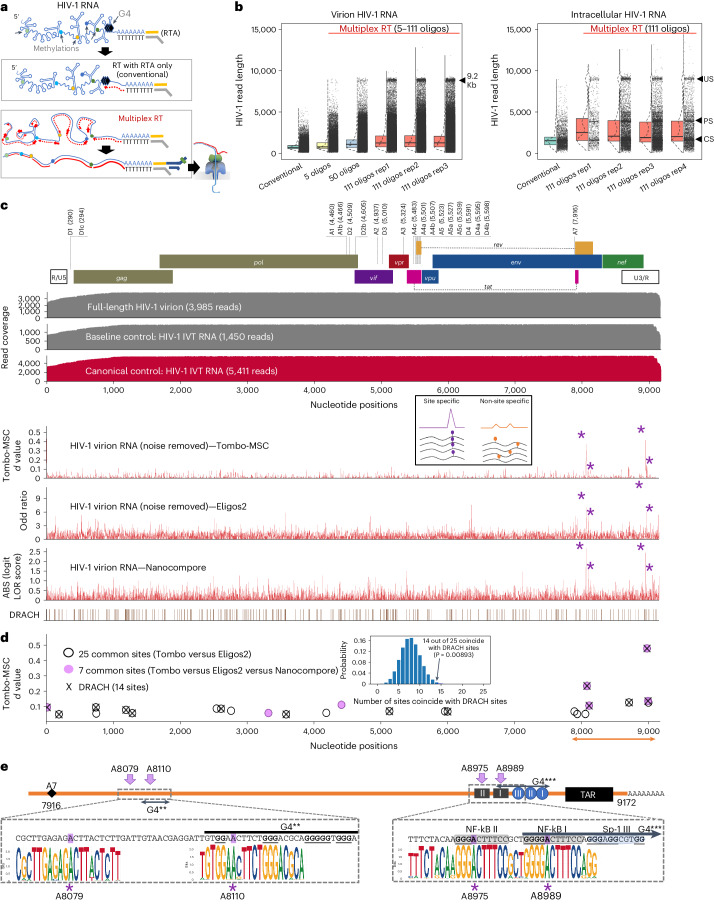
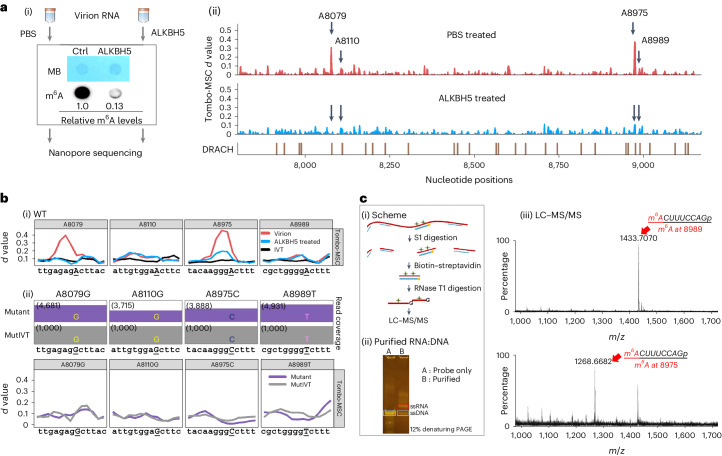
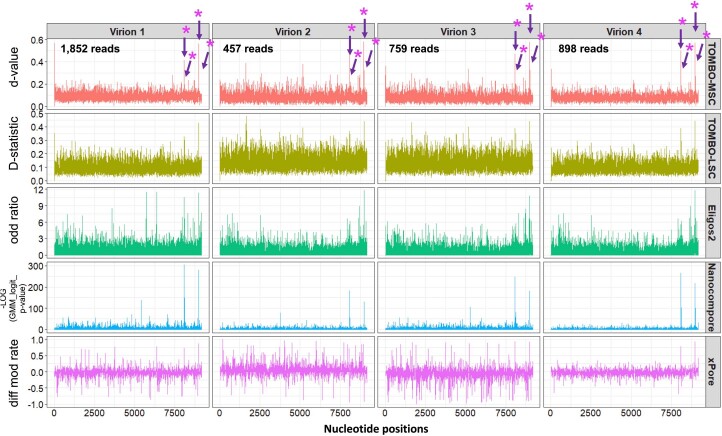
Although the significance of chemical modifications on RNA is acknowledged, the evolutionary benefits and specific roles in human immunodeficiency virus (HIV-1) replication remain elusive. Most studies have provided only population-averaged values of modifications for fragmented RNAs at low resolution and have relied on indirect analyses of phenotypic effects by perturbing host effectors. Here we analysed chemical modifications on HIV-1 RNAs at the full-length, single RNA level and nucleotide resolution using direct RNA sequencing methods. Our data reveal an unexpectedly simple HIV-1 modification landscape, highlighting three predominant N6-methyladenosine (m6A) modifications near the 3' end. More densely installed in spliced viral messenger RNAs than in genomic RNAs, these m6As play a crucial role in maintaining normal levels of HIV-1 RNA splicing and translation. HIV-1 generates diverse RNA subspecies with distinct m6A ensembles, and maintaining multiple of these m6As on its RNAs provides additional stability and resilience to HIV-1 replication, suggesting an unexplored viral RNA-level evolutionary strategy.


Conflict of interest statement

The authors declare no competing interests.

Figures

Fig. 1
Fig. 1. DRS of full-length HIV-1 RNA points to the site-specific function of m6As.
a, A schematic view of multiplex RT. The polyadenylated RNAs were selectively sequenced using a RT adaptor (RTA). b, Read length distribution. Unlike the conventional methods, our multiplex RT with 111 oligos enabled a consistent and reproducible recovery of full-length HIV-1 RNA. The arrowheads denote 9.2 Kb virion RNA (left) and intracellular US, PS and CS HIV-1 RNAs (right). Rep1–3 (left) and rep1–4 (right) denote repeated experiments using independently prepared samples. c, A total of 3,985 full-length virion RNA reads, 5,411 reads of IVT RNAs (canonical control) and 1,450 IVT RNA subreads (baseline control) were analysed using Tombo-MSC, Eligos2 and Nanocompore. ‘d values’ from Tombo-MSC, ‘odd ratios’ from Eligos2 and absolute values (ABS) of ‘logit LOR score’ from Nanopore are shown. Site-specific modifications exhibit a robust and distinct signal, while the signals from non-site-specific modifications are diluted in these population-level analyses. d, To identify modification signals common in the three analyses, the top 149 peaks of Tombo-MSC (d value >0.05 based), 167 of Eligos2 data (odd ratios >2.4) and 156 peaks from Nanocompore results (logit LOR score >0.73) were cross-compared (Supplementary Fig. 7). A total of 25 signal peaks common in Tombo-MSC and Eligos2 (open circles) and seven peaks common in all three analyses (purple circles) are shown. Crosses denote DRACH sites. The 25 common sites are significantly enriched in DRACH sites (Methods). e, The magnified HIV-1 genome from 7,916 to 9,172 of HIV-1 genome (NL4-3 strain) and sequence logo plots for circulating HIV-1 (Los Alamos Database; https://www.hiv.lanl.gov/) are shown. Two adjacent sites (8,975 and 8,989) were located immediately upstream of the G-quadruplexes (G4s) in the U3, and the m6A at 8,079 and 8,110 are located immediately upstream of the potential G4 within the rev/env region downstream of the A7 splicing acceptor. Source data
Fig. 2
Fig. 2. Confirming dominant m6As on HIV-1 RNA at the single nucleotide resolution.
a, ALKBH5 treatment reduced m6A signals of HIV-1 virion RNA. A schematic view of ALKBH5 treatment is shown in (i). An immunoblot assay showed an 87% reduction in m6A signals following ALKBH5 treatment (i). DRS Tombo-MSC d values comparing ALKBH5-treated (blue) and non-treated (PBS; red) RNAs are shown in (ii). b, Site-directed mutagenesis eliminated modification signals. Tombo d values (y axis) comparing WT (red), ALKBH5-treated WT RNAs (blue) and WT IVT RNAs (black) are shown in (i). Tombo analysis of four mutant NL4-3 RNAs, including A8079G, A8110G, A8975C and A8989T, using IVT controls with the same mutations is shown in (ii). Top: the read depth of mutant HIV-1 RNA (purple bars) and IVT controls (MutIVT; grey bars). All mutants showed effective removal of modification signals. c, Oligonucleotide LC–MS/MS using RNase T1. A schematic view of RNA sample preparation is shown in (i). The target RNA fragments are purified using biotinylated DNA probes and subjected to RNase T1 digestion and LC–MS/MS. Purified target RNAs and DNA probes are shown in a 12% denaturing polyacrylamide gel electrophoresis (PAGE) (ii). Oligonucleotide LC–MS/MS confirmed adenosine methylations at 8,989 (top) and 8,975 (bottom) (iii). MB, methylene blue; Ctrl, untreated control. Source data
Fig. 3
Fig. 3. Knocking out all the three dominant m6As on HIV-1 RNA, but not the single m6A, affects viral fitness.
a, A schematic view of experimental procedures. qPCR, quantitative PCR. b,c, Intracellular Gag protein (b) and gp41 and Vif expression (c) were significantly reduced by the triple mutation (P = 0.0110, P = 0.0146 and P = 0.0037, respectively), but not by the single mutations. Western blot results were quantitated by densitometry (bar charts below the gel images). WT results were set as 1. Triple mutant (Triple) and single mutants (A8079G, A8975C and A8989T) are shown in comparison. d, Triple mutants showed a significant reduction in US RNAs (P = 0.0037), while single mutants did not. e, p24 release into the medium was significantly reduced by triple mutations (P = 0.0348), but not by single mutations. f, An infection assay using an equimolar p24-containing medium showed a significant decrease in viral infectivity (P = 0.0004). The number of infected cells was determined by measuring GFP expression in GHOST reporter cells using flow cytometry. A heat-inactivated (heat inact.) HIV-1 was used as a negative control. A8079 is in a region where rev and env genes overlap. A8079G is silent for rev but changes glutamine to glycine at position 771 of gp41 (the cytoplasmic domain of envelope). A8975C and A8989T are in the U3. All the bar graphs in this figure are presented as mean values ± s.d. Two-tailed t-tests; n = 3 for triple (triangles), A8079G, A8975C (circles) and A8989T (diamonds); n = 3 for WT in each experiment (three experiments, total n = 9). NS, not significant. Source data
Fig. 4
Fig. 4. The triple m6A mutation induces over splicing of HIV-1 RNA.
a, Full-length intracellular HIV-1 RNA were mapped onto the reference. A total of 94.8% of full-length reads were successfully assigned to 196 exon combinations without any notable ambiguity for splicing donors (D1–D4) and acceptors (A1–A7). The box plots show the full-length recovery rates by conventional (conven.) and multiplex RT methods. b, A schematic view of HIV-1 RNA production. c, Absolute counting of DRS data showed a general agreement with the densitometry quantification of RT–PCR amplicons of CS (r2 = 0.81 for most prominent bands) (i) and PS (r2 = 0.73 for six most prominent bands) (ii) RNAs. WT HIV-1 DRS data (n = 4) were combined into a single dataset to quantitate individual isoforms. d, While total HIV-1 RNA remained at similar levels (i), the total US RNAs were significantly reduced in triple mutant-producing HEK293T cells (ii). Data are presented as mean values ± s.d. P = 0.0105; two-tailed t-test; WT, n = 4; triple, A8079G, A8975C and A8989T: n = 3; biologically independent samples (ii). The fractions of total spliced RNAs (based on the D1 and D1c usage; P = 0.0105) (iii) and CS RNAs (based on the A7 usage; P = 0.0028) (iv) were significantly higher than WT. Donor and acceptor usage rates (shown in log2 scale heat map; *P < 0.05 and **P < 0.01, Student’s t-test) are generally higher in triple mutant-producing cells than those in WT-producing cells (v). The increased donor and acceptor usage rates resulted in an increase in CS ratios (vi). e, All mutants showed similar levels of env/vpu and vif mRNAs (i), while gp41 and Vif protein translation rates per mRNA (ii; calculated by dividing western blot densitometry results with mRNA levels) were lower in triple mutant-producing cells than in single mutant-producing cells. f, The lengths of the 3′ poly(A) tail in protein-specific mRNAs are shown. WT and triple mutants showed no significant difference (two-tailed Kolmogorov–Smirnov test: box, first to last quartiles; whiskers, 1.5× interquartile range; centre line, median; points, individual data values; violin, distribution of density; sORF, short open reading frames). The lengths of poly (A) tail, varied among CS, PS, US and virion RNAs (Extended Data Fig. 8). Source data
Fig. 5
Fig. 5. Read-level binary classification identifies HIV-1 RNA subspecies with distinct m6As.
a, The development of read-level binary-classification models (m6Arp models) for the three predominant m6A sites. The heat map view shows heterogeneous RNA reads (rows) clustered on the basis of Tombo-MSC per-read P values at positions −4 to +1 relative to the A8079, A8975 and A8989 sites (N−4, N−3, N−2, N−1, A0, N1; A0, m6A marked by purple arrows (i)). To train the models, we generated three sets of positive and negative training datasets (Extended Data Fig. 9 and Supplementary Table 8) (ii). Positive control (green) and WT virion RNA reads (brown) showed a common shift of d values to positions −4 to +1 relative to the m6A sites. Our pretrained models showed superior AUROC (AUC; top) and area under the precision-recall curve (AP; bottom) than m6ANet and nanom6A (iii). The m6Arp models effectively determined m6As for each read and identified RNA subspecies with distinct ensembles of these m6As (subspecies A–H) (iv). b, A read-level estimation of m6A stoichiometry of at the three sites for CS, PS, US and virion. Data are presented as mean values ± s.d. Two-tailed t-test; n = 4 intracellular RNA, n = 4 virion RNA and biologically independent samples. c, Differential distribution of m6A RNA subspecies in CS, PS, US and virion RNA. A total of 97.5% of CS RNAs and 96.3% of PS RNAs have ≥1 m6As (subspecies A–G). The fraction of subspecies with ≥2 m6As (A–D) was highest in CS (80.7%) and lowest in virion (47.2%). Source data
Fig. 6
Fig. 6. Intramolecular HIV-1 RNA m6A heterogeneity and functional redundancy.
a, Splicing donor and acceptor usages were analysed for WT subspecies A–H of CS (i), PS (ii) and US (iii) RNA. All WT subspecies showed substantial differences in mRNA contents (iv) and splicing donor and acceptor usages (v) compared with those of the triple mutant (black arrows on iv–v representing a baseline control of RNAs lacking all three m6As). Among WT subspecies, however, all showed only marginal differences in generating splicing isoforms (iv–v). b, Heat map views for A8079G (i), A8975C (ii) and A8989T (iii). c, Comparison of m6A stoichiometry at the three m6A positions. All single mutants showed indistinguishable or only moderate differences in m6A stoichiometry compared with the WT. One exception was that the A8975C mutant showed a moderate (1.3-fold) increase in the stoichiometry of the neighbouring 8,989 m6A. d, The fractions (%) of RNAs with ≥1 m6As in the CS, PS and US groups were compared. Knocking out one of the three m6As still allows HIV-1 to maintain ≥1 m6A in 87.7–94.7% and 81.9–93.9% of CS and PS RNAs. Data are presented as mean values ± s.d. Two-tailed t-test; WT, n = 4; A8079G, A8975C and A8989T, n = 3; biologically independent samples. Source data
Extended Data Fig. 1
Extended Data Fig. 1. Multiplex RT improves DRS of full-length HIV-1 RNA.
(a-b) The DRS read throughput (a) and average read lengths (b) were compared between DRS using new Multiplex RT method (orange box; n = 3 distinct samples) and DRS following the conventional ONT protocol (green boxes; n = 9 distinct samples). The multiplex RT significantly improved the average read length of virion RNAs compared to the conventional ONT protocol (p = 0.005; left panel; two-tailed T test), while maintaining the read throughput. Data are presented as mean values +/− standard errors. The conventional methods failed to generate more than 13 near-full-length HIV-1 virion RNA reads (> 0.01% of HIV-1 reads) in 8 out of 9 MinION runs. The multiplex RT methods showed the recovery ratios of more than 0.5% (457–898 reads per run) for virion RNAs (Supplementary Table 5). For intracellular HIV-1 RNAs, the full-length recovery rates with Multiplexed RT reached to 34.9%, 31.5%, and 54.1% for unspliced (US), partially spliced (PS), and completely spliced (CS) RNAs, respectively (see Fig. 4a; n = 4 for Multiplex RT; n = 1 for conventional). The open circles in the green boxes are 4 repeated experiments using the DRS standard protocols; the colored circles represent DRS runs using modified RT conditions, including the conditions using TIGRT (pink circle) and marathon RT (yellow circle) that replaced SSIV RT of the conventional protocol. (c) Mapping of intracellular HIV-1 RNA. All 4 DRS runs using multiplex RT showed an improved and highly reproducible mapping onto the reference. Read depths (y-axis) of WT and mutant RNA reads are shown over the HIV-1 genome (NL4-3 strain). The positions of the splicing donor (D1-D4) and acceptor (A1-A7) sites are shown on the top. Source data
Extended Data Fig. 2
Extended Data Fig. 2. Highly reproducible Tombo analysis using HIV-1 IVT canonical controls.
(a-b) Tombo-‘model sample compare’ (MSC) analysis for full-length virion RNA reads (grey; total 3,985 reads of >8 Kb). We used 2 different sets of HIV-1 IVT canonical controls: full-length IVT RNAs (5,411 reads) (a) and half-length IVT RNAs (26,000 reads of F1 and 28,100 reads of F2) (b). Tombo-MSC analysis using these F1 and F2 reads show a similar read depth coverage (approximately 25K reads) for both F1 and F2 regions. The resulting ‘d-value’ plots show the 4 most prominent modification signals (purple asterisks) near the 3′ end side of the genome. (c) Consistent generation of per-read p-values. We tested the effects of the read depth of the IVT canonical control on Tombo-MSC analysis. Tombo-MSC p-values for virion RNA were generated using 0.5 K, 1K, 5K, 10K, 20K, 30K, 40K, or 50K reads of F1 and F2 IVT canonical reads (the green box in the schematic view). Per-read per-position p-values of these datasets were directly compared to p-values of the identical position of the identical reads of the control datasets generated using 50K IVT (the grey box in the schematic view). Per-read p-values generated with >20K reads were highly reproducible (r2 > 0.999) when compared to those of 50K IVT dataset. (d) Tombo-MSC analysis of 4 datasets of WT virion RNA DRS (Virions 1 to 4). Median per-read p-values generated with Tombo-MSC using 5,411 reads of full-length IVT RNA (Top panel) and 25K reads of half-length IVT RNAs (lower panel) were compared. Both datasets show highly reproducible p-values for the 4 virion datasets separately run on MinIONs. For these runs, 4 different virion RNA samples were prepared by separate transfection of HEK293T cells with pNL4-3 plasmids. Source data
Extended Data Fig. 3
Extended Data Fig. 3. Reproducible detection of the 4 most prominent peaks.
4 sets of HIV-1 virion RNA DRS runs were tested with Tombo-MSC (top panels), Tombo-level-sample-compare (Tombo-LSC; second from the top), Eligos2 (third from the top), Nanocompore (fourth from the top), and xPore (bottom panels). All tools identified the four m6A sites (purple asterisks) among the most prominent modification signals. Tombo-MSC, Eligos2 and Nanocompore results showed relatively more reproducible than Tombo-LSC and xPore. Source data
Extended Data Fig. 4
Extended Data Fig. 4. Comparison of m6A sites between Nanopore DRS and Short-Read Sequencing data.
(a) m6A-seq analysis of primary CD4+ T Cells infected with HIV-1 NL4-3 strain from Tirumuru et al. RNA fragments containing m6A methylation were aligned to the HIV-1 genome. (b) m6A sites and m6A-reader binding sites mapped by photo-crosslinking-assisted m6A sequencing (PA- m6A-seq) and photoactivatable ribonucleoside-enhanced crosslinking and immunoprecipitation (PAR-CLIP), respectively, from Kennedy et al. and Tsai et al. PA- m6A-seq Analysis of Virion RNA (Top Panel) and Cellular RNA (Second Panel from the Top) from HIV-1 NL4-3-Infected CD4+CEM-SS T Cells, as well as PAR-CLIP analysis of m6A reader binding sites, including YTHDF1-3 (middle three panels) and YTHDC1(bottom two panels) are shown. (c) A magnified View of the four major m6A sites predicted by Kennedy et al. Notably, areas 1 and 3 coincide with our Nanopore DRS m6A peaks (purple asterisks in the bottom panel). (d) Potential Modification Sites in Nanopore DRS Data. In this section, we present potential modification sites detected in Nanopore DRS data for HEK293T cells transfected with pNL4-3 (upper panel) and those for WT-infected CD4+ T cells (CEM-SS) 96-hour post infection (lower panel; result of single cycle infection, see methods for details). Source data
Extended Data Fig. 5
Extended Data Fig. 5. Evaluation of DRS-detected modification sites.
(a) The top panel shows the 25 common sites between Tombo and Eligos2 data (circles) and 7 sites common in all three datasets (purple circles) (see Methods and Supplementary Fig. 7a). The 25 common sites show a significant correlation with DRACH sites (denoted by X) and previously m6A-mapped areas and m6A-reader binding sites (see Supplementary Table 4). Other published modification sites, including 5-methylcytosine (m5C; green dots above the circles) N4-acetylcytidine (ac4C; blue dots above the circles) showed no significant correlation (see Supplementary Table 4 -i-). There was only one event where the 25 common sites overlap with previously published 2′-O-methylation sites (Am; red dot above the circles; it overlaps with one of the 14 common DRACH sites). (b) The modification signals of ALKBH5-treated RNA (blue lines) and PBS-treated virion RNA (red lines) are shown. The black line denotes the IVT-subset control. (i) The DRS signals of 13 nucleotides surrounding the four DRACH sites (A8079, A8110, A8975, and A8989) are compared. Signals from Tombo-MSC (d-values; top), Eligos2 (second from the top), nanom6A (third from the top), and dwell time (fourth from the top) are shown. Dwell time differences were measured at both the putative m6A site and its 10 base downstream. (ii) The signal reduction for non-DRACH sites, including A7889, A7934, A8054, A8707 and A8996 was relatively mild or undetectable. Source data
Extended Data Fig. 6
Extended Data Fig. 6. Knocking out all three dominant m6As, but not the single m6A, affects HIV-1 fitness.
(a) Digital PCR was used to measure total HIV-1 RNA production normalized by glyceraldehyde-3-phosphate dehydrogenase (GAPDH) (i) or actin beta (ACTB) RNAs (ii). The relative ratios of total HIV-1 RNA and GAPDH RNA (i) or ACTB RNA (ii) were simultaneously measured by digital PCR, with total HIV RNA measured targeting the 5′ U5 region. These showed mixed results depending on the controls used, but Nanopore DRS data (Fig. 4d–i) showed no difference in Triple mutant (Triple). Data are presented as mean values +/− standard deviation. (two-tailed T test; WT: n = 3 for each comparing set (3 experiments, total n = 9); Triple, A8079G, A8975C, and A8989T: n = 3; biologically independent samples) (b) Approximately half of intracellular HIV-1 RNA is unspliced (US) RNA. The US and total HIV-1 RNA were measured by digital PCR. HEK293T cells were analyzed 72 hour post-transfection with pNL4.3 plasmids (i). Data are presented as mean values +/− standard deviation. (two-tailed T test; WT: n = 3 for each comparing set (3 experiments, total n = 9); Triple, A8079G, A8975C, and A8989T: n = 3; biologically independent samples) Jurkat T cells were analyzed 96 hour post infection (hpi) with MOI of 1-2 of HIV-1NL4.3 (ii). Data are presented as mean values +/− standard deviation. (two-tailed T test; WT: n = 3 triple mutant: n = 3; biologically independent samples) (c) Flow cytometry analysis of GHOST cell infection. (i) Flow cytometry gating strategies showing the single cell-gating (left panel) and a removal of outliers (right panel). (ii) Gating of GFP+ cells. Gates were determined based on the negative control (PBS treated) and the positive control (WT-infected cell) data. Infection assays were triplicated. Source data
Extended Data Fig. 7
Extended Data Fig. 7. Analysis of HIV-1 RNA alternative splicing.
(a) DRS cellular RNA runs occasionally showed poor read length distributions (see FAIL in a & b). When the fraction of > 2 Kb RNAs is less than 10% of the total reads, these samples were considered unsuitable and excluded from HIV-1 splicing analysis. The length distributions of cellular RNA are shown for 4 WT, 3 triple mutants, 10 single mutants (A8079G, A8110G, A8975C and A8989T), and FAIL. (b) Selection of full-length HIV-1 intracellular RNAs. Any HIV-1 RNA reads that lack the U5 sequence are removed from the analyses; only full-length CS, PS, and US reads were used for the analysis. (c) The relative fraction of intracellular HIV-1 RNAs (full-length CS, PS, and US) mapped onto the reference genome (pNL4-3). A total of 196 exon combinations, including the major 53 viral RNA isoforms, utilizing various combinations of splicing donors (D1-D4) and acceptors (A1-A7) were identified. WT1-4 and Triple 1-3 Data were produced via multiplex RT method. Conventional DRS results following ONT’s standard DRS protocol (using SSIV and RTA for RT) are shown for comparison. (d) splicing donor and acceptor site usage. (i-ii) bar-graphs showing the relative usage rates per HIV-1 RNA (US+PS+CS combined; y-axis) for Splicing Donor usage (i) and Splicing Acceptor usage (ii). (iii) First donor sites. Nearly all (93.5%-94.6%) spliced RNA uses D1 donor; 5.3% to 6.3% use D1c; and less than 0.5% use other donors (D2, D3 or D4) for the first splicing. (iv) The acceptor usage rates following the D1 donor usage (% of D1, y-axis) during the first splicing event. WT (n = 4 distinct samples), triple mutants (n = 3 distinct samples) and single mutants (A8079G, A8975G, A8989T; n = 3 samples) are shown. Source data
Extended Data Fig. 8
Extended Data Fig. 8. Analysis of HIV-1 RNA 3′ poly (A) tails.
(a) The lengths of 3′ polyadenylation, poly (A) tail, varied significantly among CS, PS, US and virion RNAs, but there was no significant difference between WT (i) and triple mutants (ii) (two-tailed kolmogorov-smirnov test: box, first to last quartiles; whiskers, 1.5X interquartile range; center line, median; points, individual data values; violin, distribution of density). (b) Poly (A) length distribution of single mutants. They also showed significant differences among CS, PS and US RNA (two-tailed kolmogorov-smirnov test: box, first to last quartiles; whiskers, 1.5X interquartile range; center line, median; points, individual data values; violin, distribution of density).
Extended Data Fig. 9
Extended Data Fig. 9. Development of binary classification models (m6Arp) for accurate detection of three dominant m6As at the read level.
(a-b) Three synthetic RNAs with an m6A modifications at positions 8079, 8975, or 8989 were ligated to carrier RNA to generate positive control data. (a) Mass spectrometry data show nearly complete m6A modification in synthetic RNA controls (Horizon Discovery Ltd.). (b) A schematic view of generating positive control RNAs (see Methods). (c) Tombo-MSC d-values near the position 8079 are shown as an example of DRS data for control RNAs. (d) The heatmap views show per-read p-value distributions for 8079m6A+ control (upper panel) and negative control (lower panel). Each row represents a different RNA molecule. (e) A shift of p-values to upstream of the modification site. The top panels show median p-values near the 8079 (left), 8975 (middle) and 8989 (right) sites with notable p-value peaks spanning −4 to +1 positions (N−4.N−3.N−2.N−1.A0.N1.; where A0 = m6A) of the m6A site. The patterns were consistent with previous cellular transcript data Per-read p-value patterns for five chosen reads (Read 1 to 5). Each read showed substantial variations and irregularities, but nevertheless, all reads demonstrated robust differences in the p-value patterns compared to those of the negative controls (see Supplementary Table 8 for all available data in the data repository). (f) Optimizing m6Arp models. Tombo-MSC per-read p-values were prepared with fisher = 0, 1, 2 or 3 options. Fisher = 0 (no data fusion) option (model8079_f0, model8975_f0, and model8989_f0) showed the best area under the receiver operating characteristics curve (AUROC) (see Supplementary Table 7). (g) Our models also showed a strong linearity of quantification (R2 > 0.9982), after adjustments for FNR and FPR (r2 = 0.9982 to 0.9987; see Methods). (h) All read-level quantification tools, including m6Arp-models (light blue), Tombo d-value (dark blue), Nanom6A (green) and m6ANet (orange), showed relatively low m6A stoichiometry in unspliced RNA (virion and US RNA) compared to those in spliced (CS and PS) RNA for all the 3 sites, including A8079 (top panels), A8975 (middle panels), and A8989 (bottom panels).
Extended Data Fig. 10
Extended Data Fig. 10. Single-molecule-level analysis reveals the functional redundancy of the m6As.
(a) Nanom6A analysis of full-length DRS reads from WT, single mutant, and triple mutant HIV-1 RNAs showed no notable signal changes in the DRACH sites in the full genome compared to the WT landscape. The dominant m6As at A8079, A8975, and A8989 are indicated by green, blue, and purple asterisks, respectively. Mutations effectively removed m6A signals at the target site. The DRACH sites are shown in the bottom panel. (b) Splicing patterns of RNA subspecies with distinct m6A ensembles for A8079G (top two panels), A8975C (middle two panels), and A8989T (bottom two panels). Four RNA subspecies (blue, orange, grey, and yellow, with distinct m6A ensembles) of completely spliced (CS) and those of partially spliced (PS) RNA were mapped onto the HIV-1 reference sequence (NL4-3 strain) to show their splicing patterns. All RNA subspecies showed indistinguishable or moderate differences in the usage of splicing donors and acceptors. (c-d) All subspecies from the three mutants (including subspecies I, J, K, and L, from A8079G; subspecies M, N, O, and P from A8975C; and subspecies Q, R, S, and T from A8989T) showed moderate differences in the production of protein-specific mRNAs (c) and donor and acceptor usage rates (d). Triple mutant data are shown for comparison (arrowheads). Source data

References

    1. Davis FF, Allen FW. Ribonucleic acids from yeast which contain a fifth nucleotide. J. Biol. Chem. 1957;227:907–915. doi: 10.1016/S0021-9258(18)70770-9. - DOI - PubMed
    1. Boccaletto P, et al. MODOMICS: a database of RNA modification pathways. 2021 update. Nucleic Acids Res. 2022;50:D231–d235. doi: 10.1093/nar/gkab1083. - DOI - PMC - PubMed
    1. Phillips S, Mishra T, Huang S, Wu L. Functional impacts of epitranscriptomic m6A modification on HIV-1 infection. Viruses. 2024;16:127. doi: 10.3390/v16010127. - DOI - PMC - PubMed
    1. Alfonzo JD, et al. A call for direct sequencing of full-length RNAs to identify all modifications. Nat. Genet. 2021;53:1113–1116. doi: 10.1038/s41588-021-00903-1. - DOI - PubMed
    1. McIntyre W, et al. Positive-sense RNA viruses reveal the complexity and dynamics of the cellular and viral epitranscriptomes during infection. Nucleic Acids Res. 2018;46:5776–5791. doi: 10.1093/nar/gky029. - DOI - PMC - PubMed

Publication types