. 2024 May;6(5):880-898.
doi: 10.1038/s42255-024-01023-w. Epub 2024 Apr 11.

Adipose tissue macrophages secrete small extracellular vesicles that mediate rosiglitazone-induced insulin sensitization

Affiliations

Adipose tissue macrophages secrete small extracellular vesicles that mediate rosiglitazone-induced insulin sensitization

Theresa V Rohm et al. Nat Metab. 2024 May.

Erratum in

Abstract

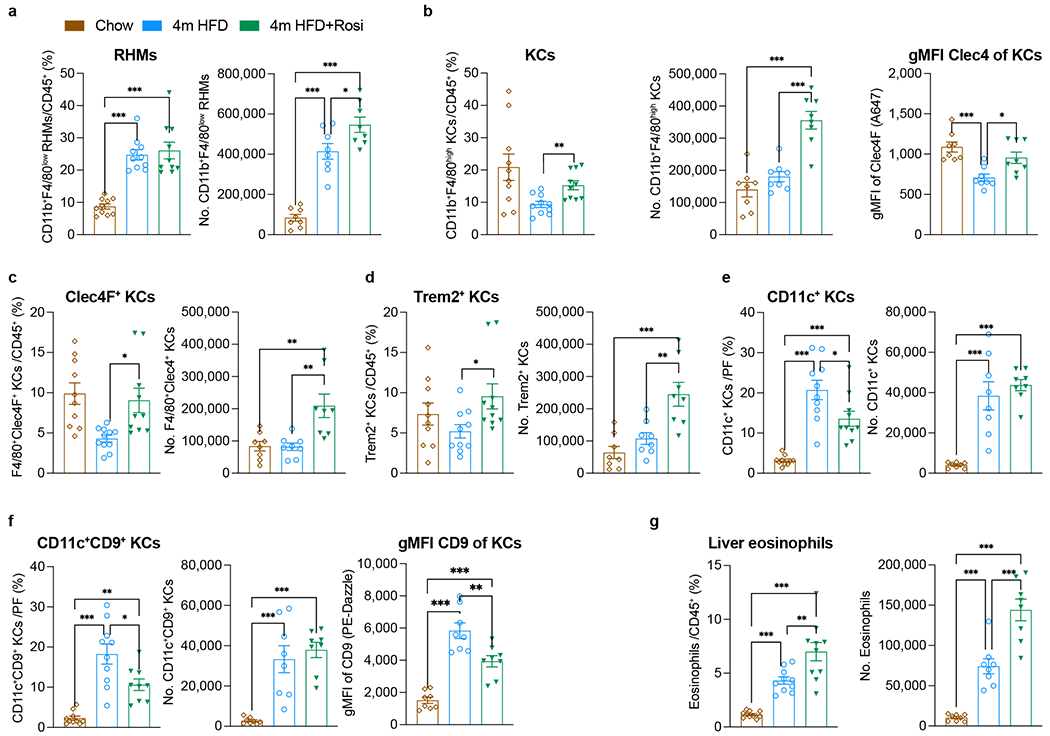
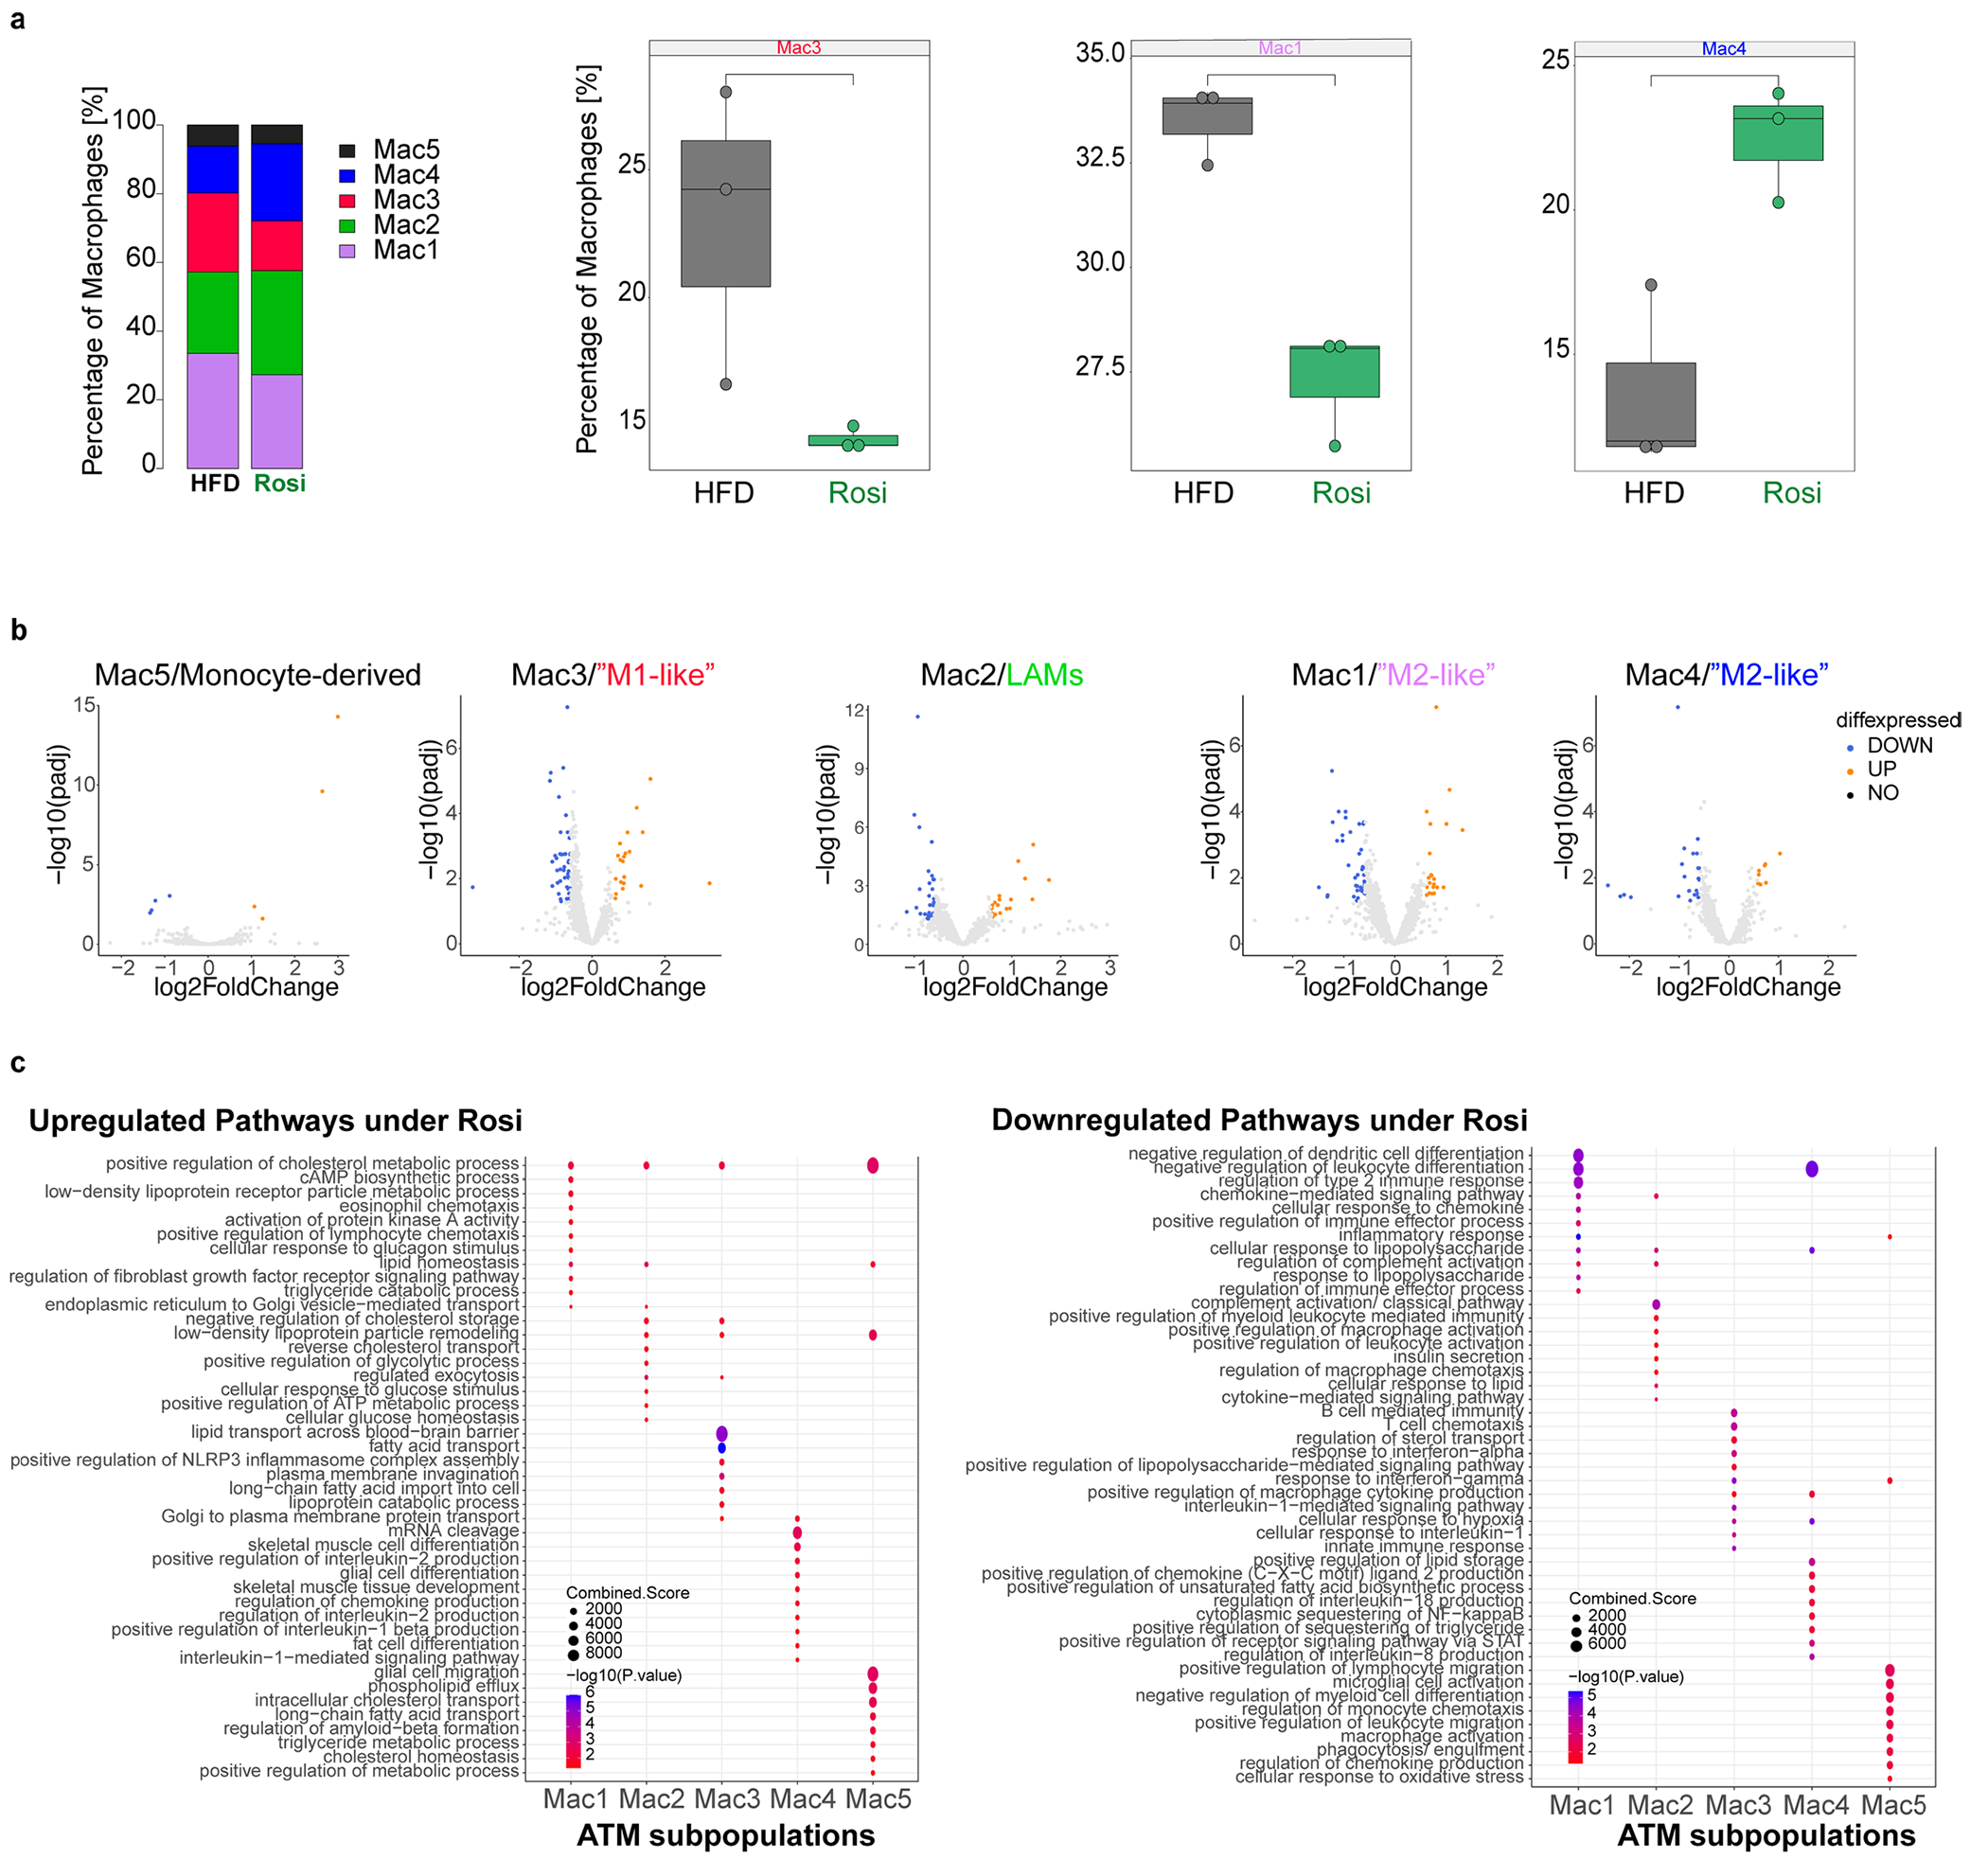
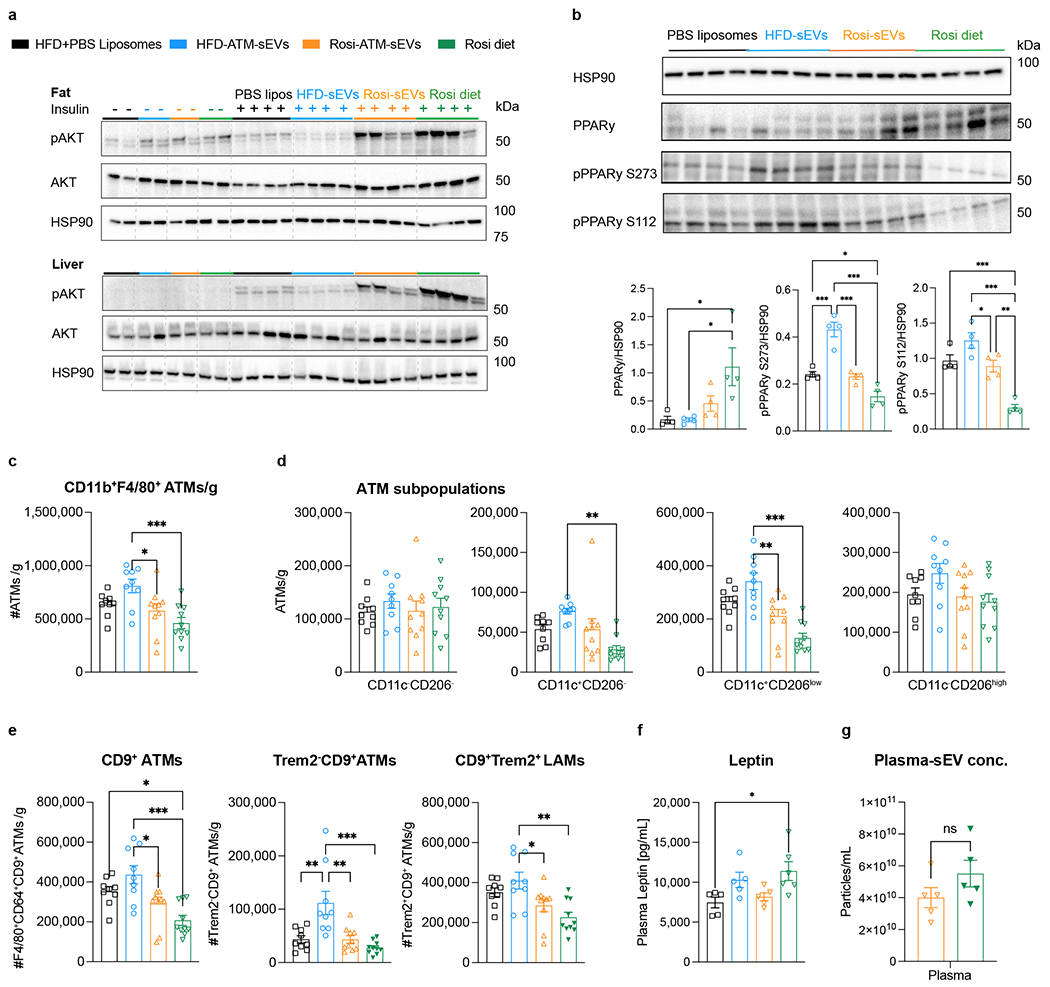
The obesity epidemic continues to worsen worldwide, driving metabolic and chronic inflammatory diseases. Thiazolidinediones, such as rosiglitazone (Rosi), are PPARγ agonists that promote 'M2-like' adipose tissue macrophage (ATM) polarization and cause insulin sensitization. As ATM-derived small extracellular vesicles (ATM-sEVs) from lean mice are known to increase insulin sensitivity, we assessed the metabolic effects of ATM-sEVs from Rosi-treated obese male mice (Rosi-ATM-sEVs). Here we show that Rosi leads to improved glucose and insulin tolerance, transcriptional repolarization of ATMs and increased sEV secretion. Administration of Rosi-ATM-sEVs rescues obesity-induced glucose intolerance and insulin sensitivity in vivo without the known thiazolidinedione-induced adverse effects of weight gain or haemodilution. Rosi-ATM-sEVs directly increase insulin sensitivity in adipocytes, myotubes and primary mouse and human hepatocytes. Additionally, we demonstrate that the miRNAs within Rosi-ATM-sEVs, primarily miR-690, are responsible for these beneficial metabolic effects. Thus, using ATM-sEVs with specific miRNAs may provide a therapeutic path to induce insulin sensitization.


Conflict of interest statement

Competing interests

W.Y. and J.M.O. are co-investigators on a provisional patent covering the use of miR-690 as an insulin sensitizer. The other authors declare no competing interests.

Figures

Extended Data Fig. 1 |
Extended Data Fig. 1 |. Rosiglitazone reduces adipose tissue inflammation and increases the eosinophil percentage in both epididymal (eWAT) and subcutaneous (SubQ) fat.
WT mice were fed HFD for 4 months and treated for the last month with 3 mg kg−1 d−1 rosiglitazone (Rosi) compared to HFD and Chow control mice: a, Epididymal and subcutaneous fat mass (Chow, n = 22, HFD,n = 22, Rosi, n = 23, ***p < 0.0001). b, Number of sorted live (DAPI neg) CD45+CD11b+F4/80+ epidydimal (eWAT) ATMs per mouse (n = 30,40,27; Chow versus Rosi, P = 0.0083, Chow versus HFD, P < 0.0001,HFD versus Rosi, P = 0.0001). c, Percentage and absolute numbers of CD11b+SiglecF+ eWAT eosinophils (%, n = 21, #, n = 19,18,19; ***P = < 0.001, *P = 0.0325). d, e, Percentage and absolute numbers per gram (No. per g) of total subcutaneous adipose tissue macrophages (SubQ ATMs) (n = 25,28,26, %: Chow versus Rosi/HFD, P < 0.001, HFD versus Rosi, P = 0.0006, #: Chow versus Rosi, P = 0.0012, Chow versus HFD, P = 0.0147, HFD versus Rosi, P < 0.0001) (d) and ATM subsets: Double negative (DN), CD11c+CD206 monocyte-derived, CD11c+CD206low ‘M1-like’ and CD11cCD206high ‘M2-like’ ATMs (Chow, n = 25, HFD, n = 28, Rosi, n=29, *P = 0.018, ***P < 0.0001) (e). f, g, Percentage and absolute numbers of CD9+ (%: *P = 0,0180,***P < 0.0001, #: *P = 0.0116, ***P < 0.0001) (f) or CD9+Trem2+ SubQ lipid-associated macrophages (LAMs, %: **P = 0.0034,***P < 0.0001, #: *P = 0.0130, ***P < 0.0001) (g) (n = 25,28,26). h, Percentage and absolute numbers of CD11b+SiglecF+ SubQ adipose tissue eosinophils (n = 25,28,26, %: Rosi versus Chow/HFD, P < 0.0001, Chow versus HFD, P = 0.0012, #: *P = 0.0143). Statistical data are expressed as mean ± s.e.m., with each data point representing a biologically independent mouse from three independent cohorts. *P < 0.05, **P < 0.01, ***P < 0.00, with one-way ANOVA, followed by Tukey’s multiple comparisons tests.
Extended Data Fig. 2 |
Extended Data Fig. 2 |. Rosiglitazone reduces pro-inflammatory cytokine gene expression and increases PPARy target and anti-inflammatory gene expression.
a, b, Relative gene expression of Pparg and its target gene Cd36 (*p = 0.0258, **p = 0.0037), ‘M2-like’ macrophage marker genes (Mrc1, Mgl1, *P = 0.0301,0.0232, **P = 0.0018) (a) and ‘M1-like’ macrophage marker genes (Tnf, Il1b, Infg, iNOS, *P = 0.0152, **P = 0.0065,0.0096) (b) in eWAT ATMs from Chow, HFD, and Rosi mice. c, d, Geometric mean fluorescence intensity (gMFI) of the M2-marker CD206 (P = 0.0043) (c) and the relative gene expression of the M2-marker gene Mgl1 (P < 0.0001), Pparg (P = 0.0008) and its target gene Cd36 (P = 0.0004), and M1-marker genes (Infg, Il1b, *P = 0.0350, **P = 0.0032) (d) in Rosi-treated M1-BMDMs compared to untreated M1-BMDMs. e, gMFI of CD206 (P = 0.0003) and Trem2 (P = 0.0286), and the percentage of Trem2 (P = 0.0286) from Rosi-treated M0 or M2-BMDMs compared to untreated M0- and M2- BMDMs. Statistical data are expressed as mean ± s.e.m., with each data point representing a biologically independent cell replicate, from three independent cohorts (a,b) or representative of one (e) or three (c,d) independent experiments. *P < 0.05, **P < 0.01, ***P < 0.001, with one-way ANOVA, followed by Tukey’s multiple comparisons tests (a,b,e) or an unpaired Mann-Whitney U-test with two-tailed distribution (c and d).
Extended Data Fig. 3 |
Extended Data Fig. 3 |. Rosiglitazone increases liver Kupffer cells and eosinophils.
WT mice were fed HFD for 4 months, with the last month on 3 mg kg−1 d−1 rosiglitazone (Rosi) compared to 4 months HFD and Chow control mice: a, Percentage and absolute numbers (No.) of CD11b+F4/80low recruited hepatic macrophages (RHMs, *P = 0.0257, ***P < 0.0001). b, Percentage, absolute numbers, and geometric mean fluorescence intensity (gMFI) of Clec4F from CD11b+F4/80high Kupffer cells (KCs, %, Rosi versus HFD, P = 0.0029, #, ***P < 0.0001, gMFI, *P = 0.0222, ***P = 0.0006). c-e, Percentage and absolute numbers of Clec4F+F4/80+ KCs (%, Rosi versus HFD, P = 0.0137, #, Chow versus Rosi, P = 0.0035, HFD versus Rosi, P = 0.0030) (c), Trem2+ KCs (%, Rosi versus HFD, P = 0.0185, #, **P = 0.0035, ***P = 0.0002) (d), and CD11c+ KCs (%, *P = 0.0217, Chow versus Rosi, P = 0.009, Chow versus HFD, P < 0.0001) (e). f, Percentage and absolute numbers of CD11c+CD9+ KCs and gMFI of CD9 from CD11b+F4/80high KCs (%, *P = 0.0055, **P = 0.0075, ***P < 0.0001, #, Chow versus HFD, P = 0.0003, Chow versus Rosi, P < 0.0001, gMFI, **P = 0.0035, Chow versus Rosi, P = 0.0003, Chow versus HFD, P = < 0.0001). g, Percentage and absolute numbers of Siglec F+ liver eosinophils (%, Chow versus HFD, P = 0.0008, HFD versus Rosi, P = 0.0038, ***P < 0.0001, # Chow versus HFD, P = 0.0003, HFD versus Chow/Rosi, P < 0.0001). Statistical data are expressed as mean ± s.e.m., with each data point representing a biologically independent mouse from two (gMFI and #, n = 8 per group) or three (%, n = 10 per group) independent cohorts. *P < 0.05, **P < 0.01, ***P < 0.00, while comparing only Rosi versus. HFD with an unpaired Mann-Whitney U-test with two-tailed distribution or comparing all three groups with one-way ANOVA, followed by Tukey’s multiple comparisons tests.
Extended Data Fig. 4 |
Extended Data Fig. 4 |. Cluster analysis of stromal vascular cells.
Single-cell RNA sequencing of epidydimal stromal vascular cells from WT 4 months HFD/obese mice treated for the last month with 3 mg kg−1 d−1 rosiglitazone (Rosi) compared to HFD control mice: a, Heat map showing scaled counts per million expression values of marker genes for broad clusters: macrophages, DCs, T cells, B cells, mast cells, endothelial cells, and adipocyte progenitors. b, Heat map showing genes involved in PPAR signalling pathways of broad macrophage cluster. c, d, Up- (c) or downregulated (d) GO Biological Process 2021 pathways after Rosi treatment compared to HFD for the macrophage cluster (FDR< = 0.1). Point sizes reflect the combined EnrichR score, and the colour represents the P-value for each annotated pathway analysed by two-tailed Wilcoxon rank-sum test. e, Heat map showing scaled counts per million expression values of macrophage subpopulation marker genes in each subcluster: Monocyte-derived (Mac5), ‘M1-like’ (Mac3), lipid-associated (LAMs/Mac2), and ‘M2-like’ ATMs (Mac1 and Mac4). Data are representative of three biologically independent mice from one experiment/cohort (n = 3 per group).
Extended Data Fig. 5 |
Extended Data Fig. 5 |. Rosi treatment alters the transcriptional profile of ATM subpopulations.
ScRNA-seq of epidydimal stromal vascular cells (SVCs) from WT 4 months HFD/obese mice treated for the last month with 3 mg kg−1 d−1 rosiglitazone (Rosi) compared to HFD control mice. a, Percentage of ATM subclusters, including ‘M1-like’ (Mac3) and ‘M2-like’ (Mac1 and Mac4) ATMs, of the total macrophage cluster. b, Volcano plots showing differential expression between Rosi diet and HFD for each ATM subcluster: Monocyte-derived macrophages (Mac5), ‘M1-like’ ATMs (Mac3), lipid-associated (LAMs/Mac2), and ‘M2-like’ ATMs (Mac1 and Mac4). Up- or downregulated genes, when significant at 0.05 % FDR threshold and absolute log2 fold change >0.58, analysed by two-tailed Wilcoxon rank-sum test. c, Up- (left) or downregulated (right) GO Biological Process 2021 pathways after Rosi treatment, compared to HFD for each macrophage subcluster (FDR< = 0.1). Point sizes reflect the combined EnrichR score, and the colour represents the P-value for each annotated pathway analysed by two-tailed Wilcoxon rank-sum test. Data are representative of three biologically independent mice from one experiment/cohort (n = 3 per group). Data (a) show mean ± s.e.m., and brackets indicate statistical significance; otherwise, nonsignificant (NS.) is stated. ‘log10(P)” is the enrichment P-value in log base 10.
Extended Data Fig. 6 |
Extended Data Fig. 6 |. Rosi causes the secretion of a greater number of smaller sEVs from ATMs.
a, Protein expression of exosome-associated markers (Alix, CD63, CD9, CD81) compared to heat shock protein HSP90 and the lysate control glucose-regulated protein 94 (Grp94). b, Mean sEV size of Rosi-ATM-sEVs compared to HFD- and Chow-ATM-sEVs and ratio of particle concentration and sorted CD11b+F4/80+ATMs of visceral (Vis, size, P = 0.0051, ratio, *P = 0.0477, **P = 0.0043), epididymal (eWAT, size, P = 0.0399, ratio, P = 0.0344), or subcutaneous (SubQ, size, P = 0.0207, ratio, P = 0.0251) fat. c, NanoSight analysis of ATM-sEVs derived from Chow, HFD, and Rosi mice. d, NanoSight analysis of BMDM-sEVs derived from Rosi-treated M1-BMDMs compared to untreated M1, M2, and M0 BMDMs. Statistical data are expressed as mean ± s.e.m., with each data point (b) showing a biologically independent sEV sample replicate from three independent cohorts. *P < 0.05, **P < 0.01, with one-way ANOVA, followed by Tukey’s multiple comparisons tests.
Extended Data Fig. 7 |
Extended Data Fig. 7 |. Rosi-ATM-sEVs enhance AKT phosphorylation in all insulin target tissues and reduce pro-inflammatory ATMs.
Obese mice fed 10 weeks HFD were treated for 4 weeks with Rosi-ATM-sEVs (Rosi-ATM-sEVs), HFD-ATM-sEVs, or PBS Ctrl liposomes compared to Rosi diet: a, insulin-stimulated AKT phosphorylation in the epididymal adipose tissue (eWAT) and liver. b, Protein expression of PPARγ (descending P = 0.0170,0.0164) and its inhibitory phosphorylation sites S273 (*P = 0.0342, descending ***P = < 0.0001,0.0002,0.0001) and S112 (*P = 0.0448, **P = 0.0017, descending ***P = 0.006, < 0.0001) in the eWAT. c-e, Absolute numbers of eWAT ATMs per gram (*P = 0.0340, ***P = 0.0007) (c) and their subpopulations: Double negative (DN), CD11c+CD206 monocyte-derived macrophages (p = 0.0010), CD11c+CD206low ‘M1-like’ (**P = 0.0020, ***P < 0.0001), CD11cCD206high ‘M2-like’ ATMs (d), and CD9+ (CD9+, descending P = 0.0179,0.0001,0.0178, Trem2CD9+, PBS versus HFD-sEVs, P = 0.0015, HFD-sEVs versus Rosi-sEVs, P = 0.0015, ***P < 0.0001) or CD9+Trem2+ lipid-associated macrophages (LAMs, *P = 0.0387, **P = 0.0011) (e). f, Circulating leptin levels (P = 0.0301). g, Plasma particle concentration of Rosi-ATM-sEV-treated obese mice compared to Rosi mice measured by NanoSight analysis. Statistical data are expressed as mean ± s.e.m., with each data point representing a biologically independent mouse from one cohort. *P < 0.05, **P < 0.01, ***P < 0.001, with one-way ANOVA, followed by Tukey’s multiple comparisons tests (c-f) or an unpaired Mann-Whitney U-test with two-tailed distribution (g).
Extended Data Fig. 8 |
Extended Data Fig. 8 |. Rosi-HFD eWAT explant-sEVs reverse insulin resistance caused by HFD eWAT explant-sEVs in L6 myotubes in vitro.
a, Glucose uptake in L6 myotubes treated with sEVs isolated from HFD epididymal adipose tissue (eWAT) explants after in vitro treatment with 10 μM Rosi compared to HFD-sEVs or PBS Ctrl liposomes (*P = 0.0378, **P = 0.0028). b,c, Effects of in vitro Rosi treatment on eWAT explants isolated from obese mice on gene expression of Pparg and its target gene Cd36 (P = 0.0190) (b), the ‘M2-like’ macrophage marker gene Mgl1 (P = 0.0303) and miR-690 (c). Statistical data are expressed as mean ± s.e.m., with each data point showing a biologically independent cell replicate, representative of an independent experiment. *P < 0.05, **P < 0.01, ***P < 0.001, with 2-way ANOVA, followed by Tukey’s multiple comparisons tests (a) or an unpaired Mann-Whitney U-test with two-tailed distribution (b,c).
Extended Data Fig. 9 |
Extended Data Fig. 9 |. Enrichment of miR-690 and downregulation of Nadk in Rosi-macrophages is dependent on PPARy activation.
a, Relative gene expression of miR-690 in CD11c+CD206low ‘M1-like’ ATMs (P = 0.0499) or CD11c-CD206high ‘M2-like’ (P = 0.0037) Rosi-ATMs compared to HFD-ATMs. b, Effects of Rosi-sEVs isolated from ‘M1-like’ or ‘M2-like’ Rosi-ATMs on glucose uptake in L6 myotubes compared to HFD-ATM-sEVs or PBS Ctrl liposomes (*P = 0.0339, **P = 0.0035, descending ***P = < 0.0001, 0.0003). c,d, Relative gene expression of miR-690 (M1 versus M1+Rosi, P = 0.0070, M1+Rosi versus M1+Rosi PPARy KD, P = 0.0090), its target gene Nadk (P = 0.0039,0.0353), and Pparg (P = 0.0258,0.0106), Cd36 (P = 0.0028,0.0126), as well as M2-macrophage marker genes (Mrc1, P = 0.006, < 0.0001, Mgl1, P = 0.0002,0.0037) (c) and M1-marker genes (Tnf, Il1b, *P = 0.0145, ***P = 0.0005 Infg, P = 0.0161, iNos, *P = 0.0113, **P = 0.0046) (d) in PPARy-deficient Rosi-treated M1 (M1+Rosi PPARy KD) BMDMs compared to Rosi-treated and untreated M1-BMDMs. e, Relative gene expression of miR-690 (descending p = 0.0010,< 0.0001,0.0001,0.0012,< 0.0001,0.0001) and Nadk (*P = 0.0287, descending ***P = 0.0004, < 0.0001) in L6 myotubes treated with M1+Rosi BMDM-sEVs compared to PBS Ctrl liposomes or M0-/M1-/M2-BMDM-sEV-treated L6 cells. f, Plasma miR-690 expression in Rosi-ATM-sEVs- or Rosi-treated mice and liver miR-690 (descending P = 0.0002, 0.0010, <0.0001, 0.0005) or Nadk (P = 0.0476,0.0488) expression in Rosi-ATM-sEVs-, HFD-ATM-sEVs-, PBS Ctrl liposomes-, or Rosi-treated mice. g, Relative gene expression of miR-690 (P < 0.0001) and Nadk (P = 0.0257,0.0481) in HFD islets treated with Rosi-ATM-sEVs compared to PBS Ctrl liposomes with and without miR-690 mimic, co-treatment of Rosi-ATM-sEVs and miR-690 antagomir, or Rosi-Dicer-KD-ATM-sEV treatment alone. Statistical data are expressed as mean ± s.e.m., with each data point representing a biologically independent cell replicate from one cohort (a,f), or representative of one (b–d) or two (g) independent experiments. *P < 0.05, **P < 0.01, ***P < 0.001, with an unpaired Mann-Whitney U-test with two-tailed distribution (a), with 2-way ANOVA, followed by Tukey’s multiple comparisons tests (b) or one-way ANOVA, followed by Tukey’s multiple comparisons tests (c-g).
Extended Data Fig. 10 |
Extended Data Fig. 10 |. miR-690 antagomir treatment does not induce changes in body weight or haematocrit levels but enhances AKT phosphorylation and regulates miR-690, Nadk expression in insulin target tissues.
Obese mice were fed with HFD for 10 weeks and were then treated for 4 weeks with 3 mg kg−1 d−1 rosiglitazone (Rosi) and with miR-690 antagomir compared to Rosi, HFD, and Chow control mice: a, Effects of miR-690 antagomir treatment on insulin-stimulated AKT phosphorylation in muscle and liver. b, Relative gene expression of miR-690 (Chow versus Rosi+miR-690 antagomir, P = 0.0107, Rosi versus Rosi+miR-690 antagomir, P = 0.0445) and its target Nadk (**P = 0.0055, *P = 0.0164) and NAD+ levels (P = 0.0408,0.0184) in the liver. c, miR-690 and Nadk expression in muscle (miR-690, P = 0.0388, Nadk, descending P = 0.0399,0.0181,0.0367,0.0174) and pancreas (miR-690, *P = 0.0432, **P = 0.0052, Nadk, P = 0.0391). d, Body weight (**P = 0.0039, ***P < 0.0001), haematocrit (descending P = 0.0019, 0.0016), and total cholesterol levels (values detected as < 100 are shown as 100, *P < 0.0001, ***P = < 0.0001, 0.0009) in the plasma. Statistical data are expressed as mean ± s.e.m., with each data point representing a biologically independent mouse from one cohort. Data is representative of one cohort. *P < 0.05, **P < 0.01, ***P < 0.001, with one-way ANOVA, followed by Tukey’s multiple comparisons tests.
Fig. 1 |
Fig. 1 |. Rosiglitazone enhances glucose tolerance and insulin sensitivity in obese mice and lowers adipose tissue inflammation.
Wild-type mice were fed HFD for 4 months (4 m) and were treated for the last month with 3 mg kg−1 d−1 Rosi compared to HFD and chow control mice. a, Body weight (chow, n = 23; HFD, n = 22; Rosi, n = 27; P < 0.0001). b, ipGTT (n = 31, 32 and 33; P0 min = 0.0002, P10–120 min < 0.0001) with fasting blood glucose levels and AUC (P < 0.0001). c,d, ITT (n = 28, 30 and 31; P < 0.0001) with incremental AUC (chow versus HFD, P = 0.0004; HFD versus Rosi, P < 0.0001) (c) and insulin levels (n = 8 per group, P < 0.0001) (d). e,f, Percentage of total epidydimal ATMs as live single SVCs (n = 21, 23 and 21; ***P < 0.0001, **P = 0.0043) and absolute numbers per gram (no. per g) (n = 19, 20 and 19, descending P = 0.0013, 0.0011, <0.0001) (e) and the percentage of their ATM subsets (n = 21, 23 and 21, P < 0.0001). Double negative (DN), CD11c+CD206 monocyte-derived, CD11c+CD206low ‘M1-like’ and CD11cCD206high ‘M2-like’ ATMs (f). g,h, Percentage (chow versus HFD/Rosi; P < 0.0001; HFD versus Rosi; P = 0.0001) and absolute numbers of CD9+ (**P = 0.0046, ***P < 0.0001) (g) or CD9+Trem2+ LAMs (percentage, **P = 0.0012, ***P < 0.0001; number, chow versus Rosi; P = 0.0008, other ***P < 0.0001) (n = 21, 23 and 21) (h). Statistical data are expressed as mean ± s.e.m. with each data point representing a biologically independent mouse from two (a) or three (bh) independent cohorts. *P < 0.05, **P < 0.01, ***P < 0.001. For measurements over several time points, a two-way ANOVA (body weight (a), GTT (b), ITT (c) and insulin (d)) and for others, a one-way ANOVA (b,c,e–h), followed by Tukey’s multiple comparisons tests, was used.
Fig. 2 |
Fig. 2 |. Rosi treatment alters the transcriptomic profile of ATMs.
scRNA-seq of epidydimal SVCs from wild-type 4-month HFD/obese mice treated for the last month with 3 mg kg−1d−1 Rosi compared to HFD control mice. a, Uniform Manifold Approximation and Projection (UMAP) embedding of SVCs. b, Proportion of pre-adipocytes and macrophages relative to all SVCs. c, Volcano plots showing the differential expression for the macrophage cluster between Rosi compared to HFD. Up- or downregulated genes, when significant at 0.05% FDR threshold and absolute log2 fold change > 0.58. d, UMAP of macrophage subclusters: monocyte-derived (Mac5), ‘M1-like’ (Mac3), LAMs/Mac2 and ‘M2-like’ ATMs (Mac1 and Mac4). e, Percentage of macrophage subclusters of SVCs. f, Pseudotime analysis of macrophages starting at Mac1. The trajectory of Mac1 ATMs toward the main ‘M2-like’ ATM cluster (Mac4) is shown. Data represent three biologically independent mice from one experiment (n = 3 per group). Data (b,e) are mean ± s.e.m. and brackets indicate statistical significance; otherwise, nonsignificant (NS) is stated. ‘log10(P)’ is the enrichment P value in log10, analysed by a two-tailed Wilcoxon rank-sum test (c).
Fig. 3 |
Fig. 3 |. ATM-sEVs from Rosi-treated obese mice improve glucose tolerance and insulin sensitivity in vivo.
Obese mice were fed with HFD for 10 weeks and were then treated for 4 weeks with Rosi-ATM-sEVs, HFD-ATM-sEVs or PBS Ctrl liposomes compared to the Rosi diet. a, Body weight (HFD + PBS liposomes, n = 15; HFD-ATM-sEVs, n = 15; Rosi-ATM-sEVs, n = 15; Rosi diet, n = 14; **P = 0.0058, ***P < 0.0001). b, ipGTT (n = 10, 9, 10, 10; HFD-ATM-sEVs versus PBS liposomes, P = 0.0026, 0.0020, <0.0001, 0.0001, 0.0001; Rosi-ATM-sEVs versus HFD-ATM-sEVs, P < 0.0001) with fasting glucose levels (HFD-sEVs versus PBS, P = 0.0155; HFD-sEVs versus Rosi, P < 0.0001; Rosi-sEVs versus HFD-sEVs, P = 0.0004; Rosi-sEVs versus Rosi, P = 0.0103; Rosi versus PBS, P = 0.0002) and AUC (HFD-sEVs versus PBS, P = 0.0002; HFD-sEVs versus Rosi-sEVs/Rosi, P < 0.0001; Rosi versus PBS, P = 0.0007). c,d, ITT (n = 10 per group; HFD-sEVs versus PBS, P = 0.0081, <0.0001, <0.0001, 0.0014, 0.0450; Rosi-sEVs versus HFD-sEVs, P < 0.0001; normalized ITT: HFD-sEVs versus PBS, P = 0.0211; Rosi-sEVs versus HFD-sEVs, P < 0.0001, <0.0001, 0.0002), incremental AUC (Rosi-sEVs versus HFD-sEVs, P = 0.0002; other, ***P <0.0001) (c) and insulin levels (n = 9, 9, 10 and 10; ###P < 0.0001, #P = 0.0309, Pδ = 0.0046, 0.0383) (d). e, Effects of sEVs and Rosi treatment on insulin-stimulated AKT phosphorylation in muscle, epididymal fat and liver (Rosi-sEVs versus HFD-sEVs, P = 0.0286). f, Plasma adiponectin (descending P = 0.0096, 0.0307, 0.0025), total cholesterol (P = 0.0006, 0.0002, 0.0331), triglyceride (TG) levels (P = 0.0231, 0.0270; four Rosi mice with TG < 45). g, Body weight (P = 0.001, 0.0071, 0.0041) and plasma haematocrit levels (P = 0.0020, 0.0020, 0.0002). Statistical data are expressed as mean ± s.e.m., with each data point representing a biologically independent mouse from one cohort. For comparison between HFD-ATM-sEVs versus PBS liposomes: *P < 0.05, **P < 0.01, ***P < 0.001 or Rosi-ATM-sEVs versus HFD-ATM-sEVs: #P < 0.05, ##P < 0.01, ###P < 0.001 (b–d). For measurements over several time points, a two-way ANOVA (body weight (a), GTT (b), ITT (c) and insulin (d)) and for others, a one-way ANOVA (b–d,f,g), followed by Tukey’s multiple comparisons tests or while comparing Rosi versus HFD an unpaired Mann–Whitney U-test with two-tailed distribution (e), was used.
Fig. 4 |
Fig. 4 |. Rosi BMDM-sEVs enhance insulin sensitivity in vitro.
a–e, Effects of Rosi-M1-BMDM-sEVs on glucose uptake and insulin-stimulated AKT Ser473 phosphorylation in 3T3-L1 adipocytes (a,d) (descending order of P values, P = <0.001, 0.0072, <0.001, <0.001, 0.0142) or L6 myotubes (P = <0.0001, 0.0035, <0.0001, <0.0001, 0.0434) (b,e) and on glucose production in primary hepatocytes isolated from lean mice (c) (PBS Ctrl, P = 0.0006; M0, P = 0.0103, 0.0007; M1, P = <0.0001, 0.0170; M1 + Rosi versus M1, P = 0.0323, 0.0019) compared to M1, M0 BMDM-sEVs and PBS Ctrl liposomes. Statistical data are expressed as mean ± s.e.m., with each data point showing a biologically independent cell replicate, representative of one experiment out of one (c) or three (a,b) independent experiments. *P < 0.05, **P < 0.01, ***P < 0.001, with a two-way ANOVA, followed by Tukey’s multiple comparisons tests. M1 + Rosi BMDM-sEVs, small extracellular vesicles from M1 bone-marrow-derived macrophages that were treated with 10 μM Rosi in vitro. c.p.m., counts per minute.
Fig. 5 |
Fig. 5 |. Rosi-ATM-sEVs directly enhance insulin-stimulated glucose uptake, hepatocyte insulin sensitivity and GSIS in vitro.
a–d, Effects of Rosi-ATM-sEVs on glucose uptake and insulin-stimulated AKT phosphorylation of 3T3-L1 adipocytes (a,c) (basal, P = 0.0079; insulin, descending P = <0.0001, 0.0078, <0.0001) or L6 myotubes (b,d) (basal, P = 0.0020, 0.0234; insulin, P < 0.0001). c.p.m., counts per minute. e,f, Glucose production in primary hepatocytes isolated from lean mice (e) (glucagon, P = 0.0048, 0.0093; glucagon + insulin, P = 0.0002, <0.0001) or a lean individual (f) (glucagon, P = 0.0079, <0.0001; glucagon + insulin, P = < 0.0001, 0.0002) treated with Rosi-ATM-sEVs compared to HFD-ATM-sEVs and PBS Ctrl liposomes. g, Glucose uptake in PA-induced insulin-resistant L6 myotubes after incubation with Rosi-ATM-sEVs compared to PBS Ctrl liposomes (basal, P = 0.0304, 0.0280; insulin, P = <0.0001, 0.0005, <0.0001). h, Effects of Rosi-ATM-sEVs on GSIS in 9 months HFD/obese islets compared to HFD-ATM-sEVs and PBS Ctrl liposomes (P = 0.0001, <0.0001). i, GSIS in 3 months HFD/obese islets after exposure to a low dose of sEVs (~2 × 10⁷ sEVs per ten islets, 900 sEVs per β-cell), a middle dose (~5 × 10⁷ sEVs per ten islets, 2,250 per β-cell) and a high dose (~1 × 10⁸ sEVs per ten islets, 4,500 per β-cell) (descending P = <0.0001, 0.0019, 0.0001, 0.0044, 0.0427). j, Arginine (Arg)- and exendin-4 (Ex-4)-stimulated GSIS in 3 months HFD/obese islets after incubation with Rosi-ATM-sEVs or PBS liposomes (P16.7mM = 0.0244, P16.7 mM+Ex-4 = 0.0223). Statistical data are expressed as mean α s.e.m., with each data point showing a biologically independent cell replicate. *P < 0.05, **P < 0.01, ***P < 0.001, with two-way ANOVA, followed by Tukey’s multiple comparisons tests.
Fig. 6 |
Fig. 6 |. The microRNA cargo is responsible for the beneficial effects of Rosi-ATM-sEVs.
a, Efficiency of Dicer siRNA treatment on Rosi-ATMs. Dicer gene expression (P = 0.0004). b, Effects of miRNA-depleted Dicer-KD-Rosi-ATM-sEVs on glucose uptake in 3T3 adipocytes (basal, P = 0.0383, 0.0196; insulin, descending P = 0.0009, <0.0001, <0.0001) and L6 myotubes (basal, P = 0.0266; insulin, P = <0.0001, 0.0001) compared to Rosi-ATM-sEV and PBS Ctrl liposome treatment. c,d, Glucose production in primary hepatocytes isolated from obese mice (c) (glucagon, P = 0.0075, 0.0009; glucagon + insulin, P < 0.0001) or a patient with obesity (P < 0.0001) (d) treated with Dicer-KD-Rosi-ATM-sEVs compared to Rosi-ATM-sEVs and PBS Ctrl liposomes. e, GSIS of 3 months HFD/obese islets after treatment with Dicer-KD-Rosi-ATM-sEVs compared to Rosi-ATM-sEVs and PBS Ctrl liposomes (P2.8 mM = 0.0024, P16.7 mM < 0.0001). Statistical data are expressed as mean ± s.e.m., with each data point showing a biologically independent cell replicate, representative of one (b (3T3), c,d) or two (a, b (L6), e) independent experiments. *P < 0.05, **P < 0.01, ***P < 0.001, an unpaired Mann–Whitney U-test with two-tailed distribution (a) and for more than two groups, a two-way ANOVA, followed by Tukey’s multiple comparisons tests (b–e).
Fig. 7 |
Fig. 7 |. miR-690 is the key contributor to the metabolic effects of Rosi-ATM-sEVs.
a, Relative gene expression of miR-690 in visceral (eWAT, P = 0.0024) and subcutaneous (SubQ, *P = 0.0307, **P = 0.0086) Rosi-ATMs or Rosi-ATM-sEVs (P = 0.0286) compared to HFD-ATMs or HFD-ATM-sEVs and Chow-ATMs or Chow-ATM-sEVs. b, Relative gene expression of miR-690 in Dicer-KD-Rosi-ATMs compared to Rosi-ATM controls (P = 0.0015). c, Relative gene expression of miR-690 in M1 BMDMs treated with 10 μM Rosi in vitro, untreated M1-BMDMs, M2-BMDMs and M0-BMDMs (descending P = 0.0182, 0.0125, <0.0001, <0.0001, 0.0017) and their sEVs (P = <0.0001, 0.0072, 0.0031, 0.0043, <0.0001). d, Effects of PPARγ KD in Rosi-treated M1-BMDM-sEVs on glucose uptake of L6 myotubes (P = 0.0122, <0.0001, 0.0076, 0.0064). e, Effects of the miR-690 mimic and antagomir on glucose uptake in L6 myotubes compared to PBS Ctrl liposome treatment (P = 0.0017, 0.0020). f, Glucose uptake of L6 myotubes after cotreatment with Rosi-ATM-sEVs and the miR-690 antagomir compared to PBS Ctrl liposomes (P < 0.0001). PBS liposome values in e and f are the same, as it was the same experiment. g,h, Effects of the miR-690 antagomir on glucose production in primary hepatocytes isolated from obese mice (g) (glucagon, P = 0.0210; glucagon + insulin, P = 0.0051, < 0.0001) or a patient with obesity (glucagon, P = 0.0009, 0.0128; glucagon + insulin, P < 0.0001) (h) treated with Rosi-ATM-sEVs compared to Rosi-ATM-sEVs alone or PBS Ctrl liposomes. i, GSIS of 3 months HFD/obese islets after treatment with the miR-690 mimic, Rosi-ATM-sEVs alone, or co-treatment of Rosi-ATM-sEVs with the miR-690 antagomir compared to PBS Ctrl liposomes (P2.8 mM = 0.0024, P16.7 mM < 0.0001). Data points (i) of PBS liposomes and Rosi-ATM-sEVs are the same as in Fig. 6e, as the experiments were conducted in parallel. Statistical data are expressed as mean ± s.e.m., with each data point showing a biologically independent cell replicate, examined from two (b) or three cohorts (a) or representative for one (d,h) or two (c,e–g,i) independent experiments. *P < 0.05, **P < 0.01, ***P < 0.001, an unpaired Mann–Whitney U-test with two-tailed distribution (a (sEVs), b) and for comparison of more than two groups one-way (a,c) or two-way ANOVA (d–i), followed by Tukey’s multiple comparisons tests.
Fig. 8 |
Fig. 8 |. miR-690 antagomir treatment of Rosi mice indicates that miR-690 is a mediator of the in vivo effects of Rosi.
Obese mice were fed with HFD for 10 weeks and were then treated for 4 weeks with 3 mg kg−1d−1 Rosi and with miR-690 antagomir compared to Rosi, HFD and chow control mice. a, Body weight (chow, n = 10; HFD, n = 10; Rosi, n = 9; Rosi + miR-690 antagomir, n = 9). b, ipGTT (n = 10, 10, 9 and 9, P = <0.0001, 0.0065, 0.0441) with fasting glucose levels (P < 0.0001) and incremental AUC (*P = 0.0426, **P = 0.0049). c,d, ITT (n = 10, 10, 10 and 9, P = 0.0162, 0.0072, 0.0162) with the incremental AUC (descending P = <0.001, 0.0063, <0.0001, 0.0026) (c) and insulin levels (P0 min = 0.0014; fasting, *P = 0.0400, **P = 0.0054, ***P < 0.0001) (d). e, Effects of miR-690 antagomir treatment on insulin-stimulated AKT phosphorylation in epididymal fat (descending P = 0.0003, <0.0001, <0.0001, 0.0001), liver (P = 0.0278, 0.0025, 0.0017, 0.0410) and muscle (**P = 0.0017, ***P < 0.0001). f, Relative gene expression of pro-inflammatory cytokines in CD11b+F4/80+ sorted epidydimal ATMs (Il1b, P = 0.0062, 0.0131, 0.0390; Tnf, P = 0.0333). ND, not determined. g, Relative gene expression of miR-690 (P = 0.0002, 0.0289, 0.0012, 0.0092) and its target Nadk (P = 0.0059, 0.0190, 0.0371) in ATMs. Statistical data are expressed as mean ± s.e.m., with each data point representing a biologically independent mouse examined from one cohort. For comparison between Rosi + miR-690 antagomir versus Rosi diet in GTT (b), ITT (c) and for insulin levels (d) over time, *P < 0.05, **P < 0.01, ***P < 0.001. For measurements over several time points, a two-way ANOVA (BW (a), GTT (b), ITT (c) and insulin (d)) and for others, a one-way ANOVA (b–g), followed by Tukey’s multiple comparisons tests, was used.

References

    1. Nianogo RA & Arah OA Forecasting obesity and type 2 diabetes incidence and burden: the ViLA-obesity simulation model. Front. Public Health 10, 818816 (2022). - PMC - PubMed
    1. Lee YS & Olefsky J. Chronic tissue inflammation and metabolic disease. Genes Dev. 35, 307–328 (2021). - PMC - PubMed
    1. Rohm TV, Meier DT, Olefsky JM & Donath MY Inflammation in obesity, diabetes, and related disorders. Immunity 55, 31–55 (2022). - PMC - PubMed
    1. Xu H. et al. Chronic inflammation in fat plays a crucial role in the development of obesity-related insulin resistance. J. Clin. Invest 112, 1821–1830 (2003). - PMC - PubMed
    1. Weisberg SP et al. Obesity is associated with macrophage accumulation in adipose tissue. J. Clin. Invest 112, 1796–1808 (2003). - PMC - PubMed

Grants and funding