. 2024 May;25(5):2391-2417.
doi: 10.1038/s44319-024-00125-6. Epub 2024 Apr 11.

Phosphorylation of ELYS promotes its interaction with VAPB at decondensing chromosomes during mitosis

Affiliations

Phosphorylation of ELYS promotes its interaction with VAPB at decondensing chromosomes during mitosis

Christina James et al. EMBO Rep. 2024 May.

Abstract

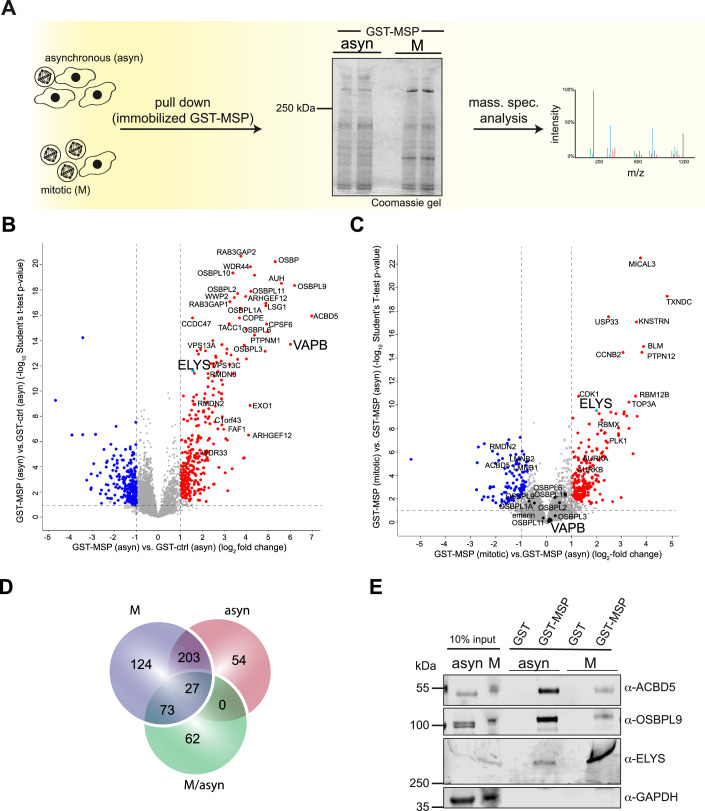
ELYS is a nucleoporin that localizes to the nuclear side of the nuclear pore complex (NPC) in interphase cells. In mitosis, it serves as an assembly platform that interacts with chromatin and then with nucleoporin subcomplexes to initiate post-mitotic NPC assembly. Here we identify ELYS as a major binding partner of the membrane protein VAPB during mitosis. In mitosis, ELYS becomes phosphorylated at many sites, including a predicted FFAT (two phenylalanines in an acidic tract) motif, which mediates interaction with the MSP (major sperm protein)-domain of VAPB. Binding assays using recombinant proteins or cell lysates and co-immunoprecipitation experiments show that VAPB binds the FFAT motif of ELYS in a phosphorylation-dependent manner. In anaphase, the two proteins co-localize to the non-core region of the newly forming nuclear envelope. Depletion of VAPB results in prolonged mitosis, slow progression from meta- to anaphase and in chromosome segregation defects. Together, our results suggest a role of VAPB in mitosis upon recruitment to or release from ELYS at the non-core region of the chromatin in a phosphorylation-dependent manner.

Keywords: ELYS; FFAT-motif; Mitosis; Nuclear Envelope; VAPB.


Conflict of interest statement

The authors declare no competing interests.

Figures

Figure 1
Figure 1. ELYS is a major interaction partner of VAPB in mitosis.
(A) HeLa cells were synchronized using DME and cellular lysates obtained from asynchronous (asyn) and mitotic cells (M) were incubated with GST or GST-MSP immobilized on GST-selector beads. The Coomassie gel shows two lanes each of proteins that had been eluted from the beads with SDS-sample buffer. Similar samples were also analyzed by MS-DIA. (B) MS-DIA-results comparing proteins from asynchronous cells bound to GST or GST-MSP. The graph shows the combined results of four independent experiments with two technical replicates each. A two-sided Student’s T-test was performed using normalized log2 ratios. For the analysis, a Permutation-based FDR was applied and a threshold value of 0.05 was chosen. Proteins enriched on GST-MSP beads are depicted in red. (C) MS-DIA-results comparing proteins from asynchronous and mitotic cells bound to GST-MSP. The graph shows the combined results of four independent experiments with two technical replicates each. A two-sided Student’s T-test was performed using normalized log2 ratios. For the analysis, a Permutation-based FDR was applied and a threshold value of 0.05 was chosen. Proteins from mitotic lysates that are enriched on GST-MSP beads are depicted in red. (D) Venn diagram summarizing the results of different analyses: proteins from mitotic cells (M, blue circle; compare Fig. EV1) or asynchronous (asyn, red circle; as in (B)) specifically enriched on GST-MSP- versus GST-beads. Green circle, proteins from mitotic cells enriched on GST-MSP-beads compared to proteins from asynchronous cells; as in (C)). Individual proteins are also listed in Datasets EV1–4. (E) Cell lysates (10% input) and proteins eluted from GST-beads were obtained as in (A) and analyzed by SDS-PAGE followed by Western blotting, detecting ACBD5, OSBPL9, and ELYS. GAPDH was used as loading control. Source data are available online for this figure.
Figure 2
Figure 2. Binding of VAPB to ELYS is regulated by phosphorylation.
(A) HeLa Flp-In T-REx cells with stable expression of GFP-VAPB were treated with or without (-tet) tetracycline to induce expression. Cells were then synchronized either in the G1/S phase by a double thymidine block or in mitosis (M) by treatment with DME. Total cell lysates obtained from asynchronous (asyn) or synchronized (G1/S and M) cells were subjected to co-immunoprecipitation (IP) using the GFP-Selector. Cell synchronization at G1/S phase and mitosis was confirmed by staining for Cyclin E and phospho-Histone H3, respectively. (B) Quantification of ELYS protein levels in the bound fraction after immunoprecipitation from three independent experiments as in (A) (symbols in black, orange, and pink). Maximum protein levels coprecipitated from mitotic lysates were assigned an arbitrary value of 1. The data are shown as mean ± standard deviation (n  =  3; biological replicates). ***p = 0.0004, *p < 0.0323, ns, non-significant, p = 0.0527 (Bonferroni’s multiple comparisons test). (C) HeLa cells were treated as in A to obtain asynchronous or mitotic lysates, which were subjected to co-IP using antibodies against VAPB or purified IgG as a control. (A, B) Precipitated proteins were analyzed by SDS-PAGE, followed by Western blotting using antibodies against GFP, ELYS, VAPB, and GAPDH as indicated. Note the slower migrating form of ELYS in mitotic lysates. (D) Purified proteins (GST, the wild type MSP-domain of VAPB (GST-MSP) and the KD/MD mutant of MSP (GST-MSP-KD/MD) were immobilized on GST-Selector beads and incubated with lysates from asynchronous (asyn) or mitotic (M) HeLa cells. Interacting proteins were analyzed by SDS-PAGE, followed by Western blotting using antibodies against ELYS. (E) Lysates from asynchronous (asyn) or mitotic (M) HeLa cells were treated with (+) or without (-) λ-phosphatase (λPP) and incubated with purified proteins (GST or GST-MSP) bound to GST Selector agarose beads. Interacting proteins were analyzed by SDS-PAGE, followed by Western blotting using antibodies against ELYS. (F) Quantification of ELYS binding to GST-MSP with or without λPP treatment normalized to the input protein levels from three independent experiments as in (E) (symbols in black, orange, and pink). The data are shown as the mean (± standard deviation) of three biological replicates. ****p < 0.0001, ***p = 0.0001 (Sidak’s multiple comparisons test). Source data are available online for this figure.
Figure 3
Figure 3. VAPB-ELYS interactions are mediated by FFAT- and phospho-FFAT motifs.
(A) Schematic representation of the domain structure of ELYS. The predicted FFAT motifs are shown in blue, purple and brown with the respective sequences and FFAT scores (the lower the score, the more similar it is to the conventional FFAT motif) below (with six acidic tract residues and seven core residues). The AT-hook is shown in orange. (B) Sequences of ELYS-, OPR1- and negative control peptides used for pull down assays. Peptides contain biotin at the N-terminus, a linker sequence (GAMR) and the FFAT sequences of ELYS (FFAT-1 and FFAT-3, either with or without phosphorylated serine- (pS) or threonine (pT) residue at position 4 of the core motif, and non-phosphorylated FFAT-2). The ORP1-peptide (amino acid residues 469-485) was used as a positive and a random peptide as a negative control. (C) Peptides as in B were immobilized on beads and incubated with total HeLa-cell lysate. Interacting proteins were analyzed by SDS-PAGE, followed by Western blotting using antibodies against VAPB or tubulin. (D) Peptides as in B were immobilized on beads and incubated with purified proteins (GST, the wild type MSP-domain of VAPB (GST-MSP), the KD/MD mutant (GST-MSP-KD/MD) or the K43L mutant of the MSP-domain (GST-MSP-K43L). Interacting proteins were analyzed by SDS-PAGE and Coomassie-staining. 10% of the input of the recombinant proteins were loaded as indicated. Source data are available online for this figure.
Figure 4
Figure 4. Phosphorylation of serine 1314 in the acidic tract of FFAT-2 enhances the interaction of ELYS with VAPB.
(A) Lysates from asynchronous and mitotic HeLa cells were subjected to pull down reactions using the MSP-domain of VAPB bound to GST Selector (compare Figs. 1E and 2D). The bound proteins were subjected to in-solution digestion with trypsin (Hughes et al, 2019) and analyzed by mass spectrometry to identify phosphorylation sites. Phosphorylation sites identified by mass spectrometry (orange lines; see also Dataset EV5) as well as sites that had been identified before (Hornbeck et al, ; Sharma et al, ; Ullah et al, 2016); black lines) are indicated on the ELYS protein. Two phospho-serine sites (S1314 and S1326) are within the FFAT-2-motif. (B) Sequences of the ELYS-peptides used for pull down assays. Peptides contain biotin at the N-terminus, a linker sequence and the FFAT-2 motif either with or without phosphorylated serine-residues at position 1314 and/or 1326 or alanine residues at these positions. A random peptide served as negative control. (C) Peptides as in C were immobilized and incubated with total HeLa cell lysates. Bound proteins were analyzed by SDS-PAGE, followed by Western blotting using antibodies against VAPB and tubulin. (D) Quantification of experiments as in (C) (dots in gray, blue, and magenta). VAPB-binding to FFAT-peptides was normalized to non-phosphorylated FFAT-2. The data are shown as the mean (± standard deviation) of three independent biological replicates. **p = 0.0030, **p = 0.0012, **p = 0.0012 (p values from left to right; Tukey’s multiple comparisons test). (E) Peptides as in C were immobilized and incubated with GST or GST-tagged wild type (GST-MSP) or the mutant version (GST-MSP KD/MD) of the MSP-domain. Bound proteins were analyzed by SDS-PAGE and Coomassie staining. The input fractions are loaded as indicated. (F) Quantification of three independent experiments as in (E) (dots in gray, blue, and magenta). GST-MSP-binding to FFAT-peptides was normalized to non-phosphorylated FFAT-2. The data are shown as the mean (± standard deviation) of three biological replicates). *p = 0.0276, *p = 0.0413, *p = 0.0388 (p values from left to right; Tukey’s multiple comparisons test). Source data are available online for this figure.
Figure 5
Figure 5. Interaction of ELYS-fragments with VAPB.
(A) Scheme of the fragments His-ELYS(1018-1642)-MBP, purified from bacteria and used in (B) and (C). (B) Different versions of His-ELYS(1018-1642)-MBP (wild-type (WT), S1314A, S1314D, S1326A, and S1326D) were immobilized on MBP-selector beads and incubated with GST-MSP-VAPB or GST as a control. Bound proteins were eluted with SDS-sample buffer and analyzed by SDS-PAGE, followed by Coomassie staining. (C) Quantification of three independent experiments (dots in black, orange, and pink) as in (B). MSP-VAPB binding to different ELYS(1018-1642) versions was normalized to the WT version. The data are shown as the mean (± standard deviation) of the three biological replicates). **p = 0.0032 (Holm-Sidak’s multiple comparisons test). (D) Scheme of the fragments GFP-ELYS(1018-1642) used for transfection experiments as in (E) and (F). (E) Stable cell lines expressing different versions of GFP-ELYS(1018-1642) were treated with or without (-tet, for wild-type (WT) tetracycline and synchronized with DME to accumulate cells in mitosis. Cell lysates were subjected to co-immunoprecipitation experiments using GFP-selector beads. Proteins in the input lysates (left) and proteins eluted from the beads were analyzed by SDS-PAGE, followed by Western blotting detecting GFP and VAPB. GAPDH was used as loading control. (F) Quantification of four independent experiments (dots in black, blue, orange, and pink) as in (E). VAPB binding to different ELYS(1018-1642) versions was normalized to the WT version. The data are shown as the mean (± standard deviation) of four biological replicates). *p = 0.0457; **p = 0.0038; ***p = 0.0003 (Tukey’s multiple comparisons test). Source data are available online for this figure.
Figure 6
Figure 6. VAPB localizes to the non-core regions on mitotic chromosomes.
(A) Intracellular localization of VAPB in interphase, prophase, metaphase, anaphase, and telophase. HeLa P4 cells were synchronized by double thymidine block and released for 9 h before fixing and staining with antibodies against VAPB. DNA was stained with DAPI and cells were analyzed by confocal microscopy. Scale bar, 10 µm. (B) Schematic representation of anaphase cell with core (blue) and non-core (magenta) nuclear envelope (NE) subdomains. Green lines indicate ER-membranes. (C) HeLa Flp-In T-REx cells stably expressing GFP-VAPB were synchronized and released as in (A) and subjected to indirect immunofluorescence staining using antibodies against LBR, emerin, and ELYS. DNA was stained with DAPI and cells were analyzed by confocal microscopy. Scale bar, 10 µm. Arrows indicate the core and non-core NE subdomains, respectively. (D) HeLa Flp-In T-REx cells stably expressing HA-VAPB were synchronized and released from thymidine block as described in (A) and subjected to PLAs using antibodies against HA and ELYS. HA-VAPB and ELYS were detected by indirect immunofluorescence. Intranuclear signals as observed for example in prophase could derive from extended ER-cisternae (Lu et al, 2011). DNA was stained with DAPI and cells were analyzed by confocal microscopy. Scale bar, 10 µm. Source data are available online for this figure.
Figure 7
Figure 7. The MSP-domain of VAPB affects its interaction with ELYS in anaphase.
(A) Stable cell lines expressing wild-type (WT) HA-VAPB or the KD/MD-mutant version were subjected to double thymidine block and release for synchronization. Cells in interphase (top (double) rows) or in anaphase (four lower rows) were then analyzed by PLAs, detecting proximities between HA-VAPB and OSBPL9 (first and second row), and HA-VAPB and ELYS (third row), LBR (fourth row), and emerin (last row), respectively. The specificity of PLA signals and the antibodies used was validated by single antibody controls (Fig. EV3). Scale bar, 10 µm. (B) Quantification of PLA interactions as detected in (A). First graph, total cellular interactions in 53 cells; remaining graphs, PLA interactions around chromatin, analyzing a total of 35, 42, 40, and 32 anaphase cells (i.e., 2n chromatin regions), respectively. The data are shown as the mean (± standard deviation) of three biological replicates). ****p < 0.0001 (two-tailed unpaired parametric t-test). PLA signals were quantified using Cell Profiler (Carpenter et al, 2006). A region around the chromatin was defined by the DAPI signal and by the ExpandorShrinkObjects function with a pixel number of 4 for expansion. The PLA signals were then calculated by the pipeline. Black, orange and pink dots represent individual data of three biological replicates. Source data are available online for this figure.
Figure 8
Figure 8. Depletion of VAPB delays mitosis and leads to chromosome segregation defects.
(A) Stable cell lines expressing different versions of GFP-ELYS(1018-1642) were treated with (+tet) or without (-tet) tetracycline for 16 h and harvested. Cells were then analyzed by flow cytometry using propidium iodide. The bar graph shows the quantification of three independent experiments (individual data in green, red, and pink), depicting the percentage of G2/M cells. The data are shown as the mean (± standard deviation) of three biological replicates. *p = 0.0231 (Tukey’s multiple comparisons test). See Appendix Fig. S3 for flow cytometry data. (B) HeLa P4 cells were treated with siRNAs against VAPB (siVAPB) or non-targeting siRNAs (sint) and analyzed by indirected immunofluorescence, detecting endogenous VAPB, and confocal microscopy. Scale bar, 10 µm. (C) Schematic representation of synchronization- and release steps for HeLa P4 cells after knocking down VAPB using siRNA. Cells were transfected using either non-targeting or siRNA against VAPB. (D) HeLa P4 cells were transfected with siRNAs against VAPB (siVAPB) or non-targeting siRNAs (sint) and synchronized and further treated as depicted in (C). Cells were then analyzed by flow cytometry using propidium iodide and antibodies against phospho-Histone H3. Gated mitotic cells are observed in the upper right quadrant. (E) Quantification of three independent experiments as in (D), depicting the percentage of mitotic cells as determined by flow cytometry. The data are shown as the mean (± standard deviation) of three biological replicates. (F) Live cell imaging of HeLa Flp-In T-REx cells stably expressing mCherry-H2B after knock down of VAPB. Cells transfected with either non-targeting siRNAs (sint) or siVAPB were synchronized by a double thymidine block. After releasing the block for 6 h, the cells were imaged every 2 min for a total of 2 h after the onset of mitosis. Examples from different phases of mitosis are shown. The arrows indicate lagging chromosomes. Scale bar, 10 µm. See also Movies EV1 and EV2. (G) Cells were treated as in (D) and the percentage of mitotic cells showing chromosome segregation defects were quantified from live cell imaging experiments performed as in (F). Error bars indicate the standard deviation from the mean of three independent experiments. ***p = 0.0006 (two-tailed unpaired parametric t-test). (H) Cells were treated as in F and the progression from metaphase to anaphase and from anaphase to telophase was measured using live cell imaging. Three independent experiments were performed (dots in gray, green and orange), analyzing a total of 26 cells for si nt and 27 cells for siVAPB. The data are shown as the mean (± standard deviation) of three biological replicates. ****p < 0.0001; ns, not significant, p = 0.9859 (Tukey’s multiple comparisons test). Source data are available online for this figure.
Figure EV1
Figure EV1. The MSP-domain of VAPB interacts with ELYS in mitosis.
(A) MS-DIA-results comparing proteins from mitotic cells bound to GST or GST-MSP. Proteins enriched on GST-MSP beads are depicted in red. The graph shows the combined results of four independent experiments with two technical replicates each. A two-sided Student’s T-test was performed using normalized log2 ratios. For the analysis, a Permutation-based FDR was applied, and a threshold value of 0.05 was chosen. (B) HEK293T-cells were subjected to a synchronization protocol and lysates from asynchronous (asyn) and mitotic (M) cells were obtained. Lysates were then incubated with immobilized GST or GST-MSP and bound proteins were analyzed by SDS-PAGE followed by Western blotting detecting ELYS. Compare Fig. 1E.
Figure EV2
Figure EV2. Specificity of VAPB-ELYS interactions in anaphase shown by knockdown of either VAPB or ELYS.
HeLa T-REx Flp-In cells stably expressing HA-VAPB were treated with siRNAs against VAPB (A) or ELYS (B) and synchronized and released as described in Fig. 6A and subjected to PLAs. Indirect immunofluorescence was performed to detect HA-VAPB and ELYS. Scale bar, 10 µm.
Figure EV3
Figure EV3
Single antibody controls using antibodies against HA, ELYS, LBR, emerin, and OSBPL9 to determine the specificity of PLA interactions. Scale bar, 10 µm.
Figure EV4
Figure EV4. Effects of knockdown of VAPA and VAPB in mitosis.
(A) HeLa P4 cells were transfected with siRNAs against VAPA (siVAPA) or VAPB (siVAPB) or non-targeting siRNAs (si nt) and synchronized and further treated as described in the legend to Fig. 8C. Cells were then analyzed by flow cytometry using propidium iodide and antibodies against phospho-Histone H3. Mitotic cells are observed in the upper right quadrant. (B) Quantification of the results in (B), indicating the percentage of mitotic cells as determined by flow cytometry. The data are shown as the mean (± standard deviation) of three biological replicates. (C) HeLa P4 cells subjected to knock down of VAPA or VAPB as indicated in (A) were analyzed by SDS-PAGE and Western blotting using antibodies against VAPA, VAPB, and tubulin. (D) Mutiple sequence alignment (MSA) of the FFAT2-motif of ELYS from Danio rerio, Xenopus laevis, Gallus gallus, Mus musculus, Rattus rattus, Homo sapiens, Bos taurus. Conservation of the amino acid residues are represented from 0 to 9 and *. Phosphorylation sites S1314 and S1326 are indicated by dotted red boxes. Jalview software (Waterhouse et al, 2009) was used to perform MSA.

References

    1. Afonso O, Matos I, Pereira AJ, Aguiar P, Lampson MA, Maiato H. Feedback control of chromosome separation by a midzone Aurora B gradient. Science. 2014;345:332–336. doi: 10.1126/science.1251121. - DOI - PMC - PubMed
    1. Anderson DJ, Hetzer MW. Nuclear envelope formation by chromatin-mediated reorganization of the endoplasmic reticulum. Nat Cell Biol. 2007;9:1160–1166. doi: 10.1038/ncb1636. - DOI - PubMed
    1. Anderson DJ, Vargas JD, Hsiao JP, Hetzer MW. Recruitment of functionally distinct membrane proteins to chromatin mediates nuclear envelope formation in vivo. J Cell Biol. 2009;186:183–191. doi: 10.1083/jcb.200901106. - DOI - PMC - PubMed
    1. Blethrow JD, Glavy JS, Morgan DO, Shokat KM. Covalent capture of kinase-specific phosphopeptides reveals Cdk1-cyclin B substrates. Proc Natl Acad Sci USA. 2008;105:1442–1447. doi: 10.1073/pnas.0708966105. - DOI - PMC - PubMed
    1. Bley CJ, Nie S, Mobbs GW, Petrovic S, Gres AT, Liu X, Mukherjee S, Harvey S, Huber FM, Lin DH, et al. Architecture of the cytoplasmic face of the nuclear pore. Science. 2022;376:eabm9129. doi: 10.1126/science.abm9129. - DOI - PMC - PubMed