. 2024 Apr 11;26(1):63.
doi: 10.1186/s13058-024-01815-8.

Chitin-mediated blockade of chitinase-like proteins reduces tumor immunosuppression, inhibits lymphatic metastasis and enhances anti-PD-1 efficacy in complementary TNBC models

Affiliations

Chitin-mediated blockade of chitinase-like proteins reduces tumor immunosuppression, inhibits lymphatic metastasis and enhances anti-PD-1 efficacy in complementary TNBC models

Robbe Salembier et al. Breast Cancer Res. .

Abstract

Background: Chitinase-like proteins (CLPs) play a key role in immunosuppression under inflammatory conditions such as cancer. CLPs are enzymatically inactive and become neutralized upon binding of their natural ligand chitin, potentially reducing CLP-driven immunosuppression. We investigated the efficacy of chitin treatment in the context of triple-negative breast cancer (TNBC) using complementary mouse models. We also evaluated the immunomodulatory influence of chitin on immune checkpoint blockade (ICB) and compared its efficacy as general CLP blocker with blockade of a single CLP, i.e. chitinase 3-like 1 (CHI3L1).

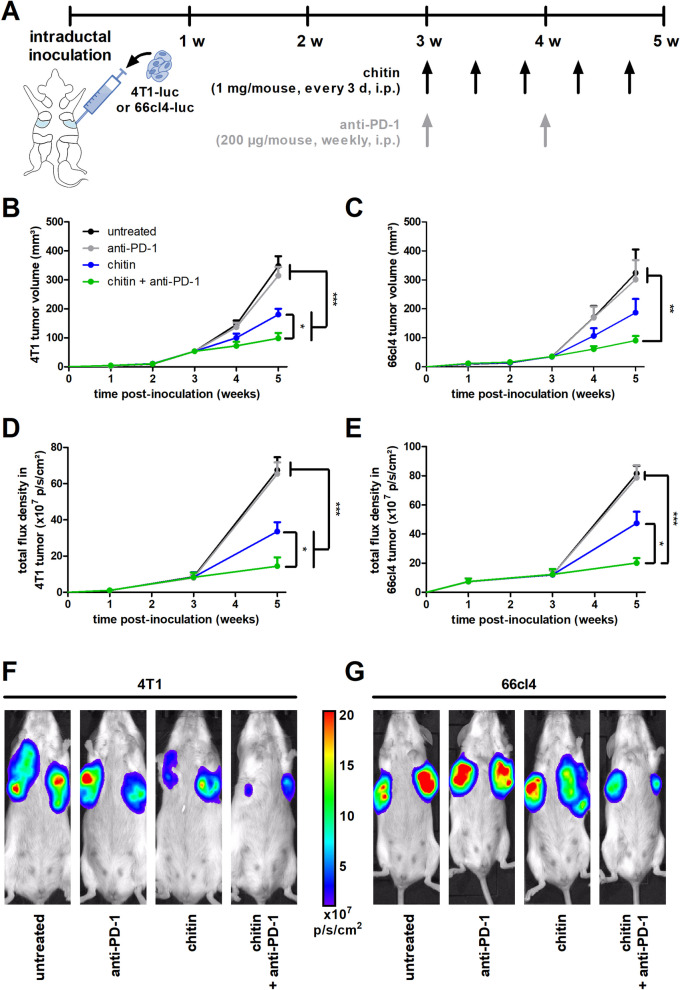
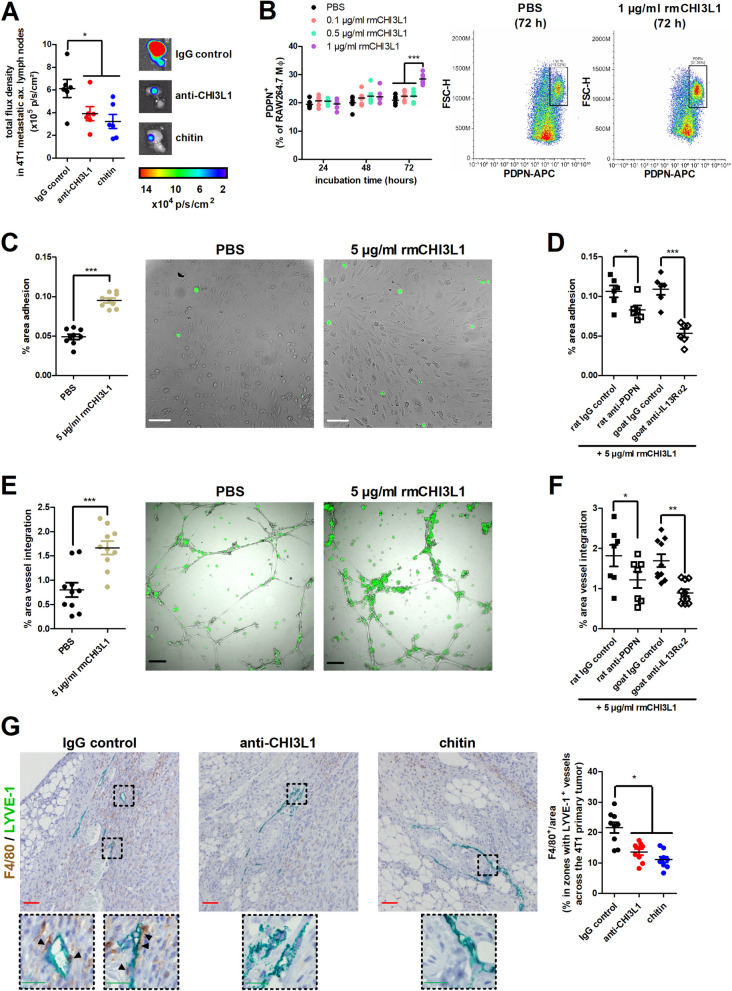
Methods: Female BALB/c mice were intraductally injected with luciferase-expressing 4T1 or 66cl4 cells and systemically treated with chitin in combination with or without anti-programmed death (PD)-1 ICB. For single CLP blockade, tumor-bearing mice were treated with anti-CHI3L1 antibodies. Metastatic progression was monitored through bioluminescence imaging. Immune cell changes in primary tumors and lymphoid organs (i.e. axillary lymph nodes and spleen) were investigated through flow cytometry, immunohistochemistry, cytokine profiling and RNA-sequencing. CHI3L1-stimulated RAW264.7 macrophages were subjected to 2D lymphatic endothelial cell adhesion and 3D lymphatic integration in vitro assays for studying macrophage-mediated lymphatic remodeling.

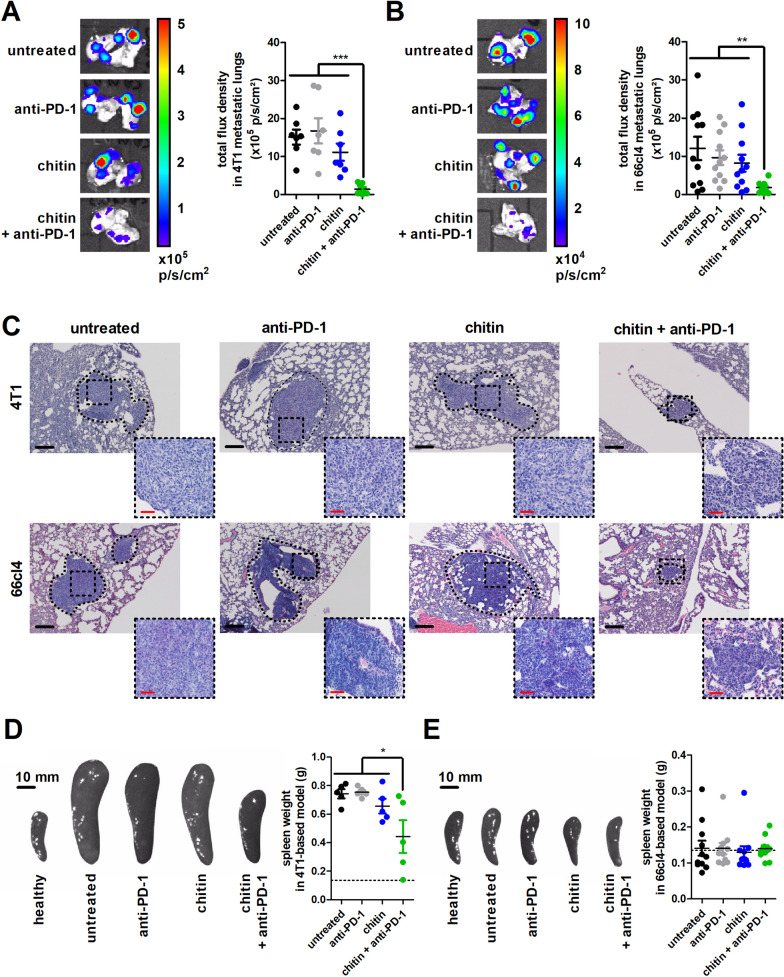
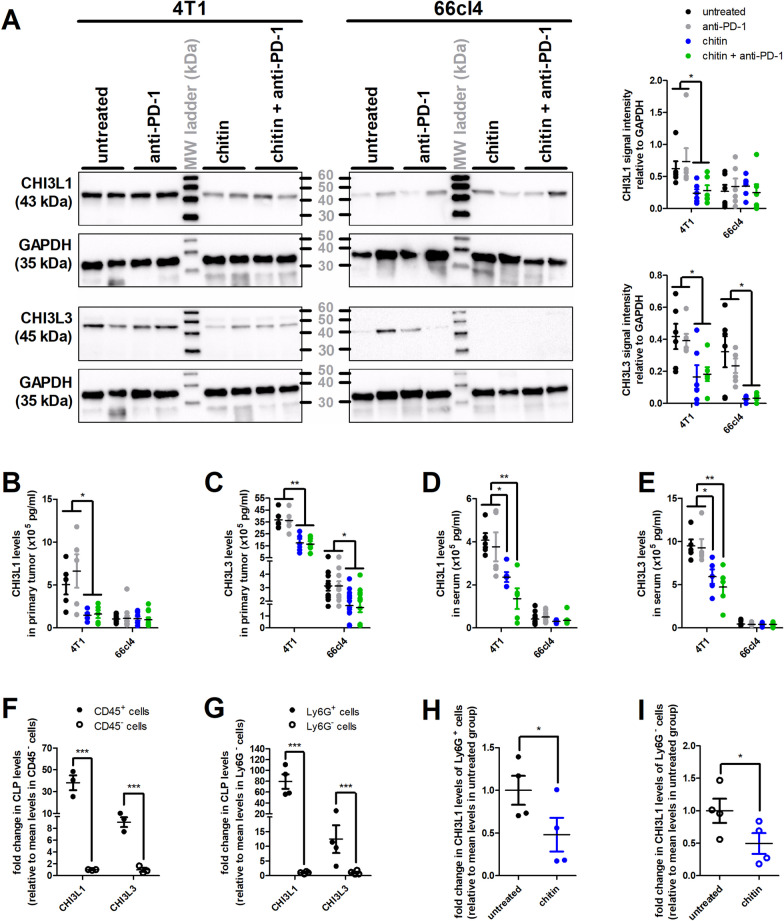
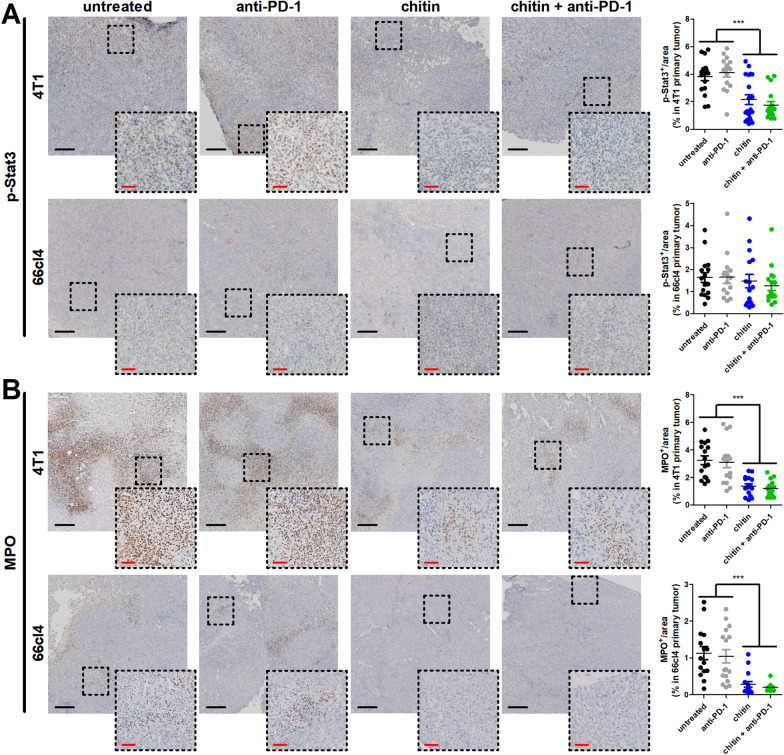
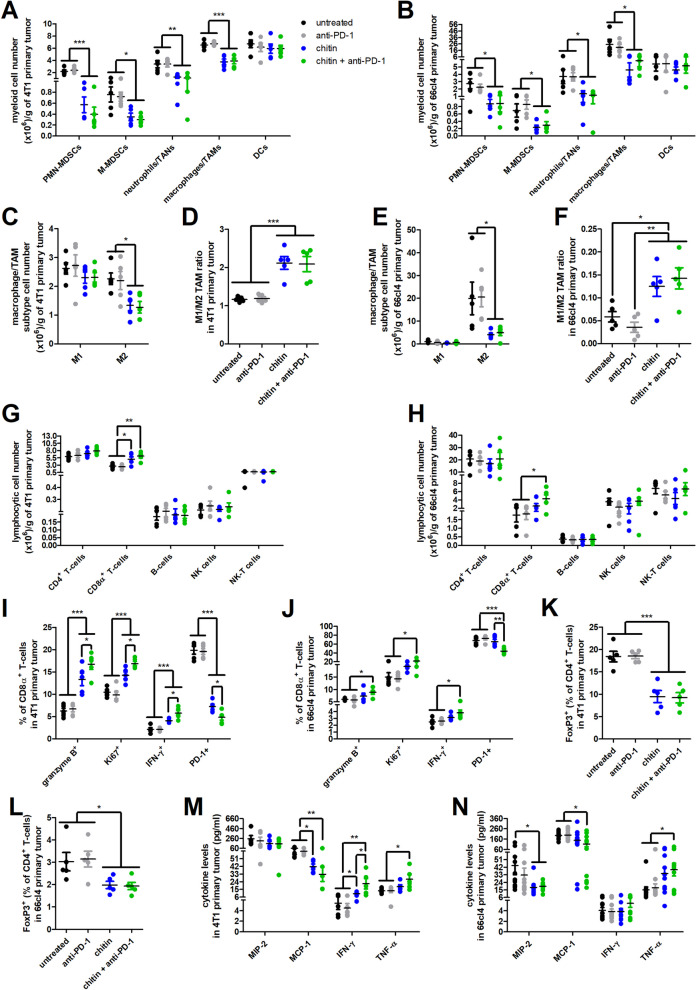
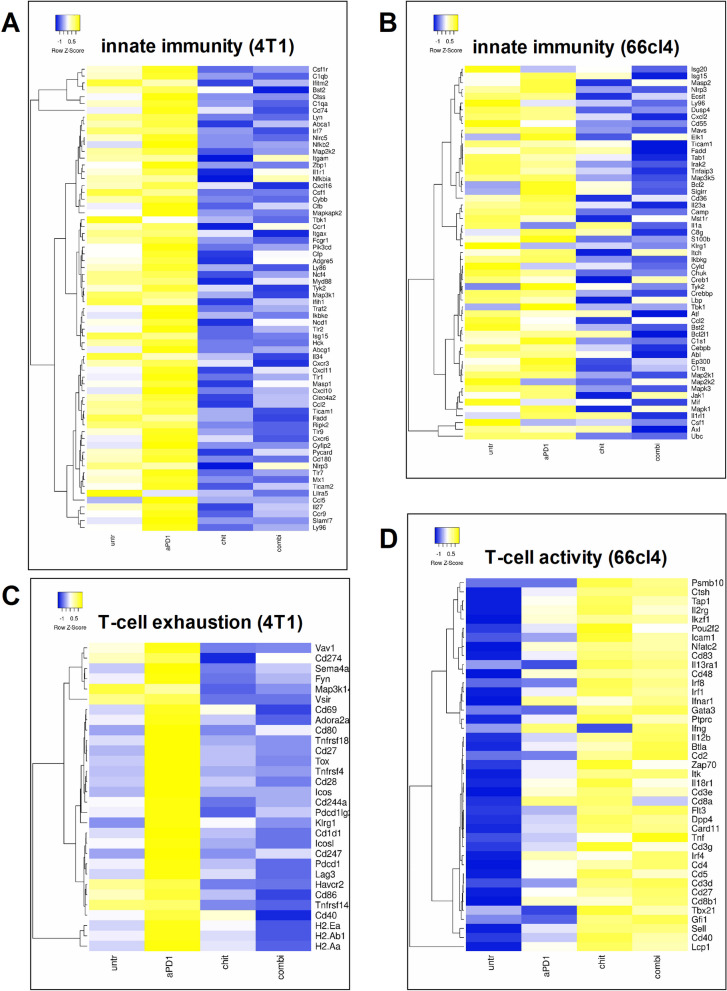
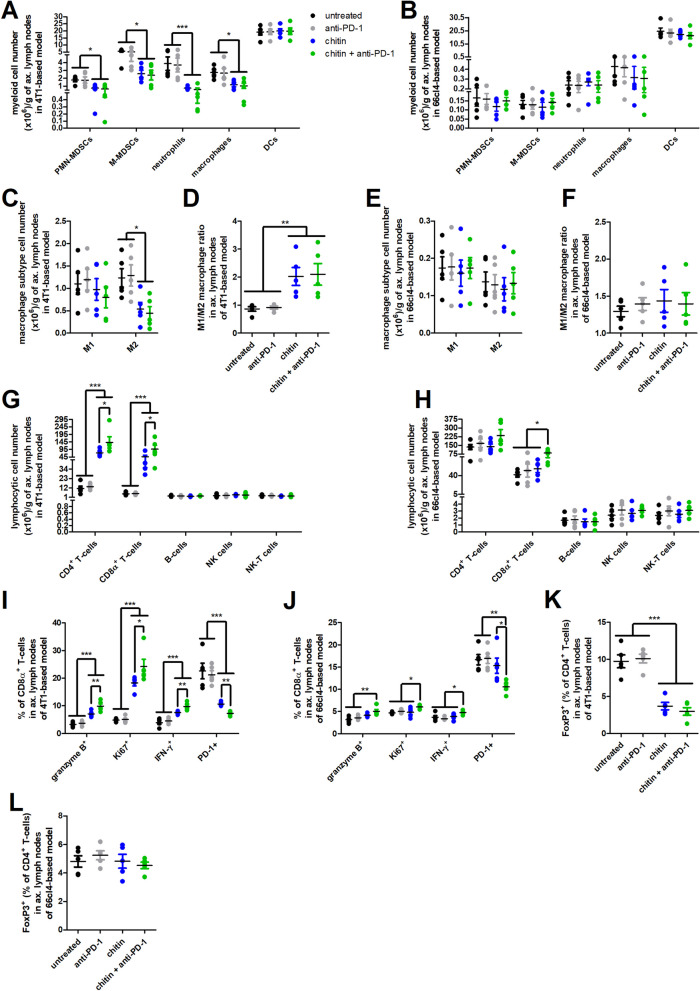
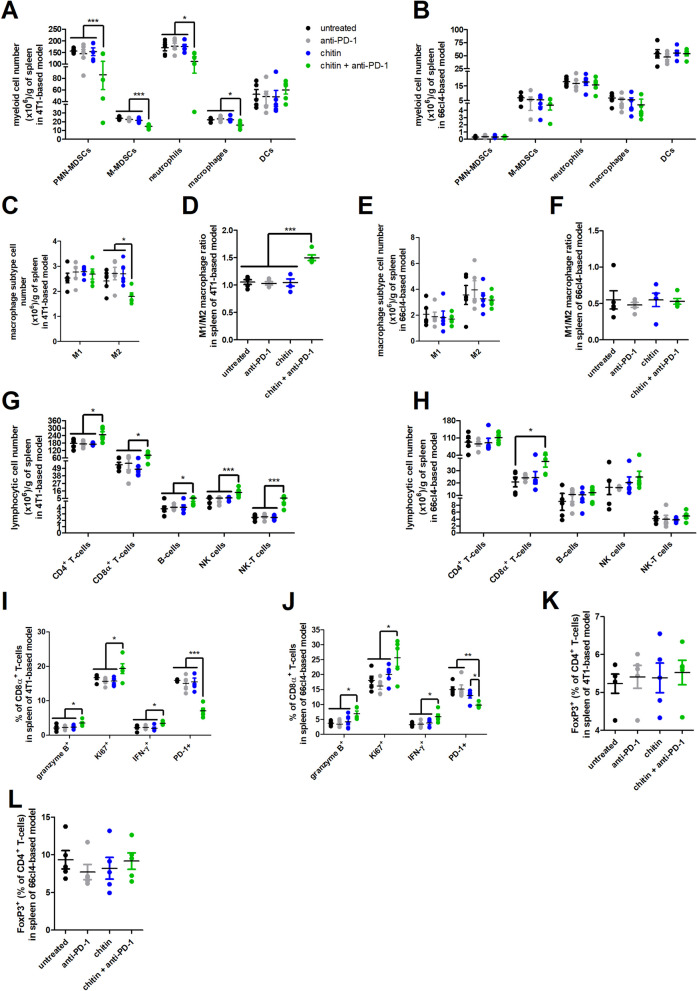
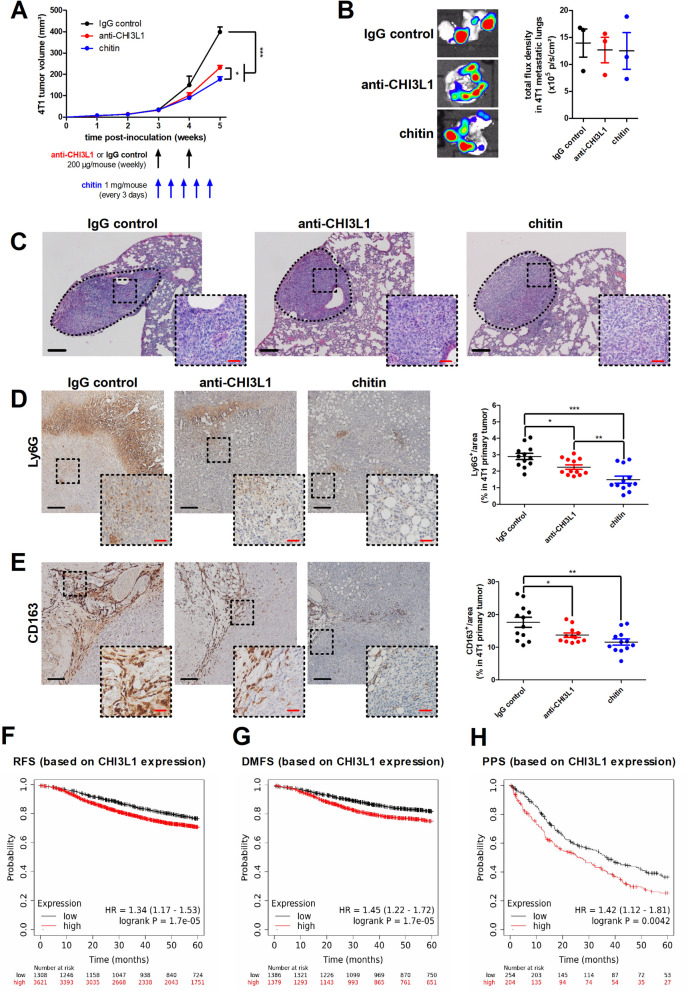
Results: Chitin significantly reduced primary tumor progression in the 4T1-based model by decreasing the high production of CLPs that originate from tumor-associated neutrophils (TANs) and Stat3 signaling, prominently affecting the CHI3L1 and CHI3L3 primary tumor levels. It reduced immunosuppressive cell types and increased anti-tumorigenic T-cells in primary tumors as well as axillary lymph nodes. Chitin also significantly reduced CHI3L3 primary tumor levels and immunosuppression in the 66cl4-based model. Compared to anti-CHI3L1, chitin enhanced primary tumor growth reduction and anti-tumorigenicity. Both treatments equally inhibited lymphatic adhesion and integration of macrophages, thereby hampering lymphatic tumor cell spreading. Upon ICB combination therapy, chitin alleviated anti-PD-1 resistance in both TNBC models, providing a significant add-on reduction in primary tumor and lung metastatic growth compared to chitin monotherapy. These add-on effects occurred through additional increase in CD8α+ T-cell infiltration and activation in primary tumor and lymphoid organs.

Conclusions: Chitin, as a general CLP blocker, reduces CLP production, enhances anti-tumor immunity as well as ICB responses, supporting its potential clinical relevance in immunosuppressed TNBC patients.

Keywords: Chitin; Chitinase-like proteins; Immunosuppression; Immunotherapy; Lymphatic metastasis; Triple-negative breast cancer.


Conflict of interest statement

The authors declare that they have no competing interests.

Figures

Fig. 1
Fig. 1
Chitin reduces tumor progression and enhances anti-PD-1 efficacy in a 4T1- and 66cl4-based intraductal model. A Experimental timeline with chitin and anti-PD-1 treatment schedules. B,C Weekly measurements of primary tumor volumes across the 5-w study period in the untreated and treated 4T1- (B) and 66cl4-based model (C) (n = 14 for all groups at all time points in the 4T1-based model; n = 22 for all groups at all time points in the 66cl4-based model). D,E In vivo imaging of primary tumor bioluminescent signals (total flux density in p/s/cm2) in the untreated and treated 4T1- (D) and 66cl4-based model (E) (n = 14 for all groups at all time points in the 4T1-based model; n = 22 for all groups at all time points in the 66cl4-based model). F,G Representative images of primary tumor bioluminescence in the untreated and treated 4T1- (F) and 66cl4-based model (G) at 5 w p.i. Data are presented as the means ± standard error of the mean (SEM). *P < 0.05, **P < 0.01, ***P < 0.001
Fig. 2
Fig. 2
Chitin and anti-PD-1 combination has a reductive effect on metastatic progression in the 4T1- and 66cl4-based intraductal model. A,B Representative images and quantification of bioluminescent signals (total flux density in p/s/cm2) in lungs from the untreated and treated 4T1- (A) and 66cl4-based model (B) at 5 w p.i. (n = 7 for all groups in the 4T1-based model; n = 11 for all groups in the 66cl4-based model). C H&E histology of lung metastases from the untreated and treated 4T1- and 66cl4-based model at 5 w p.i. Dashed inserts highlight H&E-stained metastases at a larger magnification. Black scale bars = 200 µm, red scale bars = 50 μm. D,E Representative images and weight measurements of the spleen from the untreated and treated 4T1-(D) and 66cl4-based model (E) at 5 w p.i. (n = 5 for all groups in the 4T1-based model; n = 11 for all groups in the 66cl4-based model). An image of a healthy spleen is shown for comparison and the dotted line in the graph highlights the mean spleen weight of 4 healthy BALB/c mice. Data are presented as the means ± SEM. *P < 0.05, **P < 0.01, ***P < 0.001
Fig. 3
Fig. 3
Chitin reduces high CHI3L1 and CHI3L3 production in the 4T1-based and even low CHI3L3 production in the 66cl4-based intraductal model. A Representative western blot images for CHI3L1, CHI3L3 and GAPDH loading control in primary tumor lysates from untreated, anti-PD-1-, chitin- and chitin + anti-PD-1-treated 4T1 and 66cl4 tumor-bearing mice at 5 w p.i. with quantification of CHI3L1 and CHI3L3 signal intensity relative to GAPDH (n = 6 for all groups; 3 western blots with 2 samples from each group per blot). B CHI3L1 primary tumor levels in the untreated and treated 4T1- (n = 5 for all groups) and 66cl4-based model (n = 11 for all groups) at 5 w p.i. C CHI3L3 primary tumor levels in the untreated and treated 4T1- (n = 5 for all groups) and 66cl4-based model (n = 11 for all groups) at 5 w p.i. D CHI3L1 serum levels in the untreated and treated 4T1- (n = 5 for all groups) and 66cl4-based model (n = 11 for all groups) at 5 w p.i. E CHI3L3 serum levels in the untreated and treated 4T1- (n = 5 for all groups) and 66cl4-based model (n = 11 for all groups) at 5 w p.i. F Fold change in CHI3L1 and CHI3L3 levels between separated CD45+ and CD45 cells from untreated 4T1 primary tumors at 5 w p.i. (n = 3 for all groups). G Fold change in CHI3L1 and CHI3L3 levels between separated Ly6G+ and Ly6G cells from untreated 4T1 primary tumors at 3 w p.i. (n = 4 for all groups). H Fold change in CHI3L1 levels between Ly6G+ cells derived from untreated versus chitin-treated 4T1 primary tumors at 3 w p.i. (n = 4 for all groups). I Fold change in CHI3L1 levels between Ly6G cells derived from untreated versus chitin-treated 4T1 primary tumors at 3 w p.i. (n = 4 for all groups). Data are presented as the means ± SEM. *P < 0.05, **P < 0.01, ***P < 0.001
Fig. 4
Fig. 4
Chitin reduces p-Stat3 levels in 4T1 primary tumors and MPO positivity in both 4T1 and 66cl4 primary tumors. A,B Immunohistochemistry for p-Stat3 (A) and MPO (B) on primary tumor sections from untreated, anti-PD-1-, chitin- and chitin + anti-PD-1-treated 4T1 and 66cl4 tumor-bearing mice at 5 w p.i. (n = 16 for all groups; 4 slides with 4 images per slide). Dashed inserts highlight stained tissue at a larger magnification. Black scale bars = 200 µm, red scale bars = 50 μm. Data are presented as the means ± SEM. ***P < 0.001
Fig. 5
Fig. 5
Chitin reduces immunosuppressive myeloid subpopulations and increases anti-PD-1-stimulated lymphocytic subpopulations in 4T1 and 66cl4 primary tumors. A-L Primary tumors were isolated from the untreated, anti-PD-1-, chitin- and chitin + anti-PD-treated 4T1- and 66cl4-based model at 5 w p.i. and processed into a single cell suspension for flow cytometric immunophenotyping (n = 5 for all groups). A,B Number of myeloid subpopulations (including PMN-MDSCs, M-MDSCs, TANs, TAMs and DCs) per gram of primary tumor in the untreated and treated 4T1- (A) and 66cl4-based model (B). C,D Number of M1 and M2 TAM subtypes per gram of primary tumor (C) and calculated M1/M2 TAM ratio (D) in the 4T1-based model. E,F Number of M1 and M2 TAM subtypes per gram of primary tumor (E) and calculated M1/M2 TAM ratio (F) in the 66cl4-based model. G,H Number of lymphocytic subpopulations (including CD4+ and CD8α+ T-cells, B-cells, NK cells and NK-T cells) per gram of primary tumor in the untreated and treated 4T1- (G) and 66cl4-based model (H). I,J Percentage of granzyme B+, Ki67+, IFN-γ+ and PD-1+ cells within the primary tumor CD8α+ T-cell population in the untreated and treated 4T1- (I) and 66cl4-based model (J). K,L Percentage of FoxP3+ cells within the primary tumor CD4+ T-cell population in the untreated and treated 4T1- (K) and 66cl4-based model (L). M,N Levels for MIP-2, MCP-1, IFN-γ and TNF-α in primary tumor lysates from the untreated and treated 4T1- (M) and 66cl4-based model (N) at 5 w p.i. (n = 5 for all groups in the 4T1-based model; n = 11 for all groups in the 66cl4-based model). Data are presented as the means ± SEM. *P < 0.05, **P < 0.01, ***P < 0.001
Fig. 6
Fig. 6
Innate- and T-cell-related gene expression levels corroborate the immunophenotypic changes upon chitin treatment in 4T1 and 66cl4 primary tumors. A-D Heatmaps showing mean normalized expression levels of selected genes associated with innate immunity in 4T1 (A) and 66cl4 primary tumors (B), T-cell exhaustion in 4T1 primary tumors (C) and T-cell activation in 66cl4 primary tumors (D) at 5 w p.i. derived from untreated, anti-PD-1, chitin- and chitin + anti-PD-1-treated tumor-bearing mice. Mean normalized expression levels were calculated based on normalized expression levels in 4 or 5 primary tumor samples from each treatment group and for each model. Selection of the genes was based on gene lists from the NanoString Mouse PanCancer Immune Profiling Panel. Pearson distance was used for hierarchical clustering
Fig. 7
Fig. 7
Chitin reduces immunosuppressive subpopulations in 4T1-derived axillary lymph nodes and increases anti-PD-1-stimulated lymphocytic subpopulations in both the 4T1- and 66cl4-derived axillary lymph nodes. A-L Axillary lymph nodes were isolated from the untreated, anti-PD-1-, chitin- and chitin + anti-PD-treated 4T1- and 66cl4-based model at 5 w p.i. and processed into a single cell suspension for flow cytometric immunophenotyping (n = 5 for all groups). A,B Number of myeloid subpopulations (including PMN-MDSCs, M-MDSCs, neutrophils, macrophages and DCs) per gram of axillary lymph nodes in the untreated and treated 4T1- (A) and 66cl4-based model (B). C,D Number of M1 and M2 macrophage subtypes per gram of axillary lymph nodes (C) and calculated M1/M2 macrophage ratio (D) in the 4T1-based model. E,F Number of M1 and M2 macrophage subtypes per gram of axillary lymph nodes (E) and calculated M1/M2 macrophage ratio (F) in the 66cl4-based model. G,H Number of lymphocytic subpopulations (including CD4+ and CD8α+ T-cells, B-cells, NK cells and NK-T cells) per gram of axillary lymph nodes in the untreated and treated 4T1- (G) and 66cl4-based model (H). I,J Percentage of granzyme B+, Ki67+, IFN-γ+ and PD-1+ cells within the axillary lymph node CD8α+ T-cell population in the untreated and treated 4T1- (I) and 66cl4-based model (J). K,L Percentage of FoxP3+ cells within the axillary lymph node CD4+ T-cell population in the untreated and treated 4T1- (K) and 66cl4-based model (L). Data are presented as the means ± SEM. *P < 0.05, **P < 0.01, ***P < 0.001
Fig. 8
Fig. 8
Chitin reduces immunosuppressive subpopulations in 4T1-derived spleens and increases anti-PD-1-stimulated lymphocytic subpopulations in both the 4T1- and 66cl4-derived spleens. A-L Spleens were isolated from the untreated, anti-PD-1-, chitin- and chitin + anti-PD-treated 4T1- and 66cl4-based model at 5 w p.i. and processed into a single cell suspension for flow cytometric immunophenotyping (n = 5 for all groups). A,B Number of myeloid subpopulations (including PMN-MDSCs, M-MDSCs, neutrophils, macrophages and DCs) per gram of spleen in the untreated and treated 4T1- (A) and 66cl4-based model (B). C,D Number of M1 and M2 macrophage subtypes per gram of spleen (C) and calculated M1/M2 macrophage ratio (D) in the 4T1-based model. E,F Number of M1 and M2 macrophage subtypes per gram of spleen (E) and calculated M1/M2 macrophage ratio (F) in the 66cl4-based model. G,H Number of lymphocytic subpopulations (including CD4+ and CD8α+ T-cells, B-cells, NK cells and NK-T cells) per gram of spleen in the untreated and treated 4T1- (G) and 66cl4-based model (H). I,J Percentage of granzyme B+, Ki67+, IFN-γ+ and PD-1+ cells within the splenic CD8α+ T-cell population in the untreated and treated 4T1- (I) and 66cl4-based model (J). K,L Percentage of FoxP3+ cells within the splenic CD4+ T-cell population in the untreated and treated 4T1- (K) and 66cl4-based model (L). Data are presented as the means ± SEM. *P < 0.05, **P < 0.01, ***P < 0.001
Fig. 9
Fig. 9
Chitin provides enhanced tumor reduction and anti-tumorigenicity compared to anti-CHI3L1 treatment in the 4T1-based intraductal model. A Weekly measurements of primary tumor volumes in the IgG control-, anti-CHI3L1- and chitin-treated 4T1-based model with treatment schedules indicated (n = 6 for all groups at all time points). B Representative images and quantification of bioluminescent signals (total flux density in p/s/cm2) in lungs from the IgG control-, anti-CHI3L1 and chitin-treated 4T1-based model at 5 w p.i. (n = 3 for all groups). C H&E histology of lung metastases from the IgG control-, anti-CHI3L1- and chitin-treated 4T1-based model at 5 w p.i. Dashed inserts highlight H&E-stained metastases at a larger magnification. D,E Immunohistochemistry for the PMN-MDSC/TAN marker Ly6G (D) and the M2 TAM subtype marker CD163 (E) on primary tumor sections from IgG control-, anti-CHI3L1- and chitin-treated 4T1 tumor-bearing mice at 5 w p.i. (n = 12 for all groups; 3 slides with 4 images per slide). Dashed inserts highlight stained tissue at a larger magnification. Black scale bars = 200 µm, red scale bars = 50 μm. F–H Kaplan Meier plots showing relapse-free (F), distant metastasis-free (G) and post-progression survival (H) over 60 months time based on CHI3L1 expression as calculated using publicly available mRNA gene chip data from all BC subtypes and the KM-plotter tool. Number of patients that were included for analysis: 4929 for RFS, 2765 for DMFS and 458 for PPS. Patients were split in high/low CHI3L1 expressors based on auto select of the best cutoff by the KM-plotter tool. Data are presented as the means ± SEM. *P < 0.05, **P < 0.01, ***P < 0.001
Fig. 10
Fig. 10
Chitin and anti-CHI3L1 treatment reduces CHI3L1-stimulated macrophage integration in lymphatic vessels in the 4T1-based intraductal model. A Representative images and quantification of bioluminescent signals (total flux density in p/s/cm2) in axillary lymph nodes from the IgG control-, anti-CHI3L1- and chitin-treated 4T1-based model at 5 w p.i. (n = 6 for all groups). B Flow cytometric analysis of PDPN positivity on the cell surface of RAW264.7 macrophages following a 24 h, 48 h and 72 h incubation with either PBS, 0.1, 0.5 or 1 µg/ml rmCHI3L1 (n = 6 for all groups). The dot plots highlight the PDPN positivity after a 72 h incubation with PBS versus 1 µg/ml rmCHI3L1. C Adhesion of PBS- and 5 µg/ml rmCHI3L1-treated RAW264.7 macrophages to a 2D LEC monolayer with representative images shown (n = 9 for all groups). D Ability of anti-PDPN, anti-IL13Rα2 and their respective IgG controls to inhibit adhesion of 5 µg/ml rmCHI3L1-treated RAW264.7 macrophages to a 2D LEC monolayer (n = 6 for all groups). E Integration of PBS- and 5 µg/ml rmCHI3L1-treated RAW264.7 macrophages into 3D LEC vessel-like structures with representative images shown (n = 9 for all groups). F Ability of anti-PDPN, anti-IL13Rα2 and their respective IgG controls to inhibit integration of 5 µg/ml rmCHI3L1-treated RAW264.7 macrophages into 3D LEC vessel-like structures (n = 7 for the rat IgG control and rat anti-PDPN group, n = 10 for the goat IgG control and goat anti-IL13Rα2 group). G Dual staining for the TAM marker F4/80 and LEC marker LYVE-1 on primary tumor sections from IgG control-, anti-CHI3L1- and chitin-treated 4T1 tumor-bearing mice at 5 w p.i. (n = 9 for all groups; 3 slides with 3 images per slide). Dashed inserts highlight stained tissue at a larger magnification. Black scale bars = 200 µm, white scale bars = 100 µm, red scale bars = 50 μm, green scale bars = 20 µm. Data are presented as the means ± SEM. *P < 0.05, **P < 0.01, ***P < 0.001

Similar articles

Cited by

References

    1. Gupta GK, Collier AL, Lee D, Hoefer RA, Zheleva V, Siewertsz van Reesema LL, Tang-Tan AM, Guye ML, Chang DZ, Winston JS, Samli B, Jansen RJ, Petricoin EF, Goetz MP, Bear HD, Tang AH. Perspectives on triple-negative breast cancer: current treatment strategies, unmet needs, and potential targets for future therapies. Cancers Basel. 2020;12(9):2392. - PMC - PubMed
    1. Thomas R, Al-Khadairi G, Decock J. Immune checkpoint inhibitors in triple negative breast cancer treatment: promising future prospects. Front Oncol. 2021;10:600573. doi: 10.3389/fonc.2020.600573. - DOI - PMC - PubMed
    1. Ribeiro R, Carvalho MJ, Goncalves J, Moreira JN. Immunotherapy in triple-negative breast cancer: insights into tumor immune landscape and therapeutic opportunities. Front Mol Biosci. 2022;9:903065. doi: 10.3389/fmolb.2022.903065. - DOI - PMC - PubMed
    1. Tie Y, Tang F, Wei YQ, Wei XW. Immunosuppressive cells in cancer: mechanisms and potential therapeutic targets. J Hematol Oncol. 2022;15(1):61. doi: 10.1186/s13045-022-01282-8. - DOI - PMC - PubMed
    1. Labani-Motlagh A, Ashja-Mahdavi M, Loskog A. The tumor microenvironment: a milieu hindering and obstructing antitumor immune responses. Front Immunol. 2020;11:940. doi: 10.3389/fimmu.2020.00940. - DOI - PMC - PubMed