

HERC5 downregulation in non-small cell lung cancer is associated with altered energy metabolism and metastasis
- PMID: 38605423
- PMCID: PMC11008035
- DOI: 10.1186/s13046-024-03020-z
HERC5 downregulation in non-small cell lung cancer is associated with altered energy metabolism and metastasis
Abstract
Background: Metastasis is the leading cause of cancer-related death in non-small cell lung cancer (NSCLC) patients. We previously showed that low HERC5 expression predicts early tumor dissemination and a dismal prognosis in NSCLC patients. Here, we performed functional studies to unravel the mechanism underlying the "metastasis-suppressor" effect of HERC5, with a focus on mitochondrial metabolism pathways.
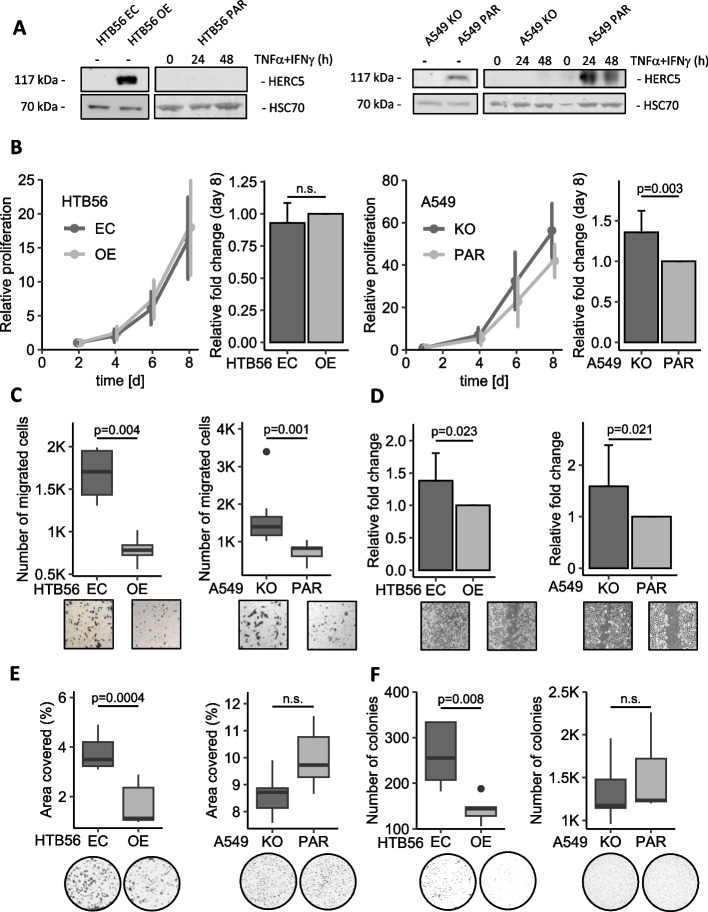
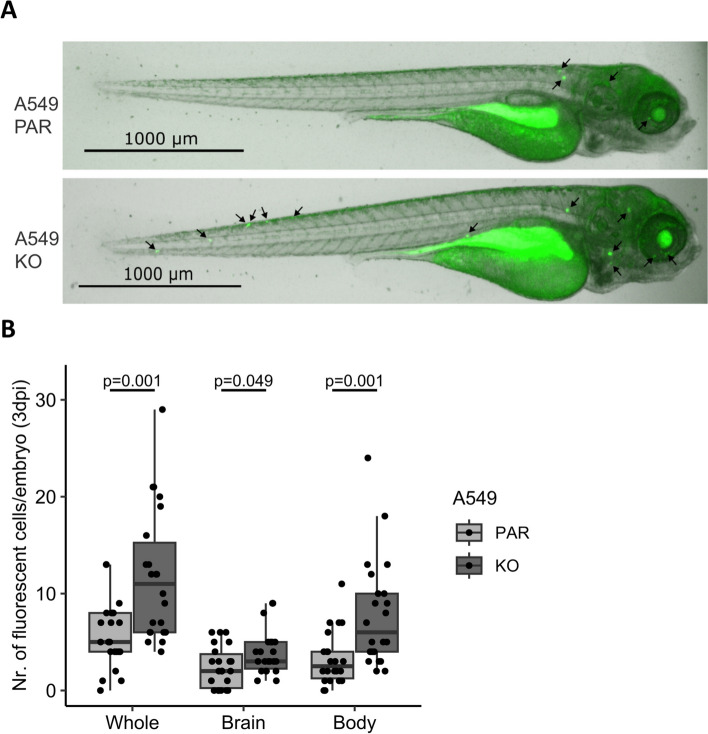
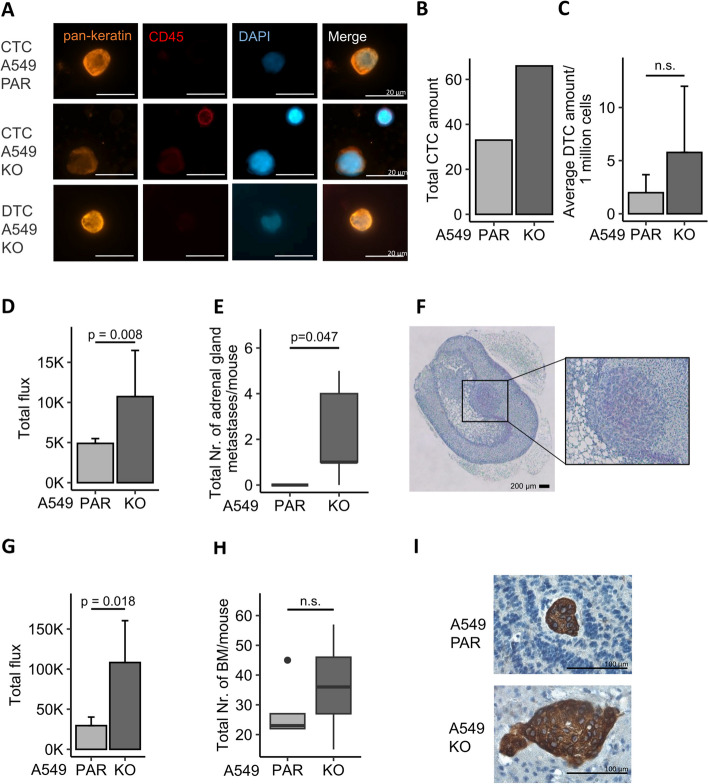
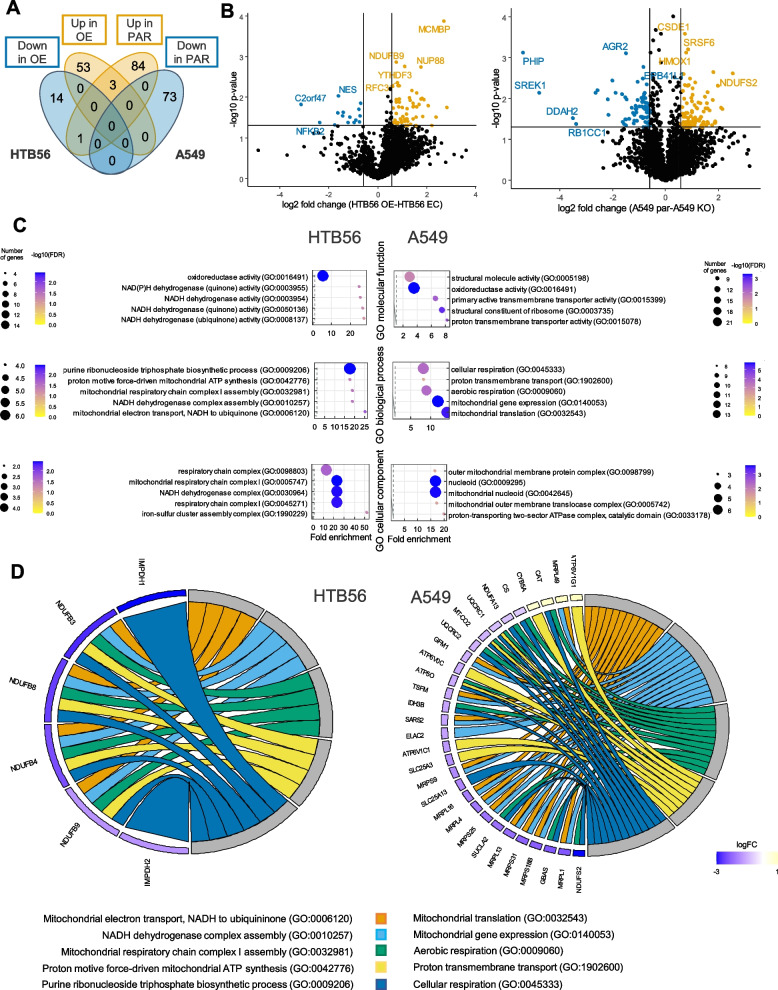
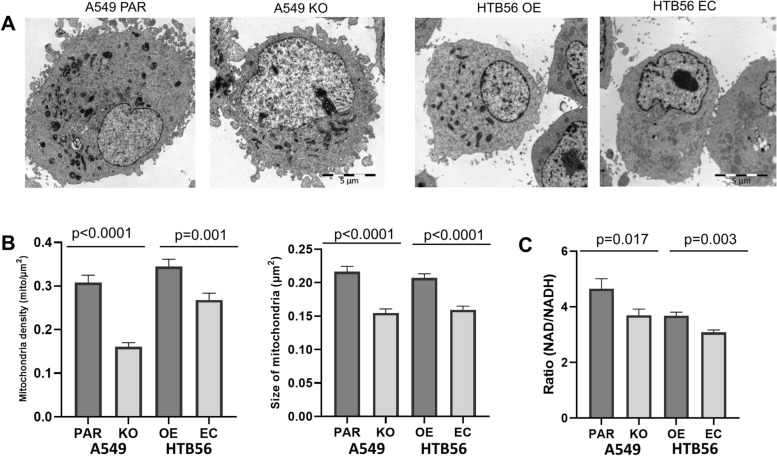
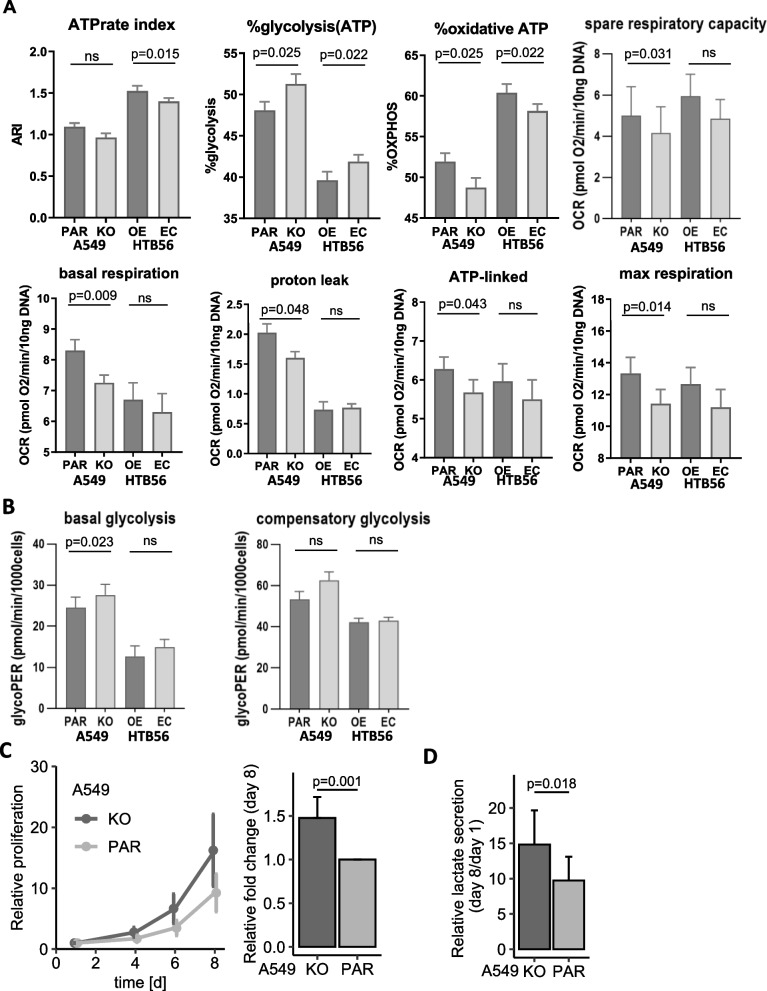
Methods: We assessed cell proliferation, colony formation potential, anchorage-independent growth, migration, and wound healing in NSCLC cell line models with HERC5 overexpression (OE) or knockout (KO). To study early tumor cell dissemination, we used these cell line models in zebrafish experiments and performed intracardial injections in nude mice. Mass spectrometry (MS) was used to analyze protein changes in whole-cell extracts. Furthermore, electron microscopy (EM) imaging, cellular respiration, glycolytic activity, and lactate production were used to investigate the relationships with mitochondrial energy metabolism pathways.
Results: Using different in vitro NSCLC cell line models, we showed that NSCLC cells with low HERC5 expression had increased malignant and invasive properties. Furthermore, two different in vivo models in zebrafish and a xenograft mouse model showed increased dissemination and metastasis formation (in particular in the brain). Functional enrichment clustering of MS data revealed an increase in mitochondrial proteins in vitro when HERC5 levels were high. Loss of HERC5 leads to an increased Warburg effect, leading to improved adaptation and survival under prolonged inhibition of oxidative phosphorylation.
Conclusions: Taken together, these results indicate that low HERC5 expression increases the metastatic potential of NSCLC in vitro and in vivo. Furthermore, HERC5-induced proteomic changes influence mitochondrial pathways, ultimately leading to alterations in energy metabolism and demonstrating its role as a new potential metastasis suppressor gene.
Keywords: Cancer metabolism; DTC; HERC5; Metastasis; Mitochondria; NSCLC; OXPHOS; Warburg effect.
© 2024. The Author(s).
Conflict of interest statement
The authors declare that they have no competing interests.
Figures
Similar articles
-
Integrin αVβ1-activated PYK2 promotes the progression of non-small-cell lung cancer via the STAT3-VGF axis.Cell Commun Signal. 2024 Jun 6;22(1):313. doi: 10.1186/s12964-024-01639-1. Cell Commun Signal. 2024. PMID: 38844957 Free PMC article.
-
Bioengineered miR-7-5p modulates non-small cell lung cancer cell metabolism to improve therapy.Mol Pharmacol. 2025 Jan;107(1):100006. doi: 10.1016/j.molpha.2024.100006. Epub 2024 Nov 29. Mol Pharmacol. 2025. PMID: 39919164
-
YiQiChuTan formula (YQCTF) inhibit the progression of non-small cell lung cancer via down-regulating EGFR/ITGB2 signaling: Triangulated evidence from network pharmacology, proteomic profiling, and experimental validation.Phytomedicine. 2025 Aug;144:156950. doi: 10.1016/j.phymed.2025.156950. Epub 2025 Jun 4. Phytomedicine. 2025. PMID: 40505482
-
PET-CT for assessing mediastinal lymph node involvement in patients with suspected resectable non-small cell lung cancer.Cochrane Database Syst Rev. 2014 Nov 13;2014(11):CD009519. doi: 10.1002/14651858.CD009519.pub2. Cochrane Database Syst Rev. 2014. PMID: 25393718 Free PMC article.
-
First-line treatment of advanced epidermal growth factor receptor (EGFR) mutation positive non-squamous non-small cell lung cancer.Cochrane Database Syst Rev. 2016 May 25;(5):CD010383. doi: 10.1002/14651858.CD010383.pub2. Cochrane Database Syst Rev. 2016. Update in: Cochrane Database Syst Rev. 2021 Mar 18;3:CD010383. doi: 10.1002/14651858.CD010383.pub3. PMID: 27223332 Updated.
Cited by
-
Sanguinarine Induces Necroptosis of HCC by Targeting PKM2 Mediated Energy Metabolism.Cancers (Basel). 2024 Jul 13;16(14):2533. doi: 10.3390/cancers16142533. Cancers (Basel). 2024. PMID: 39061173 Free PMC article.
-
Upregulation of TTYH3 by lncRNA LUCAT1 through interacting with ALYREF facilitates the metastasis in non-small cell lung cancer.Cancer Biol Ther. 2025 Dec;26(1):2464966. doi: 10.1080/15384047.2025.2464966. Epub 2025 Feb 10. Cancer Biol Ther. 2025. PMID: 39930621 Free PMC article.
-
Potential role of lactylation in intrinsic immune pathways in lung cancer.Front Pharmacol. 2025 Mar 17;16:1533493. doi: 10.3389/fphar.2025.1533493. eCollection 2025. Front Pharmacol. 2025. PMID: 40166469 Free PMC article. Review.
-
E3 ligase HERC5-catalyzed UGDH isgylation promotes SNAI1-mediated tumor metastasis and cisplatin resistance in oral squamous cell carcinoma.Biol Direct. 2025 Mar 5;20(1):27. doi: 10.1186/s13062-025-00622-1. Biol Direct. 2025. PMID: 40045362 Free PMC article.
-
Metabolic adaptations of brain metastasis.Nat Rev Cancer. 2025 Sep;25(9):723-739. doi: 10.1038/s41568-025-00848-1. Epub 2025 Jul 24. Nat Rev Cancer. 2025. PMID: 40707738 Review.
References
MeSH terms
Substances
Grants and funding
LinkOut - more resources
Full Text Sources
Medical
Molecular Biology Databases
Research Materials
