. 2024 Apr;48(4):e13438.
doi: 10.1111/cogs.13438.

The Role of Attention in Category Representation

Affiliations

The Role of Attention in Category Representation

Mengcun Gao et al. Cogn Sci. 2024 Apr.

Abstract

Numerous studies have found that selective attention affects category learning. However, previous research did not distinguish between the contribution of focusing and filtering components of selective attention. This study addresses this issue by examining how components of selective attention affect category representation. Participants first learned a rule-plus-similarity category structure, and then were presented with category priming followed by categorization and recognition tests. Additionally, to evaluate the involvement of focusing and filtering, we fit models with different attentional mechanisms to the data. In Experiment 1, participants received rule-based category training, with specific emphasis on a single deterministic feature (D feature). Experiment 2 added a recognition test to examine participants' memory for features. Both experiments indicated that participants categorized items based solely on the D feature, showed greater memory for the D feature, were primed exclusively by the D feature without interference from probabilistic features (P features), and were better fit by models with focusing and at least one type of filtering mechanism. The results indicated that selective attention distorted category representation by highlighting the D feature and attenuating P features. To examine whether the distorted representation was specific to rule-based training, Experiment 3 introduced training, emphasizing all features. Under such training, participants were no longer primed by the D feature, they remembered all features well, and they were better fit by the model assuming only focusing but no filtering process. The results coupled with modeling provide novel evidence that while both focusing and filtering contribute to category representation, filtering can also result in representational distortion.

Keywords: Attention; Categorization; Computational model; Learning; Memory; Priming effects; Representation.


Figures

Figure 1.
Figure 1.
Stimuli examples of different types in Feet as the D-feature version. Stimuli shown in the same row belong to the same category. Stimuli depicted in the first column are the prototypes of the two to-be-learned categories. Five different types of stimuli were used in all four experiments, including High-Match, Switch, New-D, One-New-P, and All-New-P.
Figure 2.
Figure 2.
Overview of the Introduction. In Experiment 1 and Experiment 2, participants were presented with rule-based introduction, whereas in Experiment 3, participants were presented with similarity-based introduction. The major and the only difference between the two types of introductions was whether the D feature was introduced or not.
Figure 3.
Figure 3.
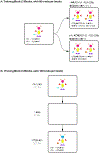
Overview of the training (A) and priming block (B) procedures. The procedure for priming block was identical in all three experiments. However, training in the three experiments differed in terms of corrective feedback provided for participants. Participants in Experiment 1 and Experiment 2 received rule-based feedback, whereas participants in Experiment 3 received similarity-based feedback.
Figure 4.
Figure 4.
Priming blocks performance: Mean correct response time (RT) by prime-target category (D-feature) match and similarity across three blocks in Experiment 1. Boxes represent the interquartile range (IQR) of RT for each condition. The lines within each box represent the median RTs. The whiskers extend from each box to the furthest data point that is within 1.5 times the IQR away from the box. Each dot refers to an individual’s mean correct RT by prime type and block. Dots represent individual participant RT data.
Figure 5.
Figure 5.
Categorization Accuracy across item types in Experiment 1 – 3. Boxes represent the interquartile range (IQR) of accuracy for different item types (HM: High-Match, SW: Switch, ND: New-D, OP: One-New-P, AP: All-New-P). The lines within each box represent the median accuracy. The whiskers extend from each box to the furthest data point that is within 1.5 times the IQR away from the box. Dots are individual participant accuracy data.
Figure 6.
Figure 6.
Frequency of Best-fit Models for Mechanism 2. This figure presents the frequency distribution of the best-fitting models implementing Mechanism 2 examined in Experiment 1 (Rule-based Category Learning), Experiment 2 (Rule-based Category Learning), and Experiment 3 (Similarity-based Category Learning). Darker green represents models incorporating the focusing mechanism, whereas lighter green represents models without the focusing mechanism.
Figure 7.
Figure 7.
Priming blocks performance: Mean correct response time (RT) by prime-target category (D-feature) match and similarity across three blocks in Experiment 2. Boxes represent the interquartile range (IQR) of RT for each condition. The lines within each box represent the median RTs (the median bar of the fourth box in Block 1 was covered by individual dots). The whiskers extend from each box to the furthest data point that is within 1.5 times the IQR away from the box. Dots represent individual participant RT data.
Figure 8.
Figure 8.
Recognition test performance: Participants’ average sensitivity by feature types (D vs. P) in Experiment 2 and Experiment 3. Boxes represent the interquartile range (IQR) of sensitivity by feature type. The lines within each box represent the median sensitivity. The whiskers extend from each box to the furthest data point that is within 1.5 times the IQR away from the box. Dots represent individual participant sensitivity data.
Figure 9.
Figure 9.
Priming blocks performance: Mean correct response time (RT) by prime-target category (D-feature) match and similarity across three blocks in Experiment 3. Boxes represent the interquartile range (IQR) of RT for each condition. The lines within each box represent the median RTs. The whiskers extend from each box to the furthest data point that is within 1.5 times the IQR away from the box. Dots represent individual participant RT data.

References

    1. Ahn W-K, & Medin DL (1992). A two-stage model of category construction. Cognitive Science, 16(1), 81–121. 10.1207/s15516709cog1601_3 - DOI
    1. Anwyl-Irvine AL, Massonnié J, Flitton A, Kirkham N, & Evershed JK (2019, April 23). Gorilla in our midst: An online behavioral experiment builder - behavior research methods. SpringerLink. Retrieved April 30, 2022, from https://link.springer.com/article/10.3758/s13428-019-01237-x - DOI - PMC - PubMed
    1. Andersen SK, & Müller MM (2010). Behavioral performance follows the time course of neural facilitation and suppression during cued shifts of feature-selective attention. Proceedings of the National Academy of Sciences, 107(31), 13878–13882. 10.1073/pnas.1002436107 - DOI - PMC - PubMed
    1. Ashby FG, Alfonso-Reese LA, Turken AU, & Waldron EM (1998). A neuropsychological theory of multiple systems in category learning. Psychological Review, 105(3), 442–481. 10.1037/0033-295x.105.3.442 - DOI - PubMed
    1. Bacon WF, & Egeth HE (1994). Overriding stimulus-driven attentional capture. Perception & Psychophysics, 55(5), 485–496. 10.3758/bf03205306 - DOI - PubMed

Publication types

LinkOut - more resources