. 2024 Mar 28:15:1343716.
doi: 10.3389/fimmu.2024.1343716. eCollection 2024.

High frequencies of alpha common cold coronavirus/SARS-CoV-2 cross-reactive functional CD4+ and CD8+ memory T cells are associated with protection from symptomatic and fatal SARS-CoV-2 infections in unvaccinated COVID-19 patients

Affiliations

High frequencies of alpha common cold coronavirus/SARS-CoV-2 cross-reactive functional CD4+ and CD8+ memory T cells are associated with protection from symptomatic and fatal SARS-CoV-2 infections in unvaccinated COVID-19 patients

Pierre-Gregoire Coulon et al. Front Immunol. .

Abstract

Background: Cross-reactive SARS-CoV-2-specific memory CD4+ and CD8+ T cells are present in up to 50% of unexposed, pre-pandemic, healthy individuals (UPPHIs). However, the characteristics of cross-reactive memory CD4+ and CD8+ T cells associated with subsequent protection of asymptomatic coronavirus disease 2019 (COVID-19) patients (i.e., unvaccinated individuals who never develop any COVID-19 symptoms despite being infected with SARS-CoV-2) remains to be fully elucidated.

Methods: This study compares the antigen specificity, frequency, phenotype, and function of cross-reactive memory CD4+ and CD8+ T cells between common cold coronaviruses (CCCs) and SARS-CoV-2. T-cell responses against genome-wide conserved epitopes were studied early in the disease course in a cohort of 147 unvaccinated COVID-19 patients who were divided into six groups based on the severity of their symptoms.

Results: Compared to severely ill COVID-19 patients and patients with fatal COVID-19 outcomes, the asymptomatic COVID-19 patients displayed significantly: (i) higher rates of co-infection with the 229E alpha species of CCCs (α-CCC-229E); (ii) higher frequencies of cross-reactive functional CD134+CD137+CD4+ and CD134+CD137+CD8+ T cells that cross-recognized conserved epitopes from α-CCCs and SARS-CoV-2 structural, non-structural, and accessory proteins; and (iii) lower frequencies of CCCs/SARS-CoV-2 cross-reactive exhausted PD-1+TIM3+TIGIT+CTLA4+CD4+ and PD-1+TIM3+TIGIT+CTLA4+CD8+ T cells, detected both ex vivo and in vitro.

Conclusions: These findings (i) support a crucial role of functional, poly-antigenic α-CCCs/SARS-CoV-2 cross-reactive memory CD4+ and CD8+ T cells, induced following previous CCCs seasonal exposures, in protection against subsequent severe COVID-19 disease and (ii) provide critical insights into developing broadly protective, multi-antigen, CD4+, and CD8+ T-cell-based, universal pan-Coronavirus vaccines capable of conferring cross-species protection.

Keywords: SARS-CoV-2; CD4 + T cells; CD8 + T cells; COVID-19; asymptomatic; common cold coronavirus; exhaustion α-CCCs/SARS-CoV-2 cross-reactive T cells in asymptomatic COVID-19 infection; symptomatic.


Conflict of interest statement

Authors HV, DG, TJ and JU were employed by company TechImmune LLC. LB has an equity interest in TechImmune, LLC., a company that may potentially benefit from the research results and serves on the company’s Scientific Advisory Board. LB’s relationship with TechImmune, LLC., has been reviewed and approved by the University of California, Irvine by its conflict-of-interest policies. The remaining authors declare that the research was conducted in the absence of any commercial or financial relationships that could be construed as a potential conflict of interest. The author(s) declared that they were an editorial board member of Frontiers, at the time of submission. This had no impact on the peer review process and the final decision.

Figures

Figure 1
Figure 1
IFN-γ-producing CD4+ T-cell responses to CCCs/SARS-CoV-2 cross-reactive epitopes in unvaccinated COVID-19 patients with various degrees of disease severity. PBMCs from HLA-DRB1*01:01-positive COVID-19 patients (n = 92 are HLA-DRB1*01:01-positive out of 600 tested) were isolated and stimulated for a total of 72 h with 10 µg/ml of each of the previously identified 16 CCCs/SARS-CoV-2 cross-reactive CD4+ T cell epitope peptides. The number of IFN-γ-producing CD4+ T cells was quantified in each of the 92 patients using ELISpot assay. (A) Average/mean numbers (± SD) of IFN-γ-spot forming cells (SFCs) after CD4+ T-cell peptide-stimulation detected in each of the 92 COVID-19 patients divided into six groups based on disease severity scored 0–5, as described in Materials and methods, and as identified by six columns on a grayscale (black columns = severity 5, to white columns = severity 0) is shown. Dotted lines represent an arbitrary threshold set as a cutoff of the positive response. A mean SFC between 25 and 50 SFCs corresponds to a medium/intermediate response, whereas a strong response is defined for mean SFCs > 50 per 0.5 × 10⁶ stimulated PBMCs. (B) Correlation between the overall number of IFN-γ-producing CD4+ T cells induced by each of the 16 CCCs/SARS-CoV-2 cross-reactive CD4+ T-cell epitope peptides in each of the six groups of COVID-19 patients with various disease severity. The coefficient of determination (R2) is calculated from the Pearson correlation coefficients (R). The associated p-value and the slope (S) of the best-fitted line (dotted line) calculated by linear regression analysis are indicated. The gray-hatched boxes in the correlation graphs extend from the 25th to 75th percentiles (hinges of the plots) with the median represented as a horizontal line in each box and the extremity of the vertical bars showing the minimum and maximum values. (C) Representative spots images of the IFN-γ-spot forming cells (SFCs) induced by each of the 16 CCCs/SARS-CoV-2 cross-reactive CD4+ T cell epitope peptides in three representative patients, each falling into one of three groups of disease category: the unvaccinated asymptomatic COVID-19 patients (ASYMP, severity score 0), unvaccinated COVID-19 patients who developed mild to moderate disease (severity scores 1 and 2) and unvaccinated severely ill COVID-19 patients and unvaccinated patients with fatal COVID-19 outcomes (severity scores 3–5). PHA was used as a positive control of T-cell activation. Unstimulated negative control SFCs (DMSO—no peptide stimulation) were subtracted from the SFC counts of peptides-stimulated cells. Results are representative of two independent experiments and were considered statistically significant at p ≤ 0.05.
Figure 2
Figure 2
IFN-γ-producing CD8+ T-cell responses to CCCs/SARS-CoV-2 cross-reactive epitopes in unvaccinated COVID-19 patients with various degrees of disease severity. PBMCs from HLA-A*02:01-positive COVID-19 patients (n = 71) were isolated and stimulated for a total of 72 h with 10 µg/ml of each of the previously identified 27 CCCs/SARS-CoV-2 cross-reactive CD8+ T-cell epitope peptides. The number of IFN-γ-producing CD8+ T cells was quantified in each of the 71 patients using ELISpot assay. Panel (A) shows the average/mean numbers (± SD) of IFN-γ-spot forming cells (SFCs) after CD8+ T-cell peptide stimulation detected in each of the 71 COVID-19 patients divided into six groups based on disease severity scored 0–5, as described in Materials and methods, and as identified by six columns on a grayscale (Black columns = severity 5, to white columns = severity 0). Dotted lines represent an arbitrary threshold set as a cutoff of the positive response. A mean SFCs between 25 and 50 SFCs corresponds to a medium/intermediate response, whereas a strong response is defined for mean SFCs > 50 per 0.5 × 10⁶ stimulated PBMCs. (B) Correlation between the overall number of IFN-γ-producing CD8+ T cells induced by each of the 27 CCCs/SARS-CoV-2 cross-reactive CD8+ T-cell epitope peptides in each of the six groups of COVID-19 patients with various disease severity. The coefficient of determination (R2) is calculated from the Pearson correlation coefficients (R). The associated p-value and the slope (S) of the best-fitted line (dotted line) calculated by linear regression analysis are indicated. The gray-hatched boxes in the correlation graphs extend from the 25th to 75th percentiles (hinges of the plots) with the median represented as a horizontal line in each box and the extremity of the vertical bars showing the minimum and maximum values. (C) Representative spots images of the IFN-γ-spot forming cells (SFCs) induced by each of the 27 CCCs/SARS-CoV-2 cross-reactive CD8+ epitope peptides in three representative patients, each falling into one of three groups of disease category: the unvaccinated asymptomatic COVID-19 patients (ASYMP, severity score 0), unvaccinated COVID-19 patients who developed mild to moderate disease (severity scores 1 and 2), and unvaccinated severely ill COVID-19 patients and unvaccinated patients with fatal COVID-19 outcomes, (severity scores 3–5). PHA was used as a positive control of T-cell activation. Unstimulated negative control SFCs (DMSO—no peptide stimulation) were subtracted from the SFC counts of peptides-stimulated cells. Results are representative of two independent experiments and were considered statistically significant at p ≤ 0.05.
Figure 3
Figure 3
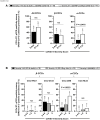
Frequencies of white blood cells, lymphocytes, and CD3+/CD4+/CD8+ T cells in the blood of unvaccinated COVID-19 patients with various degrees of disease severity. (A) numbers of white blood cells (WBCs) and total lymphocytes per µl of blood (left two panels) and percentages and ratios of total lymphocytes among WBCs (right two panels) measured ex vivo by blood differential test (BDT) in unvaccinated COVID-19 patients with various degrees of disease severity (n = 147). (B) Averages/means of numbers and frequencies of CD3+ T cells and (C) of total CD4+, and CD8+ T cells measured by flow cytometry from COVID-19 patients’ PBMCs with various severity scores after 72 h of stimulation with a pool of 16 CD4+ and 27 CD8+ CCCs/SARS-CoV-2 cross-reactive epitope peptides. The right panels show representative dot plots from patients with disease severity scores from 0 to 5. Data are expressed as the mean ±SD. Results are representative of two independent experiments and were considered statistically significant at p ≤ 0.05 (one-way ANOVA).
Figure 4
Figure 4
Frequencies of CCCs/SARS-CoV-2 cross-reactive CD4+ and CD8+ T cells in unvaccinated COVID-19 patients with various degrees of disease severity. PBMCs from HLA-DRB1*01:01-positive (n = 92) (A) or HLA-A*02:01-positive (n = 71) (B) unvaccinated COVID-19 patients with various degrees of disease severity were isolated and stimulated for 72 h with 10 μg/ml of indicated CCCs/SARS-CoV-2 cross-reactive CD4+ and CD8+ epitope peptides. The induced CD4+ and CD8+ T cells were then stained and analyzed by flow cytometry. The indicated epitope peptides were chosen among the CCCs/SARS-CoV-2 cross-reactive 16 CD4+ and 27 CD8+ epitope peptides based on tetramer availability. Panel (A) shows representative dot plots (left panels) and average frequencies of CCCs/SARS-CoV-2 cross-reactive CD4+ T cells (right panel) detected in three representatives COVID-19 patients, each falling into one of three groups of disease category: the unvaccinated asymptomatic COVID-19 patients (ASYMP, severity score 0), unvaccinated COVID-19 patients who developed mild to moderate disease (severity scores 1 and 2), and unvaccinated severely ill COVID-19 patients and unvaccinated patients with fatal COVID-19 outcomes (severity scores 3–5). Panel (B) shows representative dot plots (left panels) and average frequencies of CCCs/SARS-CoV-2 cross-reactive CD8+ T cells (right panel) detected in three representatives of COVID-19 patients and in panel (A). Data are expressed as the mean ± SD. Results are representative of two independent experiments and were considered statistically significant at p ≤ 0.05 (one-way ANOVA).
Figure 5
Figure 5
Co-expression of exhaustion and activation markers on CCCs/SARS-CoV-2 cross-reactive CD4+ T cells from unvaccinated COVID-19 patients with various degrees of disease severity. PBMCs from HLA-DRB1*01:01-positive unvaccinated COVID-19 patients with various degrees of disease severity were isolated and stimulated for 72 h with 10 μg/ml of five CCCs/SARS-CoV-2 cross-reactive CD4+ T-cell epitope peptides. The induced CD4+ T cells were then stained and analyzed by flow cytometry for the frequency of tetramer-specific CD4+ cells co-expressing exhaustion and activation markers. Panel (A) shows representative dot plots (upper panels) and average (lower panels) frequencies of CCCs/SARS-CoV-2 cross-reactive CD4+ T cells expressing exhaustion markers PD1/TIGIT and TIM-3/CTLA-4 detected in three representative groups of unvaccinated COVID-19 patients with various degrees of disease severity. Panel (B) shows representative dot plots (upper panels) and average (lower panels) frequencies of CCCs/SARS-CoV-2 cross-reactive CD4+ T cells expressing activation markers (AIMs) CD134/CD137 detected in three representative groups of unvaccinated COVID-19 patients with various degrees of disease severity. Results are representative of two independent experiments, and data are expressed as the mean ± SD and were considered statistically significant at p ≤ 0.05 calculated using one-way ANOVA.
Figure 6
Figure 6
Co-expression of exhaustion and activation markers on CCCs/SARS-CoV-2 cross-reactive CD8+ T cells from unvaccinated COVID-19 patients with various degrees of disease severity. PBMCs from HLA-A*02:01-positive unvaccinated COVID-19 patients with various degrees of disease severity were isolated and stimulated for 72 h with 10 μg/ml of five CCCs/SARS-CoV-2 cross-reactive CD8+ T-cell epitope peptides. The induced CD8+ T cells were then stained and analyzed by flow cytometry for the frequency of tetramer-specific CD8+ cells co-expressing exhaustion and activation markers. Panel (A) shows representative dot plots (upper panels) and average frequencies of CCCs/SARS-CoV-2 cross-reactive CD8+ T cells (lower panel) expressing exhaustion markers PD1/TIGIT and TIM-3/CTLA-4 detected in three representative groups of unvaccinated COVID-19 patients with various degrees of disease severity. Panel (B) shows representative dot plots (upper panels) and average frequencies of CCCs/SARS-CoV-2 cross-reactive CD8+ T cells (lower panel) expressing activation markers (AIMs) CD134/CD137 detected in three representative groups of unvaccinated COVID-19 patients with various degrees of disease severity. Results are representative of two independent experiments, and data are expressed as the mean ± SD and were considered statistically significant at p ≤ 0.05 (one-way ANOVA).
Figure 7
Figure 7
Rates (frequency) of co-infection with seasonal common cold coronavirus species α-CCC-NL63, α-CCC-229E, β-CCC HKU1, and β-CCC-OC43 in unvaccinated COVID-19 patients with various degrees of disease severity. Four major human common cold coronaviruses species, CCC-HKU1, CCC-OC43, CCC-229E, and CCC-NL63, were detected using RT-PCR in the nasopharyngeal swabs of COVID-19 patients (n = 85, first column) who developed various disease severity. Panel (A) shows all four α-CCCs and β-CCCs species (left panel), β-CCC species alone (middle panel), and α-CCC species alone (right panel), detected in unvaccinated severely ill COVID-19 patients and unvaccinated patients with fatal COVID-19 outcomes (severity scores 3–4–5) vs. unvaccinated COVID-19 patients who developed no, mild, and moderate disease (severity score 1–2–3). (B) The rate (%) of co-infection with each one of the four major species, CCC-HKU1, CCC-OC43, CCC-229E, and CCC-NL63, detected in unvaccinated severely ill COVID-19 patients and unvaccinated patients with fatal COVID-19 outcomes (severity scores 3–4–5), in unvaccinated COVID-19 patients who developed mild to moderate disease (severity score 1–2), and in unvaccinated asymptomatic COVID-19 patients (severity score 0). The p-values calculated using the Chi-squared test compare the rate (%) of co-infection with each CCC species between unvaccinated COVID-19 patients with various degrees of disease severity. Results are representative of two independent experiments, and data are expressed as the mean ± SD and were considered statistically significant at p ≤ 0.05 calculated using Fisher’s exact test.
Figure 8
Figure 8
Illustration showing higher frequencies of common cold coronavirus/SARS-CoV-2 cross-reactive CD4+ and CD8+ T cells detected in unvaccinated asymptomatic COVID-19 patients is associated with higher rates of co-infection with alpha common cold coronavirus strain 229E (α-CCC-229E). The first row shows increasing copies of α-CCC-229E detected in unvaccinated asymptomatic COVID-19 patients compared to unvaccinated symptomatic COVID-19 patients. The middle row shows increasing numbers of common cold coronavirus/SARS-CoV-2 cross-reactive CD4+ and CD8+ memory T cells detected in unvaccinated asymptomatic COVID-19 patients compared to unvaccinated symptomatic COVID-19 patients. The bottom row shows symptoms detected in unvaccinated COVID-19 patients with symptoms increasing from severity 0 in asymptomatic COVID-19 patients (left) to severity 5 in COVID-19 patients with fatal COVID-19 outcomes (right) as detailed in Materials and methods.”.

References

    1. Prakash S, Srivastava R, Coulon PG, Dhanushkodi NR, Chentoufi AA, Tifrea DF, et al. . Genome-wide B cell, CD4(+), and CD8(+) T cell epitopes that are highly conserved between human and animal coronaviruses, identified from SARS-CoV-2 as targets for preemptive pan-coronavirus vaccines. J Immunol. (2021) 206:2566–82. doi: 10.4049/jimmunol.2001438 - DOI - PMC - PubMed
    1. Prakash S, Dhanushkodi NR, Zayou L, Ibraim IC, Quadiri A, Coulon PG, et al. . Cross-protection induced by highly conserved human B, CD4 (+,) and CD8 (+) T cell epitopes-based coronavirus vaccine against severe infection, disease, and death caused by multiple SARS-CoV-2 variants of concern. Front Immunol. (2023) 15:1328905. doi: 10.1101/2023.05.24.541850 - DOI - PMC - PubMed
    1. Pedersen SF, Ho YC. SARS-CoV-2: A storm is raging. J Clin Invest. (2020). doi: 10.1172/JCI137647 - DOI - PMC - PubMed
    1. Harris E. Most COVID-19 deaths worldwide were among older people. JAMA. (2023) 329:704. doi: 10.1001/jama.2023.1554 - DOI - PubMed
    1. Bahgat MM, Nadeem R, Nasraa MH, Amer K, Hassan WA, ELGarhy FM, et al. . Proinflammatory cytokine profiles in both mild symptomatic and asymptomatic SARS-CoV-2-infected Egyptian individuals and a proposed relationship to post-COVID-19 sequela. Viral Immunol. (2023) 36:600–9. doi: 10.1089/vim.2023.0060 - DOI - PubMed

Publication types