. 2024 Apr 6;8(5):ziae036.
doi: 10.1093/jbmrpl/ziae036. eCollection 2024 May.

MiR-144-5p and miR-21-5p do not drive bone disease in a mouse model of type 1 diabetes mellitus

Affiliations

MiR-144-5p and miR-21-5p do not drive bone disease in a mouse model of type 1 diabetes mellitus

Souad Daamouch et al. JBMR Plus. .

Abstract

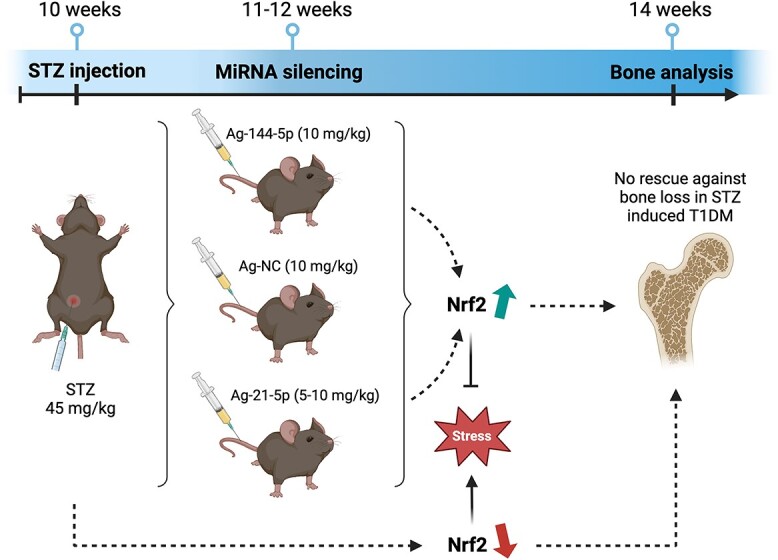
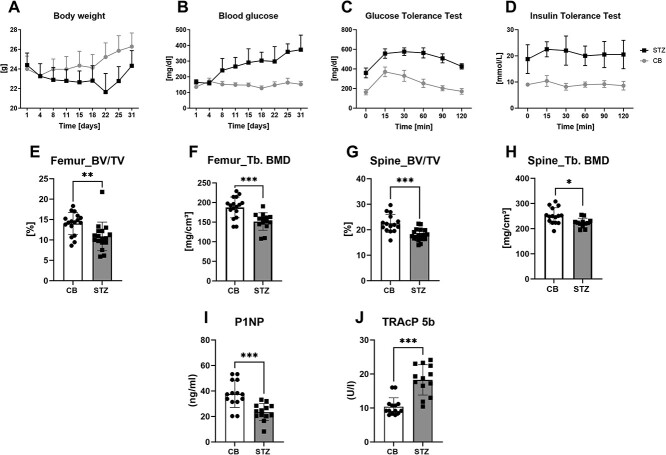
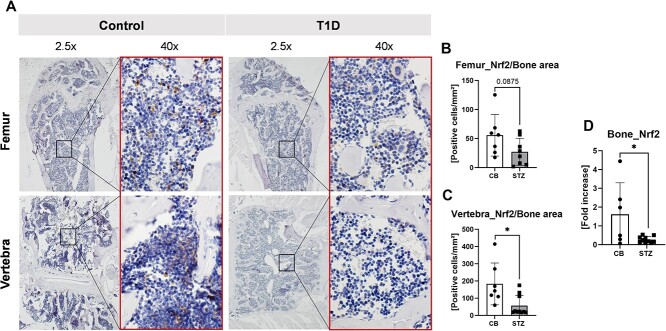
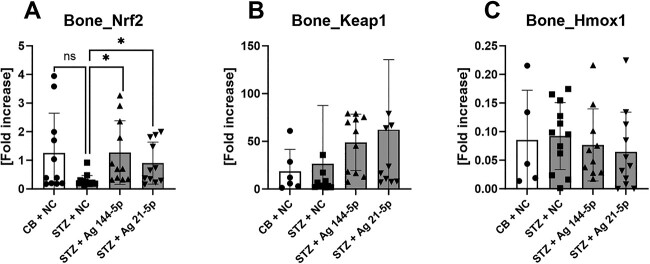
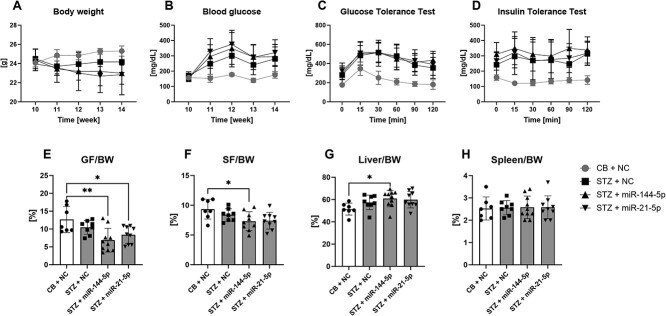
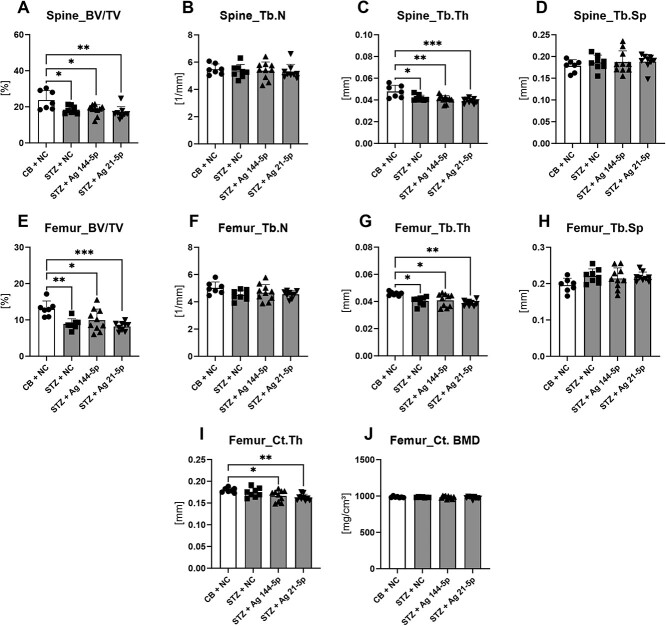
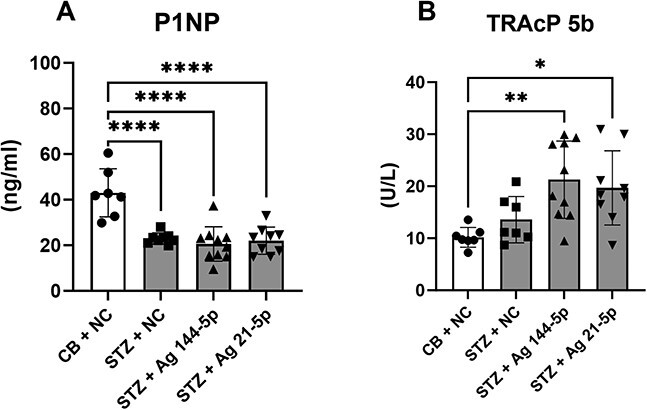
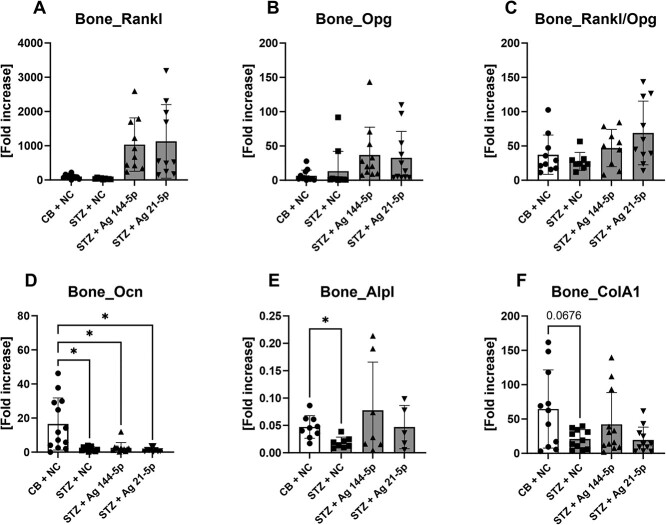
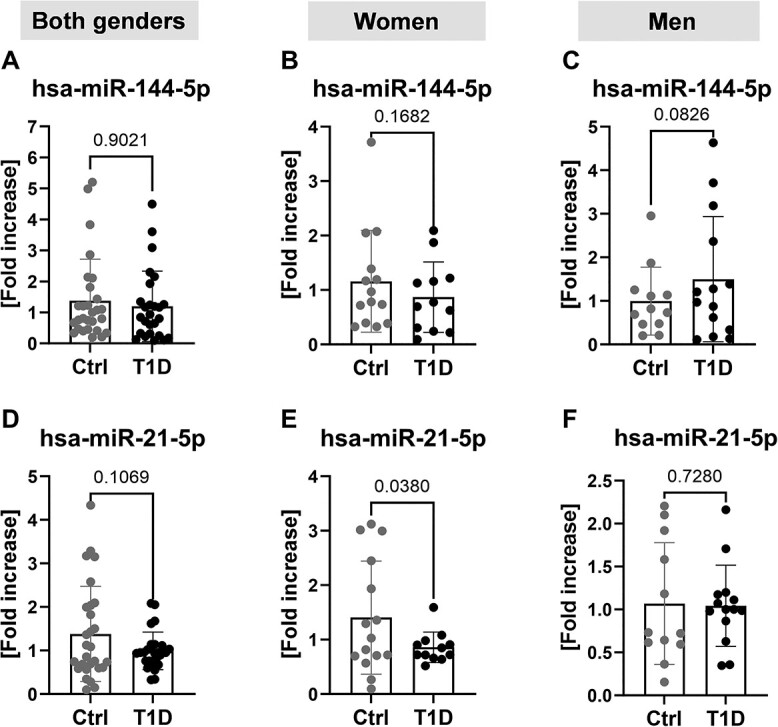
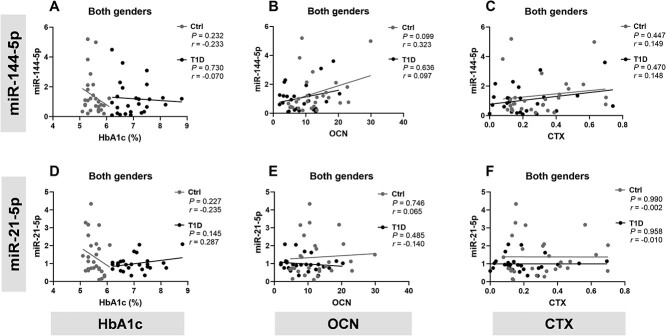
The increased risk of fractures in patients with type 1 diabetes mellitus (T1DM) is nowadays well recognized. However, the exact mechanism of action of diabetic bone disease has not been fully elucidated. MicroRNAs (miRNAs) are gene regulators that operate post-transcriptionally and have been implicated in the development of various metabolic disorders including T1DM. Previous studies have implicated a role for miR-144-5p and miR-21-5p, which are involved in controlling oxidative stress by targeting Nrf2, in T1DM. To date, it is unclear whether miR-144-5p and miR-21-5p affect bone health in T1DM. Thus, this study aimed to investigate the influence of miR-144-5p and miR-21-5p knockdown in the development of bone disease in T1DM male mice. Therefore, T1DM was induced in 10-wk-old male mice using streptozotocin (STZ). One week later, after development of hyperglycemia, antagomir-144-5p and antagomir-21-5p or their non-targeting control were administered at 10 mg/kg BW once a week until the end of the experiment. At 14 wk of age, glucose levels, bone, and fat mass were analyzed. The results revealed that treating T1DM male mice with antagomir-144-5p and antagomir-21-5p did not protect against diabetes development or bone loss, despite the successful downregulation of the miRNAs and the normalization of Nrf2 mRNA levels in bone tissue. Histological and serological parameters of bone formation or resorption were not altered by the antagomir treatment. Finally, we measured the expression of miRNA-144-5p or miRNA-21-5p in the serum of 30 individuals with T1DM and compared them to non-diabetic controls, but did not find an altered expression of either miRNA. In conclusion, the knockdown of miR-144-5p and miR-21-5p does not affect STZ-induced diabetes development or loss of bone mass in male mice. However, it does normalize expression of the anti-oxidant factor Nrf2 in diabetic bone tissue.

Keywords: T1DM; antagomir; bone loss; miR-144-5p; miR-21-5p.


Conflict of interest statement

M.B. received honoraria as a consultant and speaker from Amgen, AstraZeneca, Bayer, Boehringer-Ingelheim, Lilly, Novo Nordisk, Novartis, and Sanofi. L.C.H. received honoraria as a consultant and speaker from Amgen, Novo Nordisk, and UCB and support for clinical trials from Ascendis. M.R. received honoraria as a speaker from UCB and Santhera. M.H. is CEO and cofounder of TAmiRNA GmbH. M.H. and D.C.V. are employees of TAmiRNA GmbH. S.D. has no conflict of interest.

Figures

Graphical Abstract
Graphical Abstract
Figure 1
Figure 1
Decreased bone mass and formation in STZ-induced T1D mouse model. Body weight and blood glucose level were monitored from the beginning of the experiment until the end at 14 wk of age. Bone analysis and serum marker measurements in 14-wk-old male STZ-induced T1D (STZ) and their control littermates (CB). (A and B) Body weight and blood glucose level measurements. (C) A GTT and (D) ITT from 14-wk-old T1D (STZ) vs non-diabetic (CB) male mice was carried out. BV/TV and Tb.BMD were assessed using microCT for (E and F) femur and (G and H) and the fourth vertebral body. (I) Serum levels of the bone formation marker, P1NP, and (J) the bone resorption marker, TRAcP 5b were measured using ELISA. Data are presented as mean ± SD. Statistical analysis was performed using Student’s t-test, and significance levels are denoted in the graphs as *P < .05, **P < .01, ***P < .001. n = 13 to 17 per group.
Figure 2
Figure 2
Downregulation of Nrf2 in STZ-induced T1D bone compared to control littermates. Femur and vertebra samples from 14-wk-old mice with STZ-induced T1D (STZ) and their control littermates (CB) were subjected to immunohistochemistry for quantifying Nrf2-positive stained cells in bone/bone marrow area (Nrf2/bone area). In (A), the upper line shows Nrf2 staining in the femur, while the second line shows Nrf2 staining in the vertebra bone. (B) Nrf2 quantification in the femur and (C) in the vertebra is shown by immunohistochemistry. (D) Nrf2 gene expression from bone was determined by qPCR. Data are presented as mean ± SD. Statistical analysis was performed using Student’s t-test, and significance levels are denoted in the graphs as *P < .05. n = 6 to 8 per group.
Figure 3
Figure 3
MiR-144-5p and miR-21-5p deletion improve Nrf2 expression in bone tissue. (A–C) Nrf2, Keap1, and Hmox1 associated to oxidative stress were measured by qPCR. Data are presented as mean ± SD. Statistical analysis was performed by one-way ANOVA using Tukey’s multiple comparisons post hoc test. Statistical significance levels are denoted in the graphs as *P < .05. n = 5 to 13 per group.
Figure 4
Figure 4
Decreased GF and SF in miR-144-5p knockdown, associated with increased liver weight in STZ-induced T1D male mice. All mice were fed a standard diet for 14 wk. (A) Body weight (BW) was measured, (B) a weekly blood glucose measurement from week 10 until the end of the experiment week 14, (C) a GTT and (D) ITT from 14-wk-old T1D (STZ + NC and STZ + miR-144-5p/miR-21-5p) vs non-diabetic (CB + NC) mice was carried out. Percentage of body (E) gonadal, (F) subcutaneous fat pads (GF, SF), and (G) liver and (H) spleen were quantified. Data are presented as mean ± SD. Statistical analysis was performed by one-way ANOVA using Tukey’s multiple comparisons post hoc test. Statistical significance levels are denoted in the graphs as *P < .05, **P < .01. n = 7 to 10 per group.
Figure 5
Figure 5
Inhibition of miR-144-5p and miR-21-5p does not protect against STZ-induced bone loss. Bones of 14-wk-old T1D (STZ + NC and STZ + miR-144-5p/miR-21-5p) and non-diabetic (CB + NC) were analyzed by microCT. (A) Bone volume per total volume (BV/TV), (B) trabecular number (Tb.N), (C) trabecular thickness (Tb.Th), and (D) trabecular seperation (Tb.Sp) of the fourth vertebral body. Additionally, (E) BV/TV, (F) Tb.N, (G) Tb.Th, (H) Tb.Sp at the distal femur, (I) cortical thickness (Ct.Th) of the femoral midshaft and (J) cortical bone mineral density (Ct.BMD) of the femoral midshaft. Data are presented as mean ± SD. Statistical analysis was performed by one-way ANOVA using Tukey’s multiple comparisons post hoc test. Statistical significance levels are denoted in the graphs as *P < .05, **P < .01, ***P < .001. n = 7 to 10 per group.
Figure 6
Figure 6
MiR-144-5p and miR-21-5p deletion does not improve bone formation nor reduced bone resorption in STZ-induced T1D male mice. Serum samples from 14-wk-old T1D (STZ + NC and STZ + miR-144-5p/miR-21-5p) and non-diabetic (CB + NC) mice were used for quantification of bone turnover markers. Serum level of (A) bone formation marker P1NP and (B) bone resorption marker, TRAcP 5b were measured using ELISA. Data are presented as mean ± SD. Statistical analysis was performed by one-way ANOVA using Tukey’s multiple comparisons post hoc test. Statistical significance levels are denoted in the graphs as *P < .05, **P < .01, ****P < .001. n = 7 to 10 per group.
Figure 7
Figure 7
MiR-144-5p and miR-21-5p deletion does not improve osteogenic markers. Bones of all 14-wk-old mice were used for qPCR measurements. In the upper line (A–C), osteogenic markers were assessed for Rankl, Opg, and Rankl/Opg ratio, while in the second line (D–F), Ocn, Alpl, and Col1a1 associated to bone formation were assessed. Data are presented as mean ± SD. Statistical analysis was performed by one-way ANOVA using Tukey’s multiple comparisons post hoc test. Statistical significance levels are denoted in the graphs as *P < .05. n = 5 to 13 per group. Abbreviation: Alpl , alkaline phosphatase; Col1a1, collagen, type I, alpha 1; Ocn, osteocalcin; Opg, osteoprotegerin.
Figure 8
Figure 8
Comparative expression levels of miR-144-5p and miR-21-5p in T1D vs non-diabetic individuals. Serum samples from all participants were used for qPCR measurements. In the upper line (A–C), miR-144-5p was assessed in (A) both genders, (B) women, and (C) men, while in the subsequent row (D–F), miR-21-5p was evaluated in (D) both genders, (E) women, and (F) men. Ctrl (control group of non-diabetic individuals), T1D (type 1 diabetes subjects). Statistical analysis was performed using Student’s t-test, and significance levels are denoted in the graphs as P < .05. n = 12 to 15 per group.
Figure 9
Figure 9
MiR-144-5p and miR-21-5p have no effect on HbA1c, nor on bone formation or bone resorption markers in T1D patients. Serum samples from all participants underwent HbA1c, OCN, and CTX measurements. Subsequent correlation analyses were conducted in T1D patients and control volunteers. In the upper panel (A–C), correlation analyses with miR-144-5p were performed with (A) HbA1c (%) level, (B) OCN, and (C) CTX markers. In the following row (D–F), identical analyses were performed for miR-21-5p. Here, no gender-based distinctions emerged, since no relevant variations were observed. The following annotations “P” indicates the P-value and “r” designates the Pearson correlation coefficient. Statistical analysis was performed using Pearson’s correlation. n = 28 to 30 per group. HbA1c , hemoglobin A1c.

Similar articles

Cited by

References

    1. Powers AC. Type 1 diabetes mellitus: much progress, many opportunities. J Clin Invest. 2021;131(8):e142242. 10.1172/JCI142242 - DOI - PMC - PubMed
    1. Maahs DM, West NA, Lawrence JM, Mayer-Davis EJ. Epidemiology of type 1 diabetes. Endocrinol Metab Clin N Am. 2010;39(3):481–497. 10.1016/j.ecl.2010.05.011 - DOI - PMC - PubMed
    1. Zajec A, Trebušak Podkrajšek K, Tesovnik T, et al. . Pathogenesis of type 1 diabetes: established facts and new insights. Genes. 2022;13(4):706. 10.3390/genes13040706 - DOI - PMC - PubMed
    1. Primavera M, Giannini C, Chiarelli F. Prediction and prevention of type 1 diabetes. Front Endocrinol. 2020;11:248. 10.3389/fendo.2020.00248 - DOI - PMC - PubMed
    1. Buzzetti R, Tuomi T, Mauricio D, et al. . Management of latent autoimmune diabetes in adults: a consensus statement from an international expert panel. Diabetes. 2020;69(10):2037–2047. 10.2337/dbi20-0017 - DOI - PMC - PubMed