. 2024 Mar 28:14:1364097.
doi: 10.3389/fcimb.2024.1364097. eCollection 2024.

Unraveling intestinal microbiota's dominance in polycystic ovary syndrome pathogenesis over vaginal microbiota

Affiliations

Unraveling intestinal microbiota's dominance in polycystic ovary syndrome pathogenesis over vaginal microbiota

Xia Yu et al. Front Cell Infect Microbiol. .

Abstract

Background: Polycystic ovary syndrome (PCOS) is a prevalent endocrine disease in women, intricately linked to hormonal imbalances. The microbiota composition plays a pivotal role in influencing hormonal levels within the body. In this study, we utilized a murine model to investigate how intestinal and vaginal microbiota interact with hormones in the development of PCOS.

Methods: Twenty female mice were randomly assigned to the normal group (N) and the model group (P), where the latter received daily subcutaneous injections of 0.1 mL DHEA (6 mg/100 g). Throughout the experiment, we evaluated the PCOS mouse model by estrus cycle, serum total testosterone (T), prolactin (PRL) and luteinizing hormone (LH) levels, and ovarian pathological morphology. The microbial composition in both intestinal content and vaginal microbiota were studied by 16S rRNA gene high-throughput sequencing.

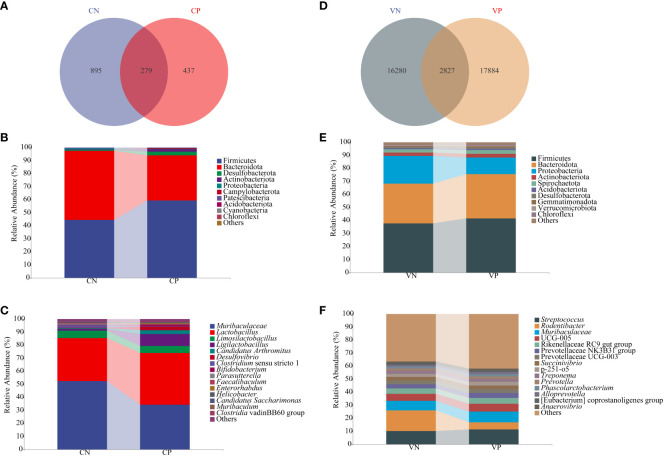
Results: Compared with the N group, the P group showed significant increases in body weight, T, and PRL, with significant decrease in LH. Ovaries exhibited polycystic changes, and the estrous cycle was disrupted. The intestinal microbiota result shows that Chao1, ACE, Shannon and Simpson indexes were decreased, Desulfobacterota and Acidobacteriota were increased, and Muribaculaceae, Limosilactobacillus and Lactobacillus were decreased in the P group. T was significantly positively correlated with Enterorhabdus, and LH was significantly positively correlated with Lactobacillus. The analysis of vaginal microbiota revealed no significant changes in Chao1, ACE, Shannon, and Simpson indices. However, there were increased in Firmicutes, Bacteroidota, Actinobacteriota, Streptococcus, and Muribaculaceae. Particularly, Rodentibacter displayed a robust negative correlation with other components of the vaginal microbiota.

Conclusion: Therefore, the response of the intestinal microbiota to PCOS is more significant than that of the vaginal microbiota. The intestinal microbiota is likely involved in the development of PCOS through its participation in hormonal regulation.

Keywords: dehydroepiandrosterone; intestinal microbiota; polycystic ovary syndrome; sex hormone; vaginal microbiota.


Conflict of interest statement

The authors declare that the research was conducted in the absence of any commercial or financial relationships that could be construed as a potential conflict of interest.

Figures

Figure 1
Figure 1
(A) Box line plots illustrating the changes in body weight of mice in the N group and the P group, (B) vaginal smears of mice in the N group, and (C) vaginal smears of mice in the P group (N: the normal group, P: the model group). **P<0.01, ***P<0.01.
Figure 2
Figure 2
(A) HE staining of ovarian tissues in the N group (200X), (B) HE staining of ovarian tissues in the N group (400X), (C) HE staining of ovarian tissues in the P group (200X), (D) HE staining of ovarian tissues in the P group (400X), (E) serum levels of T, (F) serum levels of PRL, and (G) serum levels of LH (N, the normal group; P, the model group). **P<0.01,***P<0.01.
Figure 3
Figure 3
(A) Shannon dilution curve of mouse intestinal microbiota, (B) Alpha diversity of mouse intestinal microbiota, (C) PCoA analysis of mouse intestinal microbiota based on the Bray-Curtis distance algorithm, (D) Shannon dilution curve of mouse vaginal microbiota, (E) Alpha diversity of mouse vaginal microbiota, and (F) PCoA analysis of mouse vaginal microbiota based on the Bray-Curtis distance algorithm for PCoA analysis of mouse vaginal microbiota (CN, intestinal microbiota in the normal group; CP, intestinal microbiota in the model group; VN, vaginal microbiota in the normal group; VP, vaginal microbiota in the model group).
Figure 4
Figure 4
(A) ASV count of mouse intestinal microbiota, (B) Relative abundance of mouse intestinal microbiota at the phylum level (C) Relative abundance of mouse intestinal microbiota at the genus level, (D) ASV count of mouse vaginal microbiota, (E) Relative abundance of mouse vaginal microbiota at the phylum level, and (F) Relative abundance of mouse vaginal microbiota at the genus level (CN, intestinal microbiota in the normal group; CP, intestinal microbiota in the model group; VN, vaginal microbiota in the normal group; VP, vaginal microbiota in the model group).
Figure 5
Figure 5
(A) Evolutionary branching diagram of LEfSe analysis of mouse intestinal microbiota, (B) Histogram of LDA value distribution of mouse intestinal microbiota, (C) Evolutionary branching diagram of LEfSe analysis of mouse vaginal microbiota, (D) Histogram of LDA value distribution of mouse vaginal microbiota (The current LDA threshold is 2, CN, intestinal microbiota in the normal group; CP, intestinal microbiota in the model group; VN, vaginal microbiota in the normal group; VP, vaginal microbiota in the model group).
Figure 6
Figure 6
(A) Sankey diagram of primary and secondary metabolic pathways of intestinal microbiota, (B) Histogram of horizontal distribution of secondary and tertiary metabolic pathways of intestinal microbiota, (C) Sankey diagram of primary and secondary metabolic pathways of vaginal microbiota, (D) Histogram of horizontal distribution of secondary and tertiary metabolic pathways of vaginal microbiota.
Figure 7
Figure 7
Correlation network diagram: (A) Correlation heatmap between intestinal microbiota and body weight (W3), T, PRL, and LH, (B) Correlation heatmap between vaginal microbiota and W3, T, PRL, and LH. Red indicates a positive correlation, and blue indicates a negative correlation. The solid line denotes P < 0.05, while the dashed line denotes P > 0.05. The R-value signifies the correlation strength: very weak (0.00-0.19), weak (0.20-0.39), moderate (0.40-0.59), strong (0.60-0.79), and very strong (0.80-1.00).

References

    1. Baek G. H., Yoo K. M., Kim S. Y., Lee D. H., Chung H., Jung S. C. (2023). Collagen peptide exerts an anti-obesity effect by influencing the firmicutes/bacteroidetes ratio in the gut. Nutrients 15, 2610. doi: 10.3390/nu15112610 - DOI - PMC - PubMed
    1. Benga L., Knorr J. I., Engelhardt E., Gougoula C., Benten P. M., Christensen H., et al. . (2019). Current distribution of rodentibacter species among the mice and rats of an experimental facility. J. Am. Assoc. Lab. Anim. Sci. 58, 475–478. doi: 10.30802/AALAS-JAALAS-19-000001 - DOI - PMC - PubMed
    1. Brouwer S., Rivera-Hernandez T., Curren B. F., Harbison-Price N., De Oliveira D. M. P., Jespersen M. G. (2023). Pathogenesis, epidemiology and control of Group A Streptococcus infection. Nat. Rev. Microbiol. 21, 431–447. doi: 10.1038/s41579-023-00865-7 - DOI - PMC - PubMed
    1. Buchta V. (2018). Vaginal microbiome. Ceska Gynekol 83, 371–379. - PubMed
    1. Caldwell A. S., Middleton L. J., Jimenez M., Desai R., McMahon A. C., Allan C. M. (2014). Characterization of reproductive, metabolic, and endocrine features of polycystic ovary syndrome in female hyperandrogenic mouse models. Endocrinology 155, 3146–3159. doi: 10.1210/en.2014-1196 - DOI - PubMed