

Effect of a probiotic and an antibiotic on the mobilome of the porcine microbiota
- PMID: 38606356
- PMCID: PMC11006968
- DOI: 10.3389/fgene.2024.1355134
Effect of a probiotic and an antibiotic on the mobilome of the porcine microbiota
Abstract
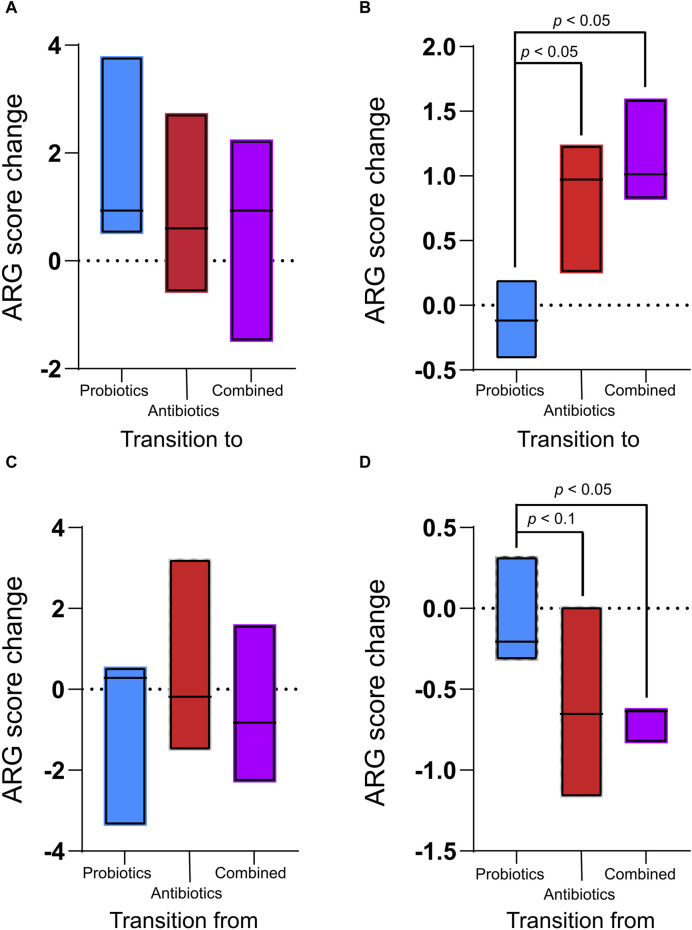
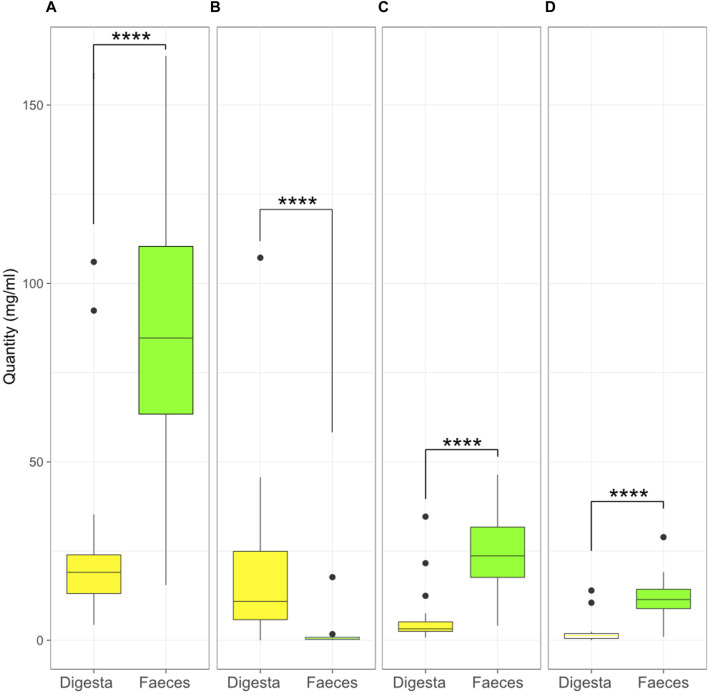
Introduction: To consider the growing health issues caused by antibiotic resistance from a "one health" perspective, the contribution of meat production needs to be addressed. While antibiotic resistance is naturally present in microbial communities, the treatment of farm animals with antibiotics causes an increase in antibiotic resistance genes (ARG) in the gut microbiome. Pigs are among the most prevalent animals in agriculture; therefore, reducing the prevalence of antibiotic-resistant bacteria in the pig gut microbiome could reduce the spread of antibiotic resistance. Probiotics are often studied as a way to modulate the microbiome and are, therefore, an interesting way to potentially decrease antibiotic resistance. Methods: To assess the efficacy of a probiotic to reduce the prevalence of ARGs in the pig microbiome, six pigs received either treatment with antibiotics (tylvalosin), probiotics (Pediococcus acidilactici MA18/5M; Biopower® PA), or a combination of both. Their faeces and ileal digesta were collected and DNA was extracted for whole genome shotgun sequencing. The reads were compared with taxonomy and ARG databases to identify the taxa and resistance genes in the samples. Results: The results showed that the ARG profiles in the faeces of the antibiotic and combination treatments were similar, and both were different from the profiles of the probiotic treatment (p < 0.05). The effects of the treatments were different in the digesta and faeces. Many macrolide resistance genes were detected in a higher proportion in the microbiome of the pigs treated with antibiotics or the combination of probiotics and antibiotics. Resistance-carrying conjugative plasmids and horizontal transfer genes were also amplified in faeces samples for the antibiotic and combined treatments. There was no effect of treatment on the short chain fatty acid content in the digesta or the faeces. Conclusion: There is no positive effect of adding probiotics to an antibiotic treatment when these treatments are administered simultaneously.
Keywords: antibiotics resistance; digesta; faeces; gut microbiome; metagenomics; plasmids; swine.
Copyright © 2024 Monger, Saucier, Guay, Turcotte, Lemieux, Pouliot, Fournaise and Vincent.
Conflict of interest statement
Authors EP and SF were employed by Olymel S.E.C./L.P. The remaining authors declare that the research was conducted in the absence of any commercial or financial relationships that could be construed as a potential conflict of interest.
Figures


Similar articles
-
Combined supplementation of Lactobacillus fermentum and Pediococcus acidilactici promoted growth performance, alleviated inflammation, and modulated intestinal microbiota in weaned pigs.BMC Vet Res. 2019 Jul 10;15(1):239. doi: 10.1186/s12917-019-1991-9. BMC Vet Res. 2019. PMID: 31291967 Free PMC article.
-
Metagenome-assembled genome reveals species and functional composition of Jianghan chicken gut microbiota and isolation of Pediococcus acidilactic with probiotic properties.Microbiome. 2024 Feb 12;12(1):25. doi: 10.1186/s40168-023-01745-1. Microbiome. 2024. PMID: 38347598 Free PMC article.
-
Effects of probiotics Pediococcus acidilactici strain MA18/5M and Saccharomyces cerevisiae subsp. boulardii strain SB-CNCM I-1079 on fecal and intestinal microbiota of nursing and weanling piglets.J Anim Sci. 2015 Nov;93(11):5313-26. doi: 10.2527/jas.2015-9190. J Anim Sci. 2015. PMID: 26641051 Clinical Trial.
-
Good microbes, bad genes? The dissemination of antimicrobial resistance in the human microbiome.Gut Microbes. 2022 Jan-Dec;14(1):2055944. doi: 10.1080/19490976.2022.2055944. Gut Microbes. 2022. PMID: 35332832 Free PMC article. Review.
-
New insights of bacterial communities in fermented vegetables from shotgun metagenomics and identification of antibiotic resistance genes and probiotic bacteria.Food Res Int. 2022 Jul;157:111190. doi: 10.1016/j.foodres.2022.111190. Epub 2022 Mar 26. Food Res Int. 2022. PMID: 35761518 Review.
Cited by
-
Resilience of Loin Meat Microbiota and of Resistance Genes to a Chlortetracycline Treatment in Weaned Piglets.Antibiotics (Basel). 2024 Oct 21;13(10):997. doi: 10.3390/antibiotics13100997. Antibiotics (Basel). 2024. PMID: 39452263 Free PMC article.
References
-
- Bushnell B. (2014). BBmap. Available at: https://sourceforge.net/projects/bbmap/(Accessed October 13, 2021).