. 2024 May 1;137(9):jcs262140.
doi: 10.1242/jcs.262140. Epub 2024 May 14.

Mapping the global interactome of the ARF family reveals spatial organization in cellular signaling pathways

Affiliations

Mapping the global interactome of the ARF family reveals spatial organization in cellular signaling pathways

Laura Quirion et al. J Cell Sci. .

Abstract

The ADP-ribosylation factors (ARFs) and ARF-like (ARL) GTPases serve as essential molecular switches governing a wide array of cellular processes. In this study, we used proximity-dependent biotin identification (BioID) to comprehensively map the interactome of 28 out of 29 ARF and ARL proteins in two cellular models. Through this approach, we identified ∼3000 high-confidence proximal interactors, enabling us to assign subcellular localizations to the family members. Notably, we uncovered previously undefined localizations for ARL4D and ARL10. Clustering analyses further exposed the distinctiveness of the interactors identified with these two GTPases. We also reveal that the expression of the understudied member ARL14 is confined to the stomach and intestines. We identified phospholipase D1 (PLD1) and the ESCPE-1 complex, more precisely, SNX1, as proximity interactors. Functional assays demonstrated that ARL14 can activate PLD1 in cellulo and is involved in cargo trafficking via the ESCPE-1 complex. Overall, the BioID data generated in this study provide a valuable resource for dissecting the complexities of ARF and ARL spatial organization and signaling.

Keywords: ARF GTPases; ARF-like GTPases, ARLs; BioID proteomics; ESCPE-1; Effector proteins; PLD1.


Conflict of interest statement

Competing interests The authors declare no competing or financial interests.

Figures
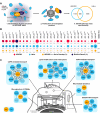
Fig. 1.
Fig. 1.
The ARF proximity interaction network defined by BioID. (A) Workflow of the proximity-dependent biotin identification (BioID) performed on constitutively active (CA) ARF family baits fused to BirA*–Flag. The Venn diagram illustrates unique and shared interactions between cell lines. (B) Proportional area chart illustrates interactions for each bait in HEK293 (red) and HeLa (light blue) cells, overlapped with those reported in the literature (dark blue) and proportionate to the total interactions in both cell lines. Overlap between cell lines (orange) is also represented. Numbers denotes the overlap percentage. The total overlap and recall percentages are presented under the global column. (C) Known interactors of ARF/ARL GTPases identified by BioID. Interactors depicted in lighter blue were detected but did not pass our stringent thresholding. EE, early endosomes; ER, endoplasmic reticulum; TGN, trans-Golgi network.
Fig. 2.
Fig. 2.
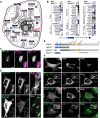
ARF location assignment from BioID results. (A) Illustration of the top three cellular compartments (top four in case of ties) enriched for each ARF/ARL as assigned by Human Cell Map. (B) Dotplots presenting the preys enriched in the top three cellular compartments identified with Human Cell Map for the indicated active baits. Darker circles represent higher spectral counts and circle size shows relative abundance. Average probability ≥0.95. AvgSpec, average spectral count. (C) Flp-In HeLa cells expressing POP1–YFP and active ARL4D–BirA*–Flag were stained with anti-Flag and Alexa Fluor 633-conjugated streptavidin (blue arrowheads, nucleoli; n, nucleus). Scale bar: 10 µm. (D) Co-immunostaining of Flp-In HeLa cells expressing ARL10WT–GFP with anti-TOM20 (mitochondria marker) and anti-PEX14 (peroxisome marker). Scale bar: 10 µm. (E) Schematic representations of the ARL10 fragments used in this study. The N-terminal region (dark gray) includes the putative transmembrane (TM) domain (blue) and the ARF GTPase domain (light gray) includes the N-loop, switch I and switch II domains. (F) Immunostaining with anti-TOM20 or anti-GM130 (Golgi marker) of Flp-In HeLa cells expressing the indicated chimeric proteins. Scale bar: 10 µm. Images are representative of n=3 independent experiments. EE, early endosomes; ER, endoplasmic reticulum; ERGIC, ER–Golgi intermediate compartment; LE, late endosomes; PM, plasma membrane; RE, recycling endosomes.
Fig. 3.
Fig. 3.
Clustering of ARF and ARL candidate effectors. (A) Heatmap of the specificity of interactors of ARFs/ARLs, determined by Pearson correlation. Dark purple signals represent the highest level of bait–prey specificity (highest WDS score). (B) Zoom into cluster 1, which is specific to active SAR1B, reveals the presence of proteins involved in COPII machinery (blue) and lipid biosynthesis (orange). (C,D) Zoom into cluster 5 (C), which is associated with active ARL4D, or into clusters 2 and 3 (D), which are linked to active ARL10, are shown on the top. The bottom panels represent an enrichment map of overrepresented Gene Ontology ‘biological processes’ for the corresponding clusters. Node size reflects the number of proteins associated with each term, and the length of the edges indicates the interconnectivity between terms. Bold text indicates grouped processes.
Fig. 4.
Fig. 4.
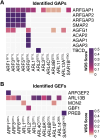
Mapping of ARF regulators. Heatmaps illustrate the specificity of GAPs (A) and GEFs (B), as identified through BioID. Dark purple indicates the highest level of bait–prey specificity, as determined by the WDS score.
Fig. 5.
Fig. 5.
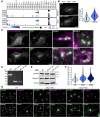
Characterization of ARL14, a PLD1 activator. (A) Schematic representation of the murine Arl14 coding region (one exon), targeted for genome editing. The genotyping strategy is indicated with arrows representing the different primers used in B. (B) Genotyping results of ARL14+/+ (WT) or ARL143×Flag/+ knock-in mice. (C) Western blots for proteins isolated from organs of ARL14+/+ or ARL143×Flag/+ knock-in mice at age postnatal day 65. The asterisks (*) indicate the bands of interest. Coomassie staining was used as a loading control (n=3). (D) The graph represents preys identified in ARL14 BioID, showing the normalized spectral counts (CBNP) on the x-axis and the log2 fold change against the mean of the negative controls on the y-axis. (E) Dotplot showing proximity interactions of PLD1 with ARF GTPases. Darker circle colors represent higher spectral counts, circle sizes denote relative abundance, and circle outlines correspond to the indicated average probability (AvgP). AvgSpec, average spectral count. (F) Proximity ligation assay (PLA) on Flp-In HeLa cells expressing HA–PLD1 and ARL14–GFP. Cells expressing HA–PLD1 and GFP alone were used as a control. F-actin staining (not shown) was used to delineate the cell outline. Scale bar: 10 µm. (G) The violin plot illustrates the number of PLA puncta per cell from the experiment presented in F (total of 75 cells per condition; n=3). P-value was calculated by two-tailed unpaired Student’s t-test; ***P<0.0001. (H) Measurements of PLD activity using IMPACT on ARF1WT and ARL14WT. The graph shows the relative IMPACT fluorescence (mean±s.d.) quantified by flow cytometry (n=3). P-values were calculated by one-way ANOVA, followed by Bonferroni's test; **P<0.001; ***P<0.0001.
Fig. 6.
Fig. 6.
ARL14 has poor affinity for nucleotides. (A,C) NMR spectra of purified ARL14 (A) or ARL11 (C) incubated with GDP or GTPγS. (B,D) Isothermal titration calorimetry analysis of ARL14 (B) or ARL11 (D) with GDP or GTPγS. Kd, dissociation constant.
Fig. 7.
Fig. 7.
ARL14 is involved in CI-MPR retrograde trafficking through ESCPE-1. (A) Dotplots showing the proximity interactions of the ESCPE-1 complex components (SNX1, SNX2, SNX5 and SNX6) with ARF GTPases. Darker circle colors represent higher spectral counts, circle sizes represent relative abundance, and circle outlines correspond to the indicated average probability (AvgP). AvgSpec, average spectral count. (B) Proximity ligation assay (PLA) was conducted on endogenous SNX1 and overexpressed GFP versus ARL14WT–GFP in Flp-In HeLa cells. Scale bar: 10 µm. The violin plot shows the quantification of the number of PLA puncta per cell (total of 90 cells per condition; n=3). P-value was calculated by two-tailed unpaired Student’s t-test; ***P<0.0001. (C) SNX1 immunostaining in Flp-In HeLa cells expressing ARL14WT–mScarlet or the active variant (Q68L). Scale bar: 10 µm. Images are representative of n=3 independent experiments. (D) Validation of ARL14 knockout (KO) in A549 cells by PCR. The genotyping strategy predicts a band of 610 bp in wild-type (WT) cells and of 280 bp in KO cells. (E) Western blot of total proteins extracted from WT or ARL14 KO A549 cells demonstrating no alterations in the expression level of CI-MPR or Golgin97. (F) Violin plot shows the quantification of the integrated density (IntDen) outside the TGN relative to that in the control, for each condition presented in G (total of 120 cells per condition; n=3). P-values were calculated by one-way ANOVA, followed by Bonferroni's test; ***P<0.0001. (G) Co-immunostaining was performed using anti-Golgin97 (TGN marker) and anti-CI-MPR in WT or ARL14 KO A549 cells. Dotted lines delineate cell outlines, which were defined using F-actin staining (not shown). Scale bar: 10 µm.

Update of

References

    1. Abou Jamra, R., Philippe, O., Raas-Rothschild, A., Eck, S. H., Graf, E., Buchert, R., Borck, G., Ekici, A., Brockschmidt, F. F., Nothen, M. M.et al. (2011). Adaptor protein complex 4 deficiency causes severe autosomal-recessive intellectual disability, progressive spastic paraplegia, shy character, and short stature. Am. J. Hum. Genet. 88, 788-795. 10.1016/j.ajhg.2011.04.019 - DOI - PMC - PubMed
    1. Alamudi, S. H., Satapathy, R., Kim, J., Su, D., Ren, H., Das, R., Hu, L., Alvarado-Martinez, E., Lee, J. Y., Hoppmann, C.et al. (2016). Development of background-free tame fluorescent probes for intracellular live cell imaging. Nat. Commun. 7, 11964. 10.1038/ncomms11964 - DOI - PMC - PubMed
    1. Amor, J. C., Harrison, D. H., Kahn, R. A. and Ringe, D. (1994). Structure of the human ADP-ribosylation factor 1 complexed with GDP. Nature 372, 704-708. 10.1038/372704a0 - DOI - PubMed
    1. Antonny, B., Beraud-Dufour, S., Chardin, P. and Chabre, M. (1997). N-terminal hydrophobic residues of the G-protein ADP-ribosylation factor-1 insert into membrane phospholipids upon GDP to GTP exchange. Biochemistry 36, 4675-4684. 10.1021/bi962252b - DOI - PubMed
    1. Araki, M., Yoshimoto, K., Ohta, M., Katada, T. and Kontani, K. (2021). Development of a versatile HPLC-based method to evaluate the activation status of small GTPases. J. Biol. Chem. 297, 101428. 10.1016/j.jbc.2021.101428 - DOI - PMC - PubMed

Publication types