. 2024 Apr 12:12:RP93284.
doi: 10.7554/eLife.93284.

The evolution of transposable elements in Brachypodium distachyon is governed by purifying selection, while neutral and adaptive processes play a minor role

Affiliations

The evolution of transposable elements in Brachypodium distachyon is governed by purifying selection, while neutral and adaptive processes play a minor role

Robert Horvath et al. Elife. .

Abstract

Understanding how plants adapt to changing environments and the potential contribution of transposable elements (TEs) to this process is a key question in evolutionary genomics. While TEs have recently been put forward as active players in the context of adaptation, few studies have thoroughly investigated their precise role in plant evolution. Here, we used the wild Mediterranean grass Brachypodium distachyon as a model species to identify and quantify the forces acting on TEs during the adaptation of this species to various conditions, across its entire geographic range. Using sequencing data from more than 320 natural B. distachyon accessions and a suite of population genomics approaches, we reveal that putatively adaptive TE polymorphisms are rare in wild B. distachyon populations. After accounting for changes in past TE activity, we show that only a small proportion of TE polymorphisms evolved neutrally (<10%), while the vast majority of them are under moderate purifying selection regardless of their distance to genes. TE polymorphisms should not be ignored when conducting evolutionary studies, as they can be linked to adaptation. However, our study clearly shows that while they have a large potential to cause phenotypic variation in B. distachyon, they are not favored during evolution and adaptation over other types of mutations (such as point mutations) in this species.

Keywords: brachypodium distachyon; evolutionary biology; model grass species; poaceae.


Conflict of interest statement

RH, NM, YB, AR No competing interests declared

Figures

Figure 1.
Figure 1.. Distribution of the studied accessions and TE polymorphism frequencies.
(A) Map showing the geographical distribution of the accessions (n = 326) used in the current study. The phylogenetic tree illustrates the phylogeny between the five genetic clades. This panel was made based on the data and results published by Stritt et al., 2022 and Minadakis et al., 2023. (B) Observed (blue, n = 97,660) and simulated (gray, n = 100,000) XtX values of TE polymorphisms in B. distachyon. Dotted lines show the 2.5% and 97.5% quantiles of the simulated XtX values. (C-G) Folded site frequency spectrum of TE polymorphisms and synonymous SNPs in all clades. (C) A_East (nTE = 37,563; nSNP = 92,130); (D) A_Italia (nTE = 32,753; nSNP = 82,101); E: B_West (nTE = 48,315; nSNP = 99,953); F: B_East (nTE = 25,757; nSNP = 60,539); G: C (nTE = 24,161 ; nSNP = 78,681). Principal Component Analyses using TE, SNP, retrotransposon and DNA-transposon are shown in Figure 1—figure supplements 1 and 2. Observed correlation between age in generations and frequency of synonymous SNPs in the four derived genetic clades are shown in Figure 1—figure supplement 3. Distribution of the observed TE age scaled by the effective population size (Ne) in the four derived genetic clades are shown in Figure 1—figure supplement 4. Folded site frequency spectrum of DNA-transposons and retrotransposons are shown in Figure 1—figure supplements 5 and 6.
Figure 1—figure supplement 1.
Figure 1—figure supplement 1.. Principal Component Analyses using TE (left panel, n = 97,660) and SNP (right panel, n = 182,801) polymorphisms.
Figure 1—figure supplement 2.
Figure 1—figure supplement 2.. Principal Component Analyses using retrotransposon (left panel, n = 9,172) and DNA-transposon (right panel, n = 52,249) polymorphisms.
Figure 1—figure supplement 3.
Figure 1—figure supplement 3.. Observed correlation between age in generations and frequency of synonymous SNPs in the four derived genetic clades.
The red points show the expected age of a neutrally evolving mutation at a specific frequency based on the predictions of Kimura and Ohta, 1973. (A) A_East (n = 48,604); (B) A_Italia (n = 36,881); (C) B_West (n = 64,794) and (D) B_East (n = 36,892).
Figure 1—figure supplement 4.
Figure 1—figure supplement 4.. Distribution of the observed TE age scaled by the effective population size (Ne) in the four derived genetic clades of B. distachyon.
The age estimates were scaled by the effective population size to improve readability (n = 28,650; 13,867; 15,683; 26,672; respectively).
Figure 1—figure supplement 5.
Figure 1—figure supplement 5.. Folded site frequency spectrum of DNA-transposons and synonymous SNPs in all genetic clades.
Panel (A) A_East (nTE = 20,206 ; nSNP = 92,130); (B) A_Italia (nTE = 16,801 ; nSNP = 82,101); (C) B_West (nTE = 27,603 ; nSNP = 99,953); (D) B_East (nTE = 15,693 ; nSNP = 60,539); (E) C (nTE = 10,948 ; nSNP = 78,681).
Figure 1—figure supplement 6.
Figure 1—figure supplement 6.. Folded site frequency spectrum of retrotransposons and synonymous SNPs in all genetic clades.
(A) A_East (nTE = 3,677 ; nSNP = 92,130); (B) A_Italia (nTE = 3,589 ; nSNP = 82,101); (C) B_West (nTE = 4,590 ; nSNP = 99,953); (D) B_East (nTE = 2,537 ; nSNP = 60,539); (E) C (nTE = 2,897 ; nSNP = 78,681).
Figure 2.
Figure 2.. Age-adjusted SFS of retrotransposons.
The top row shows the age-adjusted SFS of all retrotransposons (colored), non-synonymous SNPs (light gray) and high effect SNPs (dark gray) in the four derived clades. The bottom row shows the age-adjusted SFS of retrotransposons based on their distance to the next gene in the four derived clades. The X axes show the age range of the mutations in each bin, and the age range of each bin was chosen so that each bin represents the same number of retrotransposon observations in the top row. The different columns show the four derived clades: (A) A_East (nretrotransposon = 2,106, nnon-synonymous SNP = 10,000, nhigh effect SNP = 9,050, nretrotransposon in genes and 1 kb surrounding = 733, nretrotransposon between 1 and 5 kb away from genes = 664, nretrotransposon more than 5 kb away from genes = 709); (B) A_Italia (nretrotransposon = 1,232, nnon-synonymous SNP = 10,000, nhigh effect SNP = 7,273, nretrotransposon in genes and 1 kb surrounding = 390, nretrotransposon between 1 and 5 kb away from genes = 388, nretrotransposon more than 5 kb away from genes = 454); (C) B_West (nretrotransposon = 2,081, nnon-synonymous SNP = 10,000, nhigh effect SNP = 10,000, nretrotransposon in genes and 1 kb surrounding = 812, nretrotransposon between 1 and 5 kb away from genes = 647, nretrotransposon more than 5 kb away from genes = 622); (D) B_East (nretrotransposon = 1,035 , nnon-synonymous SNP = 10,000, nhigh effect SNP = 6,306, nretrotransposon in genes and 1 kb surrounding = 387, nretrotransposon between 1 and 5 kb away from genes = 311, nretrotransposon more than 5 kb away from genes = 337). Boxplots are based on 100 estimations of D frequency. Significant deviations of D frequency estimates from 0 in the age-adjusted SFS of retrotransposons are shown with asterisks (one-side Wilcoxon tests, Bonferroni corrected p-value <0.01: ***). Age-adjusted SFS of DNA-transposons are shown in Figure 2—figure supplement 1. Age-adjusted SFS of simulated mutations under negative selection in the four derived clades transposons are shown in Figure 2—figure supplement 2. Age-adjusted SFS of retrotransposons in accessions with at least 20 x coverage are shown in Figure 2—figure supplement 3. Age-adjusted SFS of retrotransposons more than 5 kb away from genes are shown in Figure 2—figure supplement 4. Age-adjusted SFS of Copia, Ty3, Helitron and MITE TEs are shown in Figure 2—figure supplements 5–8.
Figure 2—figure supplement 1.
Figure 2—figure supplement 1.. Age-adjusted SFS of DNA-transposons (colored), non-synonymous SNPs (light gray) and high effect SNPs (dark gray) in the four derived clades.
The X axes show the age range of the mutations in each bin, and the age range of each bin was chosen so that each bin represents the same number of DNA-transposons observations. (A) A_East (nDNA-transposon = 17,053, nnon-synonymous SNP = 10,000, nhigh effect SNP = 9,050); (B) A_Italia (nDNA-transposon = 7,538, nnon-synonymous SNP = 10,000, nhigh effect SNP = 9,050); (C) B_West (nDNA-transposon = 16,335, nnon-synonymous SNP = 10,000, nhigh effect SNP = 9,050); (D) B_East (nDNA-transposon = 10,101, nnon-synonymous SNP = 10,000, nhigh effect SNP = 9,050). Boxplots are based on 100 estimations of Δ frequency. Significant deviations of Δ frequency estimates from 0 in the age-adjusted SFS of DNA-transposons are shown with asterisks (one-side Wilcoxon tests, Bonferroni corrected p-value <0.01: ***).
Figure 2—figure supplement 2.
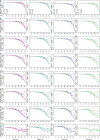
Figure 2—figure supplement 2.. Age-adjusted SFS of simulated mutations under negative selection in the four derived clades.
The four columns show the results for the A_East, A_Italia, B_West and B_East genetic clades, respectively. Each line shows the results for the different scaled selection coefficients (S). The five colored curves in each plot show the shape of the age-adjusted SFS with varying ratios of neutrally evolving mutations, and the gray curves show variation within one standard deviation based on the 20 runs for each simulation. The X axes show the age bin from the youngest to the oldest, with each age bin including the same number of observations for each simulation.
Figure 2—figure supplement 3.
Figure 2—figure supplement 3.. Age-adjusted SFS of retrotransposons in accessions with at least 20 x coverage.
The top row shows the age-adjusted SFS of retrotransposons in the four derived clades. The bottom row shows the age-adjusted SFS of retrotransposons based on their distance to the next gene in the four derived clades. The X axes show the age range of the mutations in each bin, and the age range of each bin was chosen so that each bin represents the same number of retrotransposon observations in the top row. The different columns show the four derived clades: (A): A_East (nretrotransposon = 1,688, nretrotransposon in genes and 1 kb surrounding = 564, nretrotransposon between 1 and 5 kb away from genes = 536, nretrotransposon more than 5 kb away from genes = 590); (B): A_Italia (nretrotransposon = 1,216, nretrotransposon in genes and 1 kb surrounding = 384, nretrotransposon between 1 and 5 kb away from genes = 381, nretrotransposon more than 5 kb away from genes = 451); (C): B_West (nretrotransposon = 1,911, nretrotransposon in genes and 1 kb surrounding = 746, nretrotransposon between 1 and 5 kb away from genes = 593, nretrotransposon more than 5 kb away from genes = 572); (D): B_East (nretrotransposon = 1,035, nretrotransposon in genes and 1 kb surrounding = 387, nretrotransposon between 1 and 5 kb away from genes = 311, nretrotransposon more than 5 kb away from genes = 337). Boxplots are based on 100 estimations of Δ frequency. Significant deviations of Δ frequency estimates from 0 in the age-adjusted SFS of retrotransposons are shown with asterisks (one-side Wilcoxon tests, Bonferroni corrected p-value <0.05: *;<0.01: ***).
Figure 2—figure supplement 4.
Figure 2—figure supplement 4.. Age-adjusted SFS of retrotransposons (colored) and SNPs (gray) more than 5 kb away from genes in the four derived clades.
The X axes show the age range of the mutations in each bin. (A): A_East (nretrotransposon = 709); (B): A_Italia (nretrotransposon = 454); (C): B_West (nretrotransposon = 622); (D): B_East (nretrotransposon = 337). Boxplots are based on 100 estimations of Δ frequency.
Figure 2—figure supplement 5.
Figure 2—figure supplement 5.. Age-adjusted SFS of Copia TEs in the four derived clades.
The X axes show the age range of the mutations in each bin. (A): A_East (n = 1,027); (B): A_Italia (n = 621); (C): B_West (n = 1,066); (D): B_East (n = 531). Boxplots are based on 100 estimations of Δ frequency.
Figure 2—figure supplement 6.
Figure 2—figure supplement 6.. Age-adjusted SFS of Ty3 TEs in the four derived clades.
The X axes show the age range of the mutations in each bin. (A): A_East (n = 786)s; (B): A_Italia (n = 457); (C): B_West (n = 727); (D): B_East (n = 373). Boxplots are based on 100 estimations of Δ frequency.
Figure 2—figure supplement 7.
Figure 2—figure supplement 7.. Age-adjusted SFS of Helitron TEs in the four derived clades.
The X axes show the age range of the mutations in each bin. (A): A_East (n = 8,895); (B): A_Italia (n = 4,291); (C): B_West (n = 8,324); (D): B_East (n = 5,736). Boxplots are based on 100 estimations of Δ frequency.
Figure 2—figure supplement 8.
Figure 2—figure supplement 8.. Age-adjusted SFS of MITE TEs in the four derived clades.
The X axes show the age range of the mutations in each bin. (A): A_East (n = 2,802); (B): A_Italia (n = 956); (C): B_West (n = 2,521); (D): B_East (n = 1,100). Boxplots are based on 100 estimations of Δ frequency.
Figure 3.
Figure 3.. Relative age difference ((mutation age in simulations - observed mutation age)/maximum absolute age difference) between simulated and observed data in the last bin of the age-adjusted SFS.
(A): 25% quantile; (B): 50% quantile; (C): 75% quantile. Relative age difference between simulated data assuming fully outcrossing individuals and observed data in the last bin of the age-adjusted SFS are shown in Figure 3—figure supplement 1.
Figure 3—figure supplement 1.
Figure 3—figure supplement 1.. Relative age difference ((mutation age in simulations - observed mutation age)/maximum absolute age difference) between simulated data assuming fully outcrossing individuals and observed data in the last bin of the age-adjusted SFS.
(A): 25% quantile; (B): 50% quantile; (C): 75% quantile.

Update of

  • doi: 10.1101/2023.09.15.557873
  • doi: 10.7554/eLife.93284.1
  • doi: 10.7554/eLife.93284.2

References

    1. Albers PK, McVean G. Dating genomic variants and shared ancestry in population-scale sequencing data. PLOS Biology. 2020;18:e3000586. doi: 10.1371/journal.pbio.3000586. - DOI - PMC - PubMed
    1. Baduel P, Leduque B, Ignace A, Gy I, Gil J, Loudet O, Colot V, Quadrana L. Genetic and environmental modulation of transposition shapes the evolutionary potential of Arabidopsis thaliana. Genome Biology. 2021;22:138. doi: 10.1186/s13059-021-02348-5. - DOI - PMC - PubMed
    1. Barrón MG, Fiston-Lavier AS, Petrov DA, González J. Population genomics of transposable elements in Drosophila. Annual Review of Genetics. 2014;48:561–581. doi: 10.1146/annurev-genet-120213-092359. - DOI - PubMed
    1. Belyayev A. Bursts of transposable elements as an evolutionary driving force. Journal of Evolutionary Biology. 2014;27:2573–2584. doi: 10.1111/jeb.12513. - DOI - PubMed
    1. Benjamini Y, Hochberg Y. Controlling the false discovery rate: a practical and powerful approach to multiple testing. Journal of the Royal Statistical Society. 1995;57:289–300. doi: 10.1111/j.2517-6161.1995.tb02031.x. - DOI

Substances