. 2024 Dec 2;196(4):2730-2748.
doi: 10.1093/plphys/kiae213.

The trichome pattern diversity of Cardamine shares genetic mechanisms with Arabidopsis but differs in environmental drivers

Affiliations

The trichome pattern diversity of Cardamine shares genetic mechanisms with Arabidopsis but differs in environmental drivers

Alberto Fuster-Pons et al. Plant Physiol. .

Erratum in

Abstract

Natural variation in trichome pattern (amount and distribution) is prominent among populations of many angiosperms. However, the degree of parallelism in the genetic mechanisms underlying this diversity and its environmental drivers in different species remain unclear. To address these questions, we analyzed the genomic and environmental bases of leaf trichome pattern diversity in Cardamine hirsuta, a relative of Arabidopsis (Arabidopsis thaliana). We characterized 123 wild accessions for their genomic diversity, leaf trichome patterns at different temperatures, and environmental adjustments. Nucleotide diversities and biogeographical distribution models identified two major genetic lineages with distinct demographic and adaptive histories. Additionally, C. hirsuta showed substantial variation in trichome pattern and plasticity to temperature. Trichome amount in C. hirsuta correlated positively with spring precipitation but negatively with temperature, which is opposite to climatic patterns in A. thaliana. Contrastingly, genetic analysis of C. hirsuta glabrous accessions indicated that, like for A. thaliana, glabrousness is caused by null mutations in ChGLABRA1 (ChGL1). Phenotypic genome-wide association studies (GWAS) further identified a ChGL1 haplogroup associated with low trichome density and ChGL1 expression. Therefore, a ChGL1 series of null and partial loss-of-function alleles accounts for the parallel evolution of leaf trichome pattern in C. hirsuta and A. thaliana. Finally, GWAS also detected other candidate genes (e.g. ChETC3, ChCLE17) that might affect trichome pattern. Accordingly, the evolution of this trait in C. hirsuta and A. thaliana shows partially conserved genetic mechanisms but is likely involved in adaptation to different environments.


Conflict of interest statement

Conflict of interest statement. The authors declare no competing interest.

Figures
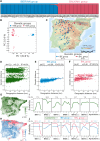
Figure 1.
Figure 1.
Genetic, geographic, and environmental structure of C. hirsuta populations. A) Genetic relationships among 123 accessions estimated for K = 2 ancestral genetic clusters with ADMIXTURE. Each individual is depicted as a vertical rectangle divided into segments representing the membership proportions estimated in the two ancestral clusters. Genotypes are arranged according to cluster membership proportions. B) Scatter plot displaying the PC analysis of the 123 genotypes. C) Geographic distribution of the IBE and BAL genetic groups detected by NJ, ADMIXTURE, and PC analyses. D to F) IBD for all 123 accessions (D), and for the IBE (E) and BAL (F) genetic groups. ADMIXTURE, PC, and IBD analyses were carried out using 343,364 nonsingleton SNPs with no missing data segregating in the accessions. G, H) Continuous potential distribution models of C. hirsuta quantifying habitat predicted suitability (adequacy of the species, or the genetic groups, to the environment where it occurs), in the Iberian Peninsula at the species level (G) and for the two genetic groups (H). C. hirsuta locations used to generate the distribution models are shown in the maps, whereas the number of samples are indicated in the corresponding suitability legends. I, J) Suitability response curves of the seven environmental variables used in C. hirsuta distribution models at the species level (I) and for the two genetic groups (J). The contribution of each environmental variable to the distribution models (CM%), measured as percentage drop in model fit when the variable is permuted, is shown on top of each panel. In all panels, IBE and BAL groups are blue and magenta colored, respectively, whereas the complete species is colored in green. BIO1: annual mean temperature; BIO2: mean temperature diurnal range; BIO4: temperature seasonality; BIO8: mean temperature of wettest quarter; BIO12: annual precipitation; BIO15: precipitation seasonality; %Agriculture: proportion of agriculture land per km2.
Figure 2.
Figure 2.
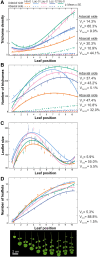
Natural variation for leaf trichome pattern across ontogeny. A to D) Leaf trichome density (A), leaf trichome number (B), terminal leaflet size (C), and leaflet number (D) in the first 10 rosette leaves of five C. hirsuta accessions. Each panel shows the mean ± standard error of each trait measured on each accession and fitted curves across the 10 leaves. Each accession is depicted with a different color according to legend, whereas continuous and dashed lines correspond to trichome traits for the adaxial and abaxial leaf surfaces, respectively. Phenotypic variances explained by the genotype (VG), the ontogeny (leaf position; VOnt) and the interaction between both factors (VGxOnt) are shown next to each panel. Representative leaves from the Slc-0 accession are shown below panel D, where images were digitally extracted for comparison.
Figure 3.
Figure 3.
Natural variation and environmental associations for leaf trichome traits. A) Terminal leaflets of wild accessions with different trichome patterns arranged from glabrous to high trichome density. Close ups of insets are shown in lower panels. Leaf images were digitally extracted for comparison. B to D) Reaction norms of TN (B), TD (C), and LS (D) measured at 21 and 26 °C. As described in the legends, accessions are classified according to their similar or different phenotypes in both temperatures. Boxes in the lower part of each panel display the variance explained by the genotypes (VG), the environments (VE) or the interaction between both factors (VGxE). E) Violin graphs showing the variation for the plasticity of TN, TD, and LS to ambient temperature. F) Relationship between trichome traits and monthly precipitation (upper panel) or solar radiation (lower panel) along the year. Months in the abscissa are indicated with the first letter of the month. Filled and white circles depict significant (P < 0.05) and nonsignificant (P > 0.05) regressions, respectively. G, H) GWR analyses between May precipitation and trichome number at 21 °C (TN21) (G) or between mean temperature of wettest quarter (BIO8) and trichome density at 21 °C (TD21) (H). Panels show climatic maps including the GWR standard coefficients estimated at each location and depicted with different colors according to the legends. In the upper box of (G) and (H) panels, mean values ± standard deviation of trichome and climate variables are shown for locations with significant or nonsignificant GWR coefficients (indicated as P < 0.05 and P > 0.05, respectively). Differences between both types of locations for these variables were statistically tested by general linear models; the same or different letters indicate nonsignificant or significant differences (P < 0.05).
Figure 4.
Figure 4.
Phenotypic and environmental genome-wide association analyses. A to C) Manhattan plots for leaf TN (A) and TD (B) measured at 21 °C, as well as for May precipitation (C), across the eight C. hirsuta chromosomes. Horizontal black dotted and dashed lines indicate significance thresholds of −log(P) = 4 and FDR = 0.1 after Benjamini–Hochberg correction for multiple tests, respectively. Orange and bluish green colored dots match SNPs with −log(P) > 4 that are located on C. hirsuta orthologues or homologues, respectively, of A. thaliana genes known to affect trichome development; the names of these genes are included in each panel. Blue colored dots depict SNPs with −log(P) > 4 that are located on C. hirsuta genes associated with both, trichome traits and May precipitation; the names of the two top genes associated with trichome traits are included. Yellow color strips depict significant genomic regions associated with trichome and precipitation variables.
Figure 5.
Figure 5.
Functional analyses of ChGL1. A)ChGL1 loss-of-function mutations causing C. hirsuta glabrousness in the Iberian Peninsula. B) Zoom of Manhattan plot around ChGL1 and effects of the most significantly associated SNP on trichome number (TN21) and density (TD21) measured at 21 °C. Red colored dots in Manhattan plot match SNPs showing associations above the −log(P) > 4 threshold depicted as dotted line. C) Topology of NJ tree displaying ChGL1 genetic relationships among accessions. Branches corresponding to partitions reproduced in <50% bootstrap replicates are collapsed, whereas branches corresponding to IBE or BAL groups are colored in blue and magenta, respectively. Glabrous accessions or those selected for gene expression analysis are indicated in NJ tree. D) Geographic distribution of Iberian accessions belonging to the ChGL1 haplogroup detected by GWAS (named as GWAS haplogroup), or carrying glabrous alleles. The number of accessions in each class is indicated in the legend. E)ChGL1 expression analysis in 12 accessions differing in ChGL1 SNPs (Hap A and G) differentiating GWAS haplogroup. Bars show the mean ± Se of three biological replicates per accession. Relative gene expression differences among genotypes were statistically tested by mixed linear models, the same or different letters indicating nonsignificant or significant differences in Tukey's test (P < 0.05). F) Linear regression between TD21 and ChGL1 relative expression.

Similar articles

Cited by

References

    1. 1001 Genomes Consortium . 1,135 genomes reveal the global pattern of polymorphism in Arabidopsis thaliana. Cell. 2016:166(2):481–491. 10.1016/j.cell.2016.05.063 - DOI - PMC - PubMed
    1. Alexander DH, Novembre J, Lange K. Fast model-based estimation of ancestry in unrelated individuals. Genome Res. 2009:19(9):1655–1664. 10.1101/gr.094052.109 - DOI - PMC - PubMed
    1. Alonso-Blanco C, Méndez-Vigo B. Genetic architecture of naturally occurring quantitative traits in plants: an updated synthesis. Curr Opin Plant Biol. 2014:18:37–43. 10.1016/j.pbi.2014.01.002 - DOI - PubMed
    1. Arteaga N, Méndez-Vigo B, Fuster-Pons A, Savic M, Murillo-Sánchez A, Picó FX, Alonso-Blanco C. Differential environmental and genomic architectures shape the natural diversity for trichome patterning and morphology in different Arabidopsis organs. Plant Cell Environ. 2022:45(10):3018–3035. 10.1111/pce.14308 - DOI - PMC - PubMed
    1. Arteaga N, Savic M, Méndez-Vigo B, Fuster-Pons A, Torres-Pérez R, Oliveros JC, Picó FX, Alonso-Blanco C. MYB transcription factors drive evolutionary innovations in Arabidopsis fruit trichome patterning. Plant Cell. 2021:33(3):548–565. 10.1093/plcell/koaa041 - DOI - PMC - PubMed

LinkOut - more resources