. 2024 Mar 22;13(7):563.
doi: 10.3390/cells13070563.

A Single-Cell Landscape of Spermioteleosis in Mice and Pigs

Affiliations

A Single-Cell Landscape of Spermioteleosis in Mice and Pigs

Meng-Meng Liu et al. Cells. .

Abstract

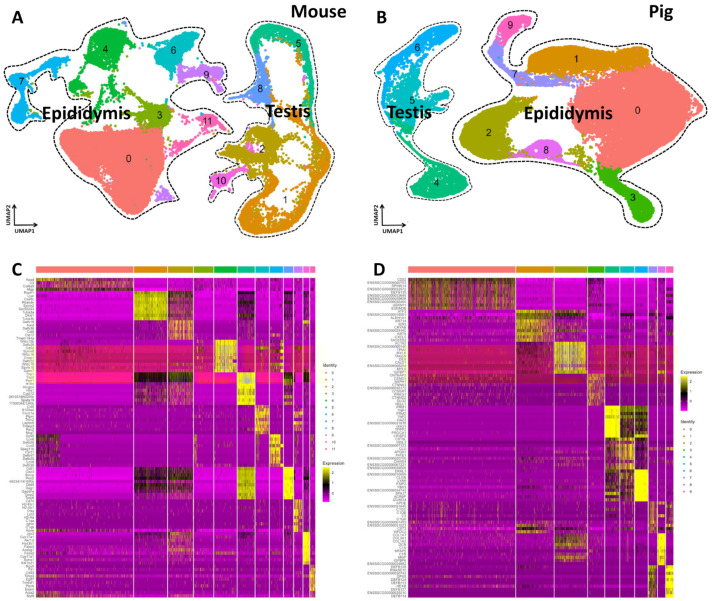
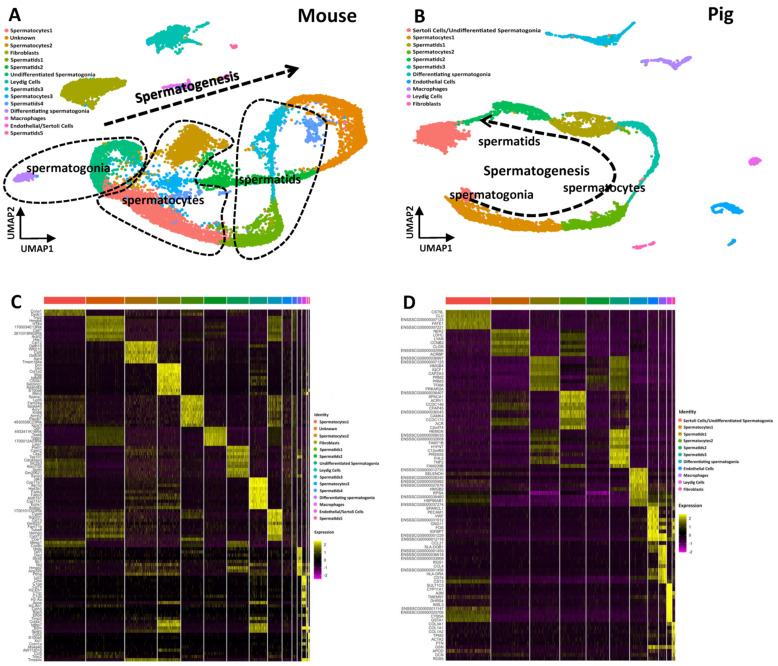
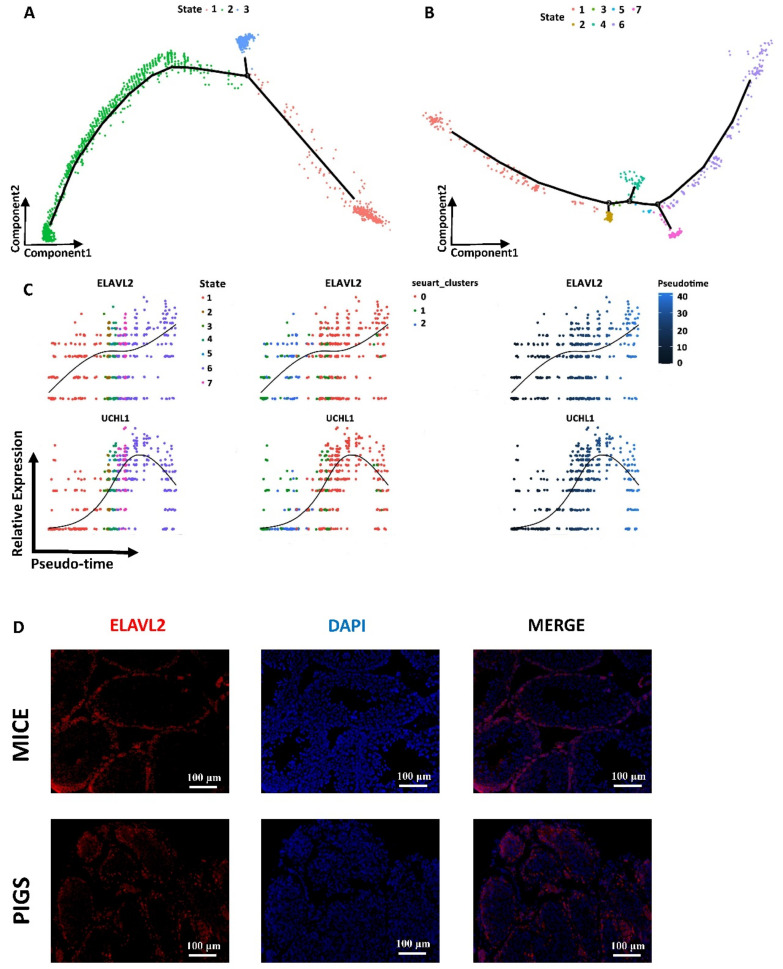
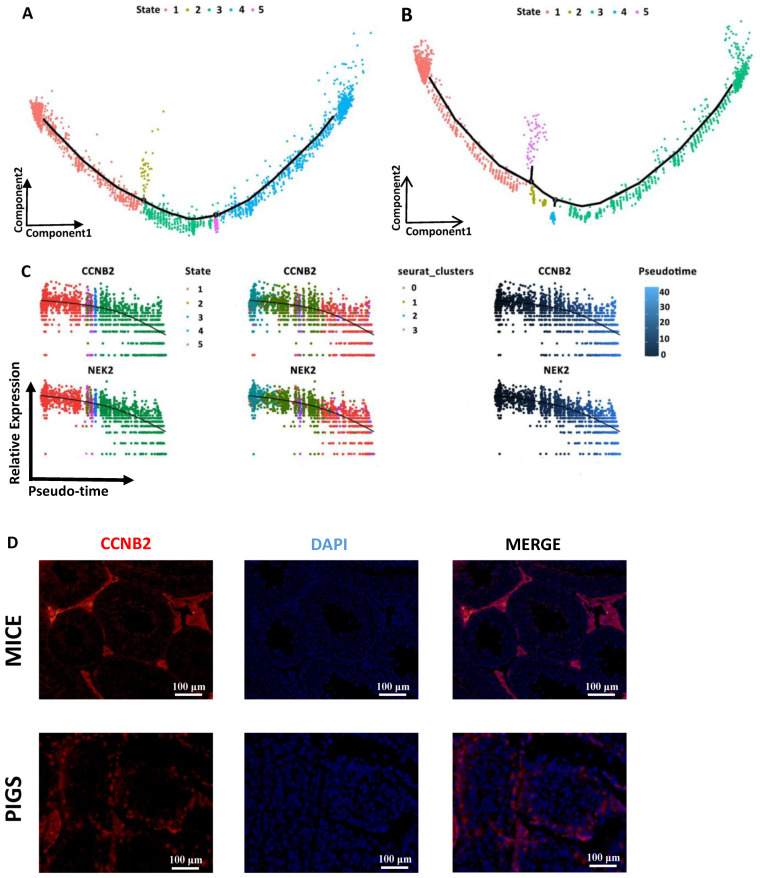
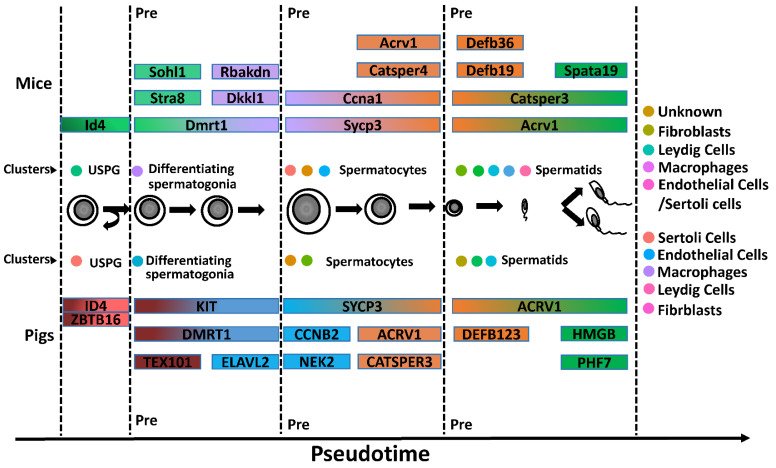
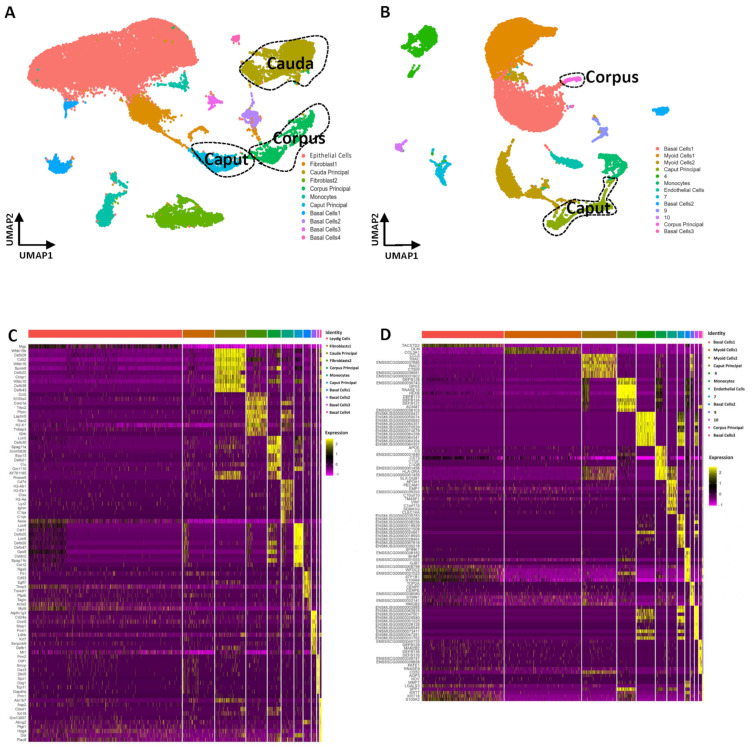
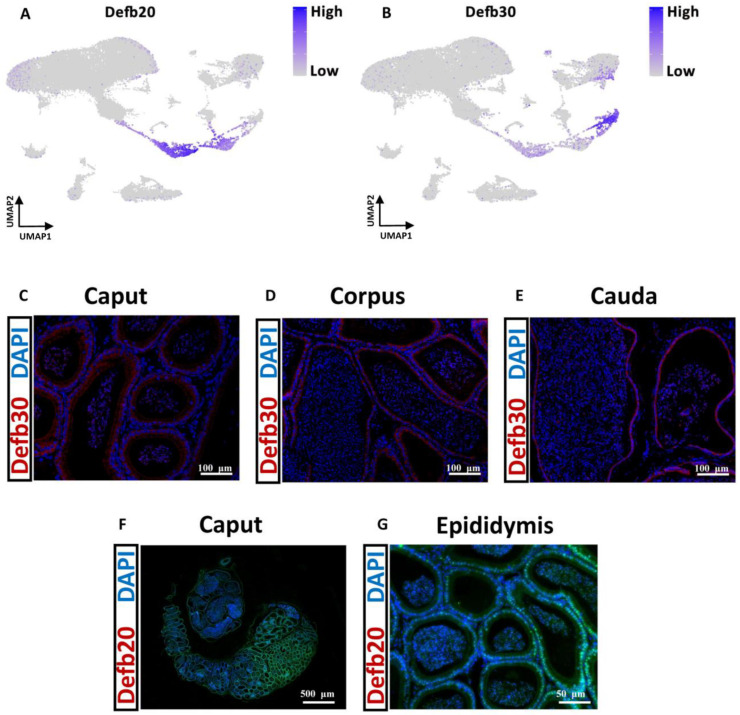
(1) Background: Spermatozoa acquired motility and matured in epididymis after production in the testis. However, there is still limited understanding of the specific characteristics of sperm development across different species. In this study, we employed a comprehensive approach to analyze cell compositions in both testicular and epididymal tissues, providing valuable insights into the changes occurring during meiosis and spermiogenesis in mouse and pig models. Additionally, we identified distinct gene expression signatures associated with various spermatogenic cell types. (2) Methods: To investigate the differences in spermatogenesis between mice and pigs, we constructed a single-cell RNA dataset. (3) Results: Our findings revealed notable differences in testicular cell clusters between these two species. Furthermore, distinct gene expression patterns were observed among epithelial cells from different regions of the epididymis. Interestingly, regional gene expression patterns were also identified within principal cell clusters of the mouse epididymis. Moreover, through analysing differentially expressed genes related to the epididymis in both mouse and pig models, we successfully identified potential marker genes associated with sperm development and maturation for each species studied. (4) Conclusions: This research presented a comprehensive single-cell landscape analysis of both testicular and epididymal tissues, shedding light on the intricate processes involved in spermatogenesis and sperm maturation, specifically within mouse and pig models.

Keywords: mouse; pig; single-cell transcriptome; spermatogenesis.


Conflict of interest statement

The authors declare no conflicts of interest.

Figures

Figure 1
Figure 1
Single-Cell RNA Profiling of the Testis and Epididymis Between Adult Mice and Pigs Reveals the Extent of Gene Expression Heterogeneity. (A) Dimension reduction analysis (via UMAP) of combined single-cell transcriptome data showing single-cell RNA profiling of mice epididymis and testes. Each dot represents a single cell and is colored according to its cell type identity. (B) Dimension reduction representation (via UMAP) of combined single-cell transcriptome data showing single-cell RNA profiling of pigs’ epididymis testes. Each dot represents a single cell and is colored according to its cell type identity. (C) Heatmaps showing the top 10 significantly differentially expressed genes (DEGs) between each cell cluster in mice testes and epididymis samples. (D) Heatmaps showing the top 10 significantly differentially expressed genes (DEGs) between each cell cluster in pigs’ testes and epididymis samples.
Figure 2
Figure 2
Single-Cell Transcriptomes of Mice and Pigs Testicular Cells. (A) Dimension reduction representation (via UMAP) of the mice testes single-cell transcriptome. Each dot represents a single cell and is colored according to its cell type identity. The right clusters is spermatogonia, the middle clusters is spermatogonia, and the left contains spermatids clusters. Along the direction of the arrow, is the sequence of spermatogenesis (B) Dimension reduction representation (via UMAP) of the pigs’ testes single-cell transcriptome. Each dot represents a single cell and is colored according to its cell type identity. The arrow starts with the spermatogonia cluster and the spermatocyte clusters in the middle, and the spermatids clusters at the end. Along the direction of the arrow, is the sequence of spermatogenesis (C) Heatmaps show the top 10 differentially expressed genes (DEGs) between each cell cluster in mice testes. (D) Heatmaps show the top 10 differentially expressed genes (DEGs) between each cell cluster in pigs’ testes.
Figure 3
Figure 3
Single-Cell Spermatogonial Trajectories Reveal Heterogeneity Between Mice and Pigs. (A) Pseudotime trajectories of mice spermatogonia in which cells are colored by state. Branch points in the single-cell trajectories are noted by black numbered circles. The spermatogonia clusters in this trajectory analysis included undifferentiated spermatogonia and differentiating spermatogonia clusters. There are 3 states in mouse spermatogonia pseudotime trajectories. (B) Pseudotime trajectories of pigs’ spermatogonia in which cells are colored by state. Branch points in the single-cell trajectories are noted by black numbered circles. The spermatogonia clusters included in this trajectory analysis included differentiating spermatogonia cluster. There are 7 states in pigs spermatogonia pseudotime trajectories. (C) Expression patterns of key DEGs over pseudotime among pigs’ spermatogonia in state, cluster, and pseudotime. Cells are colored according to the state, clusters, and pseudotime and ordered according to the pseudotime. The left is DEGs in different states’ dynamic changes along pigs spermatogonia pseudotime trajectories. The middle is DEGs in different seurat-clusters’ dynamic changes along pigs spermatogonia pseudotime trajectories. The right is DEGs’ dynamic changes along pigs spermatogonia pseudotime trajectories. (D) Red indicates immunostaining for ELAVL2 and blue indicates staining for DAPI in mice and pigs’ testes (the bar represents 100 μm). Scale bars are indicated. DNA was counterstained with DAPI. A minimum of three animal samples were used for each genotype and each experiment was repeated three times with similar results.
Figure 4
Figure 4
Dynamic Transcriptomic Heterogeneity in Mice and Pigs Spermatocytes. (A) Pseudotime trajectories of mice spermatocyte in which cells are colored by state. Branch points in the single-cell trajectories are noted by black numbered circles. Spermatocyte clusters included in this trajectory analysis included the spermatocytes1 cluster. There are 5 states in mice spermatocytes pseudotime trajectories. (B) Pseudotime trajectories of pigs’ spermatocytes in which cells are colored by state. Branch points in the single-cell trajectories are noted by black numbered circles. The spermatocyte clusters included in this trajectory analysis included spermatocytes1 and spermatocytes2 clusters. There are 5 states in pigs’ spermatocytes pseudotime trajectories. (C) Expression patterns of key DEGs over pseudotime among pigs’ spermatocytes in state, cluster, and pseudotime. Cells are colored according to the state, clusters, and pseudotime and ordered according to the pseudotime. The left is DEGs in different states’ dynamic changes along pigs’ spermatocytes pseudotime trajectories. The middle is DEGs in different seurat-clusters’ dynamic changes along pigs’ spermatocytes pseudotime trajectories. The right is DEGs’ dynamic changes along pigs’ spermatocytes pseudotime trajectories. (D) Red immunostaining for CCNB2 and blue DAPI staining of mice and pigs’ testes (the bar represents 100 μm). Scale bars are indicated. DNA was counterstained with DAPI. A minimum of three animal samples were used for each genotype and each experiment was repeated three times with similar results.
Figure 5
Figure 5
Comparison of Dynamic Transcriptomes of the Testis between Mice and Pigs. Identification of cell clusters expressing the noted marker genes allowed clusters to be aligned with specific spermatogenic cell types. From spermatogonia to spermatocytes and finally to spermatids in mice and pigs, respectively, each dot represents the corresponding cell cluster, showing the differentially expressed and highly expressed marker genes at each stage (USPG: undifferentiated spermatogonia).
Figure 6
Figure 6
Single-Cell Transcriptomes of the Epididymis of Mice and Pigs. (A) Dimension reduction map (via UMAP) of the mice epididymis single-cell transcriptome showing the regional expression of specific principal cells. Each dot represents a single cell and is colored according to its cell type identity. (B) Dimension reduction presentation (via UMAP) of the pigs’ epididymis single-cell transcriptome. Each dot represents a single cell and is colored according to its cell type identity. (C) Heatmaps showing the top 10 differentially expressed genes (DEGs) between each cell cluster in the mice epididymis. (D) Heatmaps showing the top 10 differentially expressed genes (DEGs) between each cell cluster in the pigs’ epididymis.
Figure 7
Figure 7
Localization of Dfb20 and Defb30 in the Mouse Epididymis. (A) Expression patterns of Defb20 projected on the UMAP plot in mouse epididymis. The darker the blue color is, the greater the expression level. (B) Expression patterns of Defb30 projected on the UMAP plot in mouse epididymis. The darker the blue color is, the greater the expression level. (C) Defb30 in situ hybridization of the mouse caput epididymis (the bar represents 100 μm). (D) Defb30 in situ hybridization of the mouse corpus epididymis (the bar represents 100 μm). (E) Defb30 in situ hybridization of the mouse cauda epididymis (the bar represents 100 μm). (F) Defb20 in situ hybridization of the mouse caput epididymis (the bar represents 500 μm). (G) Defb20 in situ hybridization of the mouse epididymis (the bar represents 50 μm). Scale bars are indicated. A minimum of three animal samples were used for each genotype and each experiment was repeated three times with similar results.

Similar articles

References

    1. Lukassen S., Bosch E., Ekici A.B., Winterpacht A. Single-cell RNA sequencing of adult mouse testes. Sci. Data. 2018;5:180192. doi: 10.1038/sdata.2018.192. - DOI - PMC - PubMed
    1. Sullivan R., Légaré C., Lamontagne-Proulx J., Breton S., Soulet D. Revisiting structure/functions of the human epididymis. Andrology. 2019;7:748–757. doi: 10.1111/andr.12633. - DOI - PubMed
    1. Cooper T.G., Yeung C.H., Fetic S., Sobhani A., Nieschlag E. Cytoplasmic droplets are normal structures of human sperm but are not well preserved by routine procedures for assessing sperm morphology. Hum. Reprod. 2004;19:2283–2288. doi: 10.1093/humrep/deh410. - DOI - PubMed
    1. Axnér E., Linde-Forsberg C., Einarsson S. Morphology and motility of spermatozoa from different regions of the epididymal duct in the domestic cat. Theriogenology. 1999;52:767–778. doi: 10.1016/S0093-691X(99)00170-3. - DOI - PubMed
    1. Shi J., Fok K.L., Dai P., Qiao F., Zhang M., Liu H., Sang M., Ye M., Liu Y., Zhou Y., et al. Spatio-temporal landscape of mouse epididymal cells and specific mitochondria-rich segments defined by large-scale single-cell RNA-seq. Cell Discov. 2021;7:34. doi: 10.1038/s41421-021-00260-7. - DOI - PMC - PubMed

Publication types

LinkOut - more resources