. 2024 Mar 28;13(7):591.
doi: 10.3390/cells13070591.

Cockayne Syndrome Patient iPSC-Derived Brain Organoids and Neurospheres Show Early Transcriptional Dysregulation of Biological Processes Associated with Brain Development and Metabolism

Affiliations

Cockayne Syndrome Patient iPSC-Derived Brain Organoids and Neurospheres Show Early Transcriptional Dysregulation of Biological Processes Associated with Brain Development and Metabolism

Leon-Phillip Szepanowski et al. Cells. .

Abstract

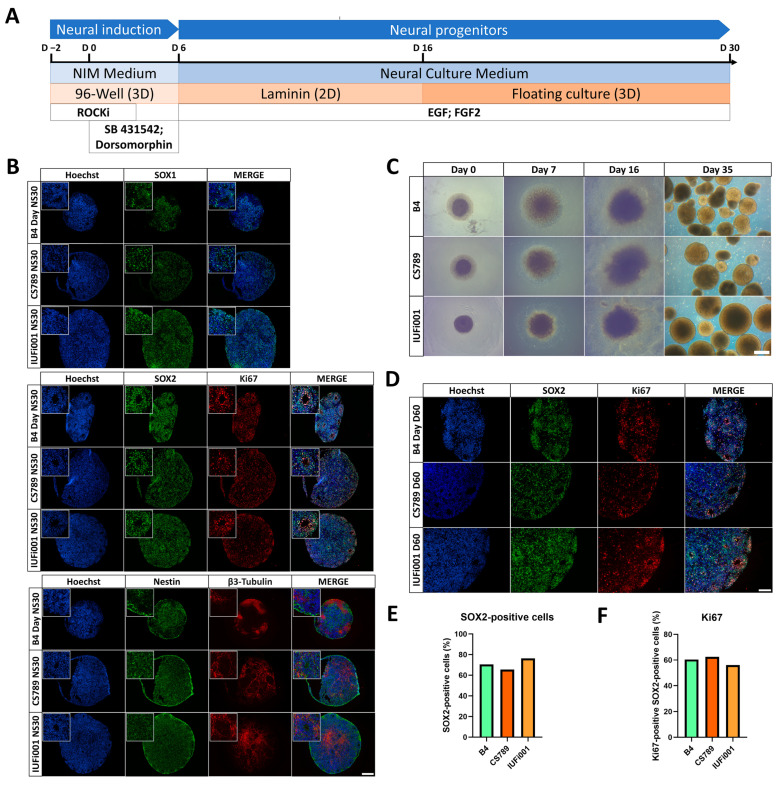
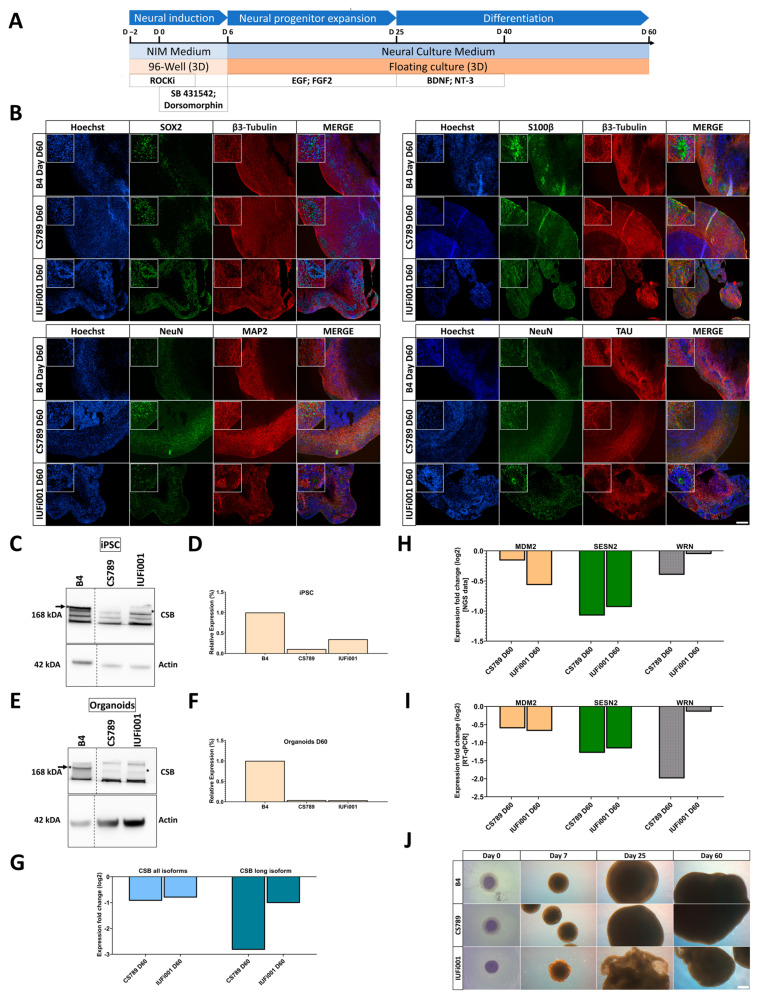
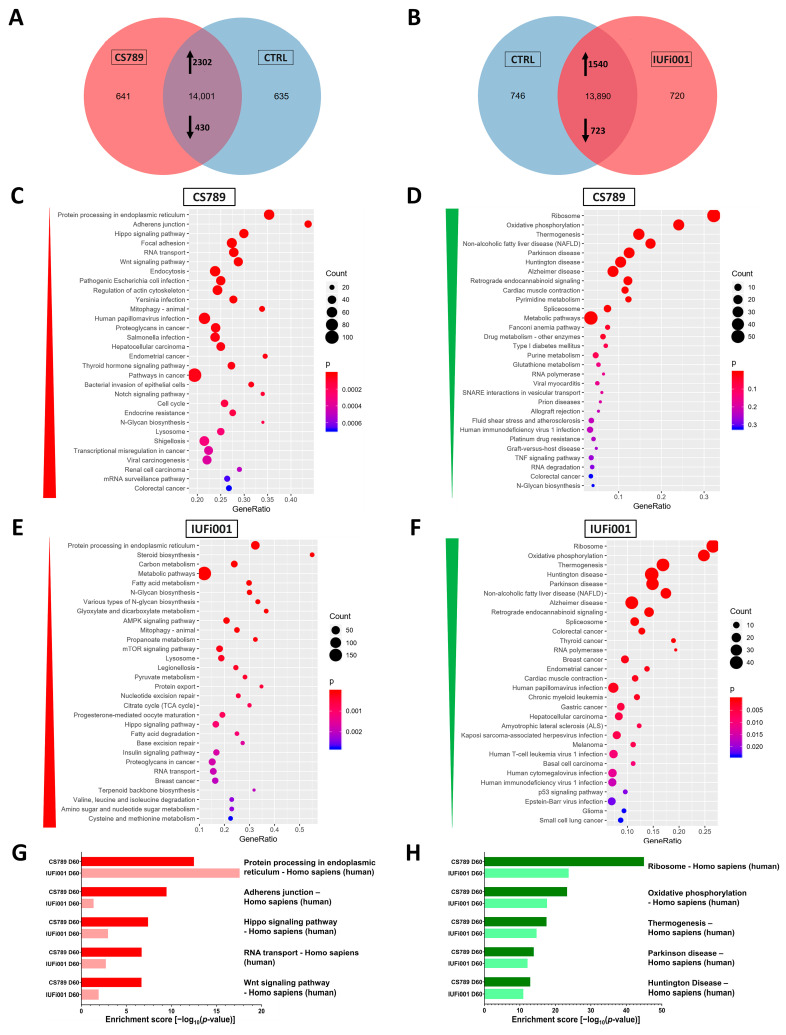
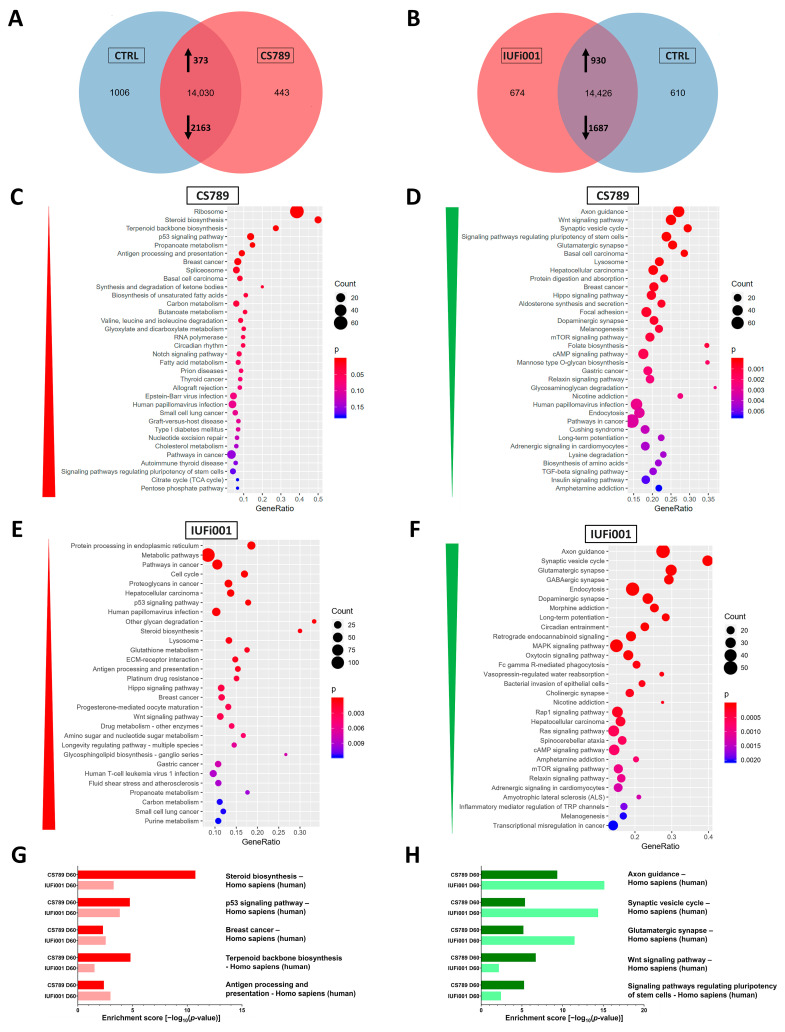
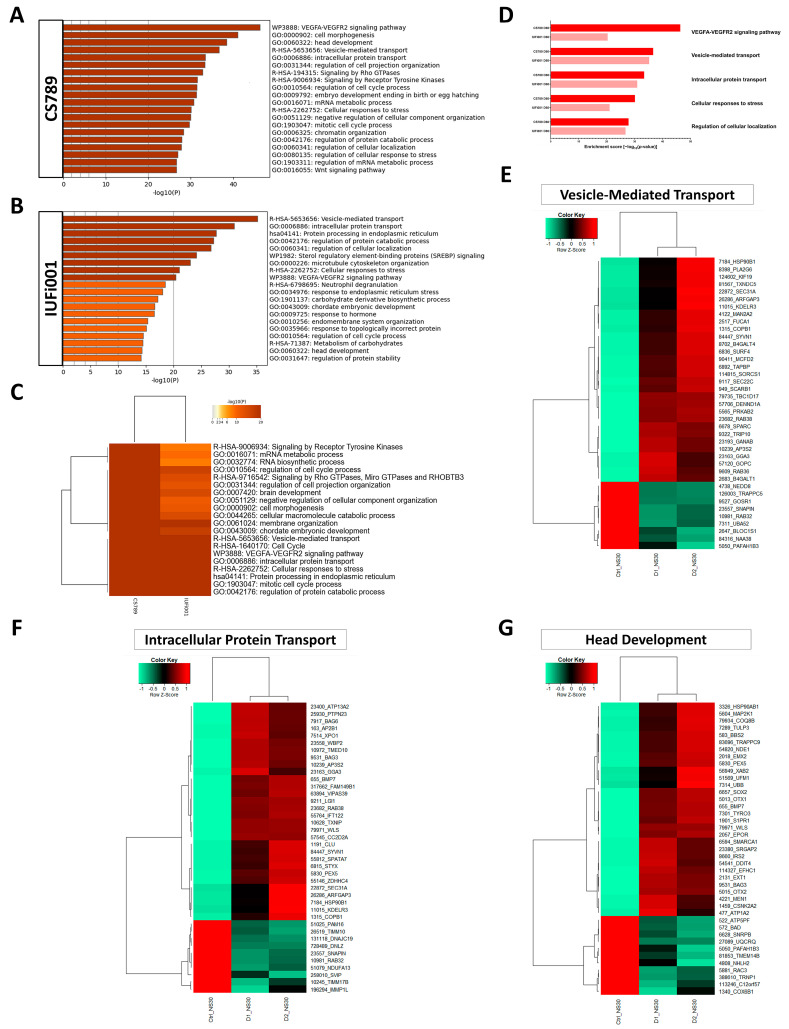
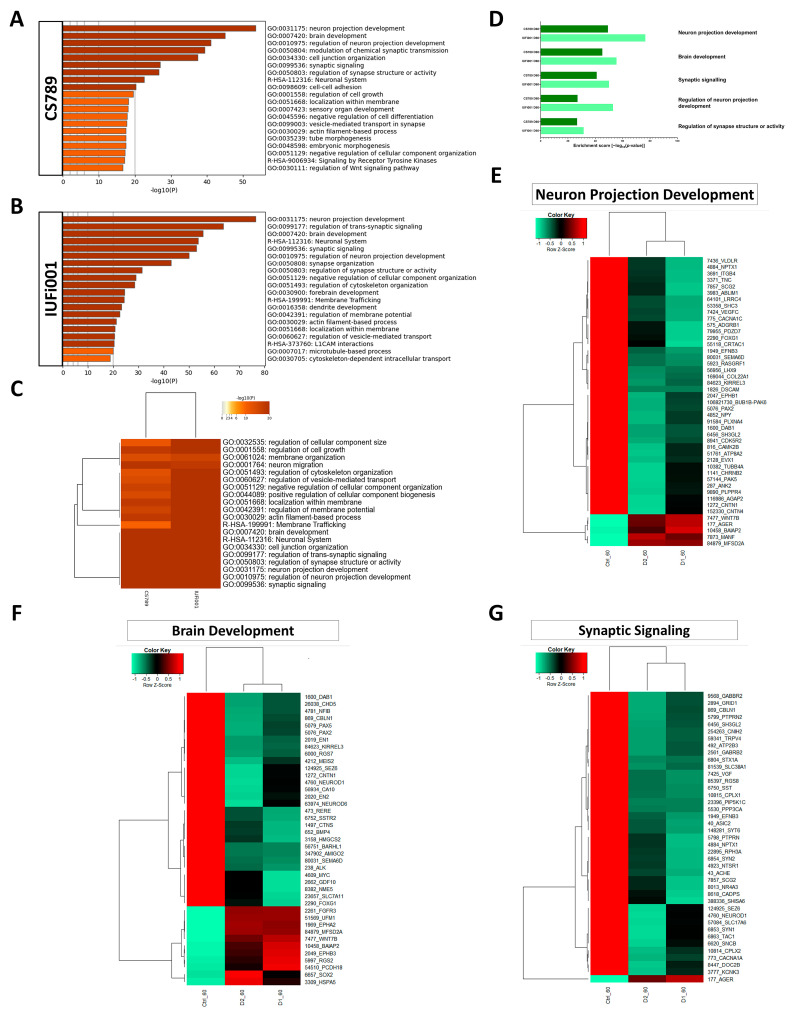
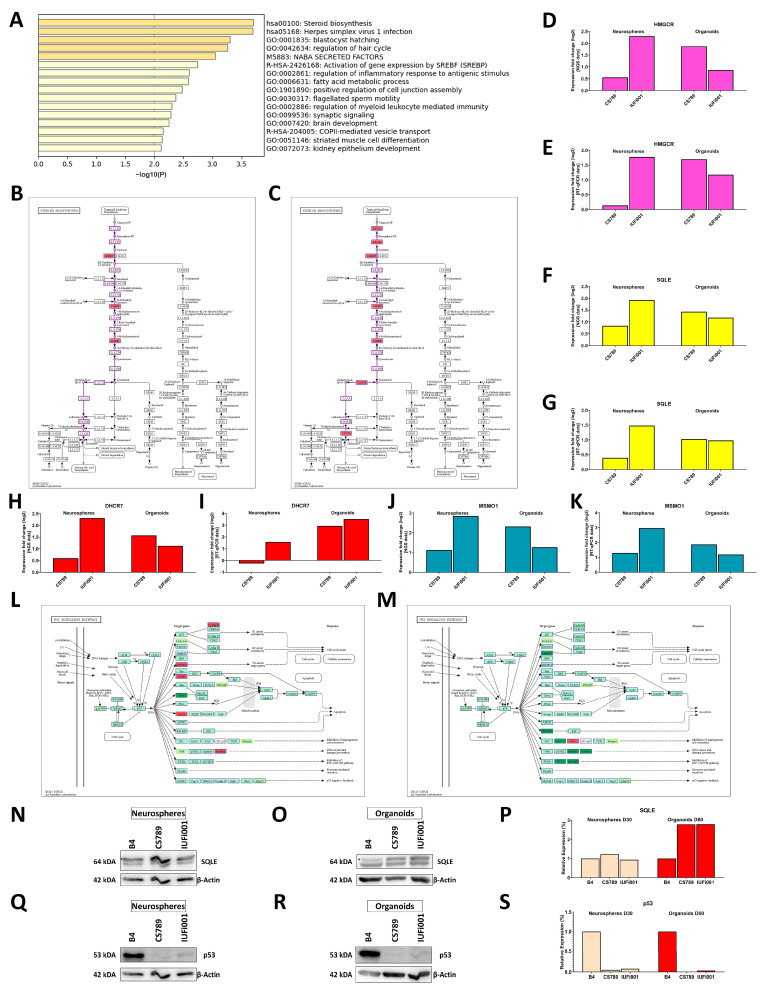
Cockayne syndrome (CS) is a rare hereditary autosomal recessive disorder primarily caused by mutations in Cockayne syndrome protein A (CSA) or B (CSB). While many of the functions of CSB have been at least partially elucidated, little is known about the actual developmental dysregulation in this devasting disorder. Of particular interest is the regulation of cerebral development as the most debilitating symptoms are of neurological nature. We generated neurospheres and cerebral organoids utilizing Cockayne syndrome B protein (CSB)-deficient induced pluripotent stem cells derived from two patients with distinct severity levels of CS and healthy controls. The transcriptome of both developmental timepoints was explored using RNA-Seq and bioinformatic analysis to identify dysregulated biological processes common to both patients with CS in comparison to the control. CSB-deficient neurospheres displayed upregulation of the VEGFA-VEGFR2 signalling pathway, vesicle-mediated transport and head development. CSB-deficient cerebral organoids exhibited downregulation of brain development, neuron projection development and synaptic signalling. We further identified the upregulation of steroid biosynthesis as common to both timepoints, in particular the upregulation of the cholesterol biosynthesis branch. Our results provide insights into the neurodevelopmental dysregulation in patients with CS and strengthen the theory that CS is not only a neurodegenerative but also a neurodevelopmental disorder.

Keywords: Cockayne syndrome; RNA-Seq; brain development; brain organoids; steroid biosynthesis.


Conflict of interest statement

The authors declare no conflicts of interest. The funders had no role in the design of the study; in the collection, analyses or interpretation of data; in the writing of the manuscript; or in the decision to publish the results.

Figures

Figure 1
Figure 1
Generation and characterization of CS neurospheres. (A) Schematic outline of the protocol to generate iPSC-derived neurospheres. (B) Representative immunocytochemistry images of the distribution of cells expressing SOX1, SOX2, Ki67, Nestin and ⁠β3-Tubulin. 100× magnification, scale bar 200 µm. (C) Representative brightfield images of control and CS neurospheres at day 0, 7, 16 and 35 of differentiation. Scale bar, 200 µm. (D) Representative immunocytochemistry images of the distribution of cells expressing SOX2 and Ki67. 200× magnification, scale bar 100 µm. (E) Quantification of the SOX2-positive and Hoechst-positive cells in CTRL (B4), CS789 and IUFi001 neurospheres. (F) Quantification of the Ki67-positive cells within the SOX2-positive cells in CTRL (B4), CS789 and IUFi001 neurospheres. (E,F) Approximately ten random fields from three distinct neurospheres were analysed.
Figure 2
Figure 2
Generation and characterization of CS organoids. (A) Schematic outline of the protocol to generate iPSC-derived cerebral organoids. (B) Representative immunocytochemistry images of the distribution of cells expressing SOX2, ⁠β3-Tubulin, S100, NeuN, MAP2 and TAU. 100× magnification, scale bar 200 µm. (C) Western blot analysis for full-length CSB and beta-actin at the iPSC stage. (D) Quantification of CSB Western blot analysis at the iPSC stage in CTRL (B4), CS789 and IUFi001. CSB expression of CS789 and IUFi001 is compared to CSB expression in CTRL (B4) (E). Western blot analysis for full-length CSB and beta-actin at day 60 of organoid differentiation. (F) Quantification of CSB Western blot analysis at iPSC stage in CTRL (B), CS789 and IUFi001. CSB expression of CS789 and IUFi001 is compared to CSB expression in CTRL (B4). (G) qRT-PCR analysis of full-length CSB mRNA expression and all isoform CSB mRNA expression in CS789 and IUFi001 organoids relative to control organoids. (H) Relative mRNA expression analysis of DNA damage-related genes MDM2, SESN2 and WRN in CS789 and IUFi001 organoids compared to CTRL (B4). (I) qRT-PCR analysis of MDM2, SESN2 and WRN mRNA expression in CS789 and IUFi001 organoids relative to CTRL (B4). (J) Representative brightfield images of control and CS organoids at day 0, 7, 25 and 53 of differentiation. Scale bar 200 µm. (C,E) Arrows indicate bands of interest. Asterisk (*) indicates height of bands of interest on the right side. Dotted lines indicate excision point of one sample. Full-length blots are presented in Supplementary Figure S3.
Figure 3
Figure 3
Global transcriptome and associated pathway analysis of control and CS neurospheres at day 30. (A) Venn diagram showing genes expressed only in CS789 neurospheres (641), in CTRL (B4) neurospheres (635) and common to both (14,001) (detection p value < 0.05). (B) Venn diagram showing genes expressed only in IUFi001 neurospheres (720), in CTRL (B4) neurospheres (746) and common to both (13,890) (detection p value < 0.05). (C,D) Dot plots showing the top 30 differentially regulated KEGG pathways (C) in the 2302 significantly upregulated DEGs in day 30 CS789 neurospheres in comparison to CTRL (B4) (D) and in the 430 significantly downregulated DEGs in day 30 CS789 neurospheres in comparison to CTRL (B4). (E,F) Dot plots showing the top 30 differentially regulated KEGG pathways (E) in the 1540 significantly upregulated DEGs in day 30 IUFi001 neurospheres in comparison to CTRL (B4) (F) and in the 723 significantly downregulated DEGs in day 30 IUFi001 neurospheres in comparison to CTRL (B4). (G) Bar chart of the differentially upregulated KEGG pathways (top five ranked) common between day 30 CS789 and IUFi001 neurospheres in comparison to CTRL (B4) neurospheres. (H) Bar chart of the differentially downregulated KEGG pathways (top five ranked) common between day 30 CS789 and IUFi001 neurospheres in comparison to CTRL (B4) neurospheres.
Figure 4
Figure 4
Global transcriptome and associated pathway analysis of control and CS organoids at day 60. (A) Venn diagram showing genes expressed only in CS789 organoids (443), in CTRL (B4) organoids (1006) and common to both (14,030) (detection p value < 0.05). (B) Venn diagram showing genes expressed only in IUFi001 organoids (674), in CTRL (B4) organoids (610) and common to both (14,426) (detection p value < 0.05). (C,D) Dot plots showing the top 30 differentially regulated KEGG pathways (C) in the 373 significantly upregulated DEGs in day 60 CS789 organoids in comparison to CTRL (B4) (D) and in the 2163 significantly downregulated DEGs in day 60 CS789 organoids in comparison to CTRL (B4). (E,F) Dot plots showing the top 30 differentially regulated KEGG pathways (E) in the 930 significantly upregulated DEGs in day 60 IUFi001 organoids in comparison to CTRL (B4) (F) and in the 1687 significantly downregulated DEGs in day 60 IUFi001 organoids in comparison to CTRL (B4). (G) Bar chart of the differentially upregulated KEGG pathways (top five ranked) common between day 60 CS789 and IUFi001 organoids in comparison to CTRL (B4) organoids. (H) Bar chart of the differentially downregulated KEGG pathways (top five ranked) common between day 60 CS789 and IUFi001 organoids in comparison to CTRL (B4) organoids.
Figure 5
Figure 5
Comparative transcriptome and gene ontology analysis of upregulated DEGs in day 30 neurospheres. (A) Bar graph of the top 20 non-redundant enrichment clusters attributable to the 2302 DEGs upregulated in day 30 CS789 neurospheres in comparison to CTRL (B4). (B) Bar graph of the top 20 non-redundant enrichment clusters attributable to the 1540 DEGs upregulated in day 30 IUFi001 neurospheres. (C) Metascape-generated heatmap comparing upregulated gene sets employed in A and B revealed i.a. GOs involved in brain development, intracellular transport and cell cycle. (D) Bar chart of the differentially upregulated enrichment clusters (top five ranked) common between day 30 CS789 and IUFi001 neurospheres in comparison to CTRL (B4) neurospheres. (E) Pearson’s heatmap depicting the 40 most dysregulated genes involved in vesicle-mediated transport common between day 30 CS789 and IUFi001 neurospheres in comparison to CTRL (B4). (F) Pearson’s heatmap depicting the 40 most dysregulated genes involved in intracellular protein transport common between day 30 CS789 and IUFi001 neurospheres in comparison to CTRL (B4). (G) Pearson’s heatmap depicting the 40 most dysregulated genes involved in head development common between day 30 CS789 and IUFi001 neurospheres in comparison to CTRL (B4).
Figure 6
Figure 6
Comparative transcriptome and gene ontology analysis of downregulated DEGs in day 60 organoids. (A) Bar graph of the top 20 non-redundant enrichment clusters attributable to the 2163 DEGs downregulated in day 60 CS789 (D1) organoids in comparison to CTRL (B4). (B) Bar graph of the top 20 non-redundant enrichment clusters attributable to the 1687 DEGs downregulated in day 60 IUFi001 organoids. (C) Metascape-generated heatmap comparing downregulated gene sets employed in A and B revealed i.a. GOs involved in brain development, cell junction organization, neuron projection development and synaptic signalling. (D) Bar chart of the differentially downregulated enrichment clusters (top five ranked) common between day 30 CS789 and IUFi001 neurospheres in comparison to CTRL (B4) neurospheres. (E) Pearson’s heatmap depicting the 45 most dysregulated genes involved in neuron projection development common between day 60 CS789 and IUFi001 organoids in comparison to CTRL (B4). (F) Pearson’s heatmap depicting the 40 most dysregulated genes involved in brain development common between day 60 CS789 and IUFi001 organoids in comparison to CTRL (B4). (G) Pearson’s heatmap depicting the 40 most dysregulated genes involved in synaptic signalling common between day 60 CS789 and IUFi001 organoids in comparison to CTRL (B4).
Figure 7
Figure 7
Metascape-based analysis of common genes dysregulated in day 30 CS neurospheres and day CS 60 organoids. (A) Bar graph of the 16 enrichment clusters attributable to the 181 DEGs regulated in both day 30 CS NS and day 60 CS COs in comparison to CTRL (B4). (B,C) Schematic of the pathway steroid biosynthesis with the genes upregulated in CSB-deficient day 30 NS (B) and day 60 COs (C) indicated in red. (D,F,H,J) Relative mRNA expression analysis of HMGCR (D), SQLE (F), DHCR7 (H) and MSMO1 (J) in CS789 and IUFi001 organoids compared to CTRL (B4). (E,G,I,K) qRT-PCR analysis of HMGCR (E), SQLE (G), DHCR7 (I) and MSMO1 (K) mRNA expression in CS789 and IUFi001 organoids relative to CTRL (B4). (L,M) Schematic of p53 signalling pathway with genes upregulated in CSB-deficient day 30 NS (L) and day 60 COs (M) indicated in red and genes downregulated indicated in green. Genes which are not expressed are indicated in yellow. (N,O) Western blot analysis for SQLE in day 30 NS (N) and day 60 COs (O). (P) Quantification of SQLE Western blot analysis at the day 30 NS and day 60 CO stage in CTRL (B4), CS789 and IUFi001. SQLE expression of CS789 and IUFi001 is compared to SQLE expression in CTRL (B4) of the respective timepoint. (Q,R) Western blot analysis for p53 in day 30 NS (Q) and day 60 COs (R). (S) Quantification of p53 Western blot analysis at the day 30 NS and day 60 CO stage in CTRL (B4), CS789 and IUFi001. SQLE expression of CS789 and IUFi001 is compared to p53 expression in CTRL (B4) of the respective timepoint. (N,O) Asterisks (*) indicate bands of interest.

Similar articles

Cited by

References

    1. Cockayne E.A. Dwarfism with retinal atrophy and deafness. Arch. Dis. Child. 1936;11:1. doi: 10.1136/adc.11.61.1. - DOI - PMC - PubMed
    1. Licht C.L., Stevnsner T., Bohr V.A. Cockayne syndrome group B cellular and biochemical functions. Am. J. Hum. Genet. 2003;73:1217–1239. doi: 10.1086/380399. - DOI - PMC - PubMed
    1. Nance M.A., Berry S.A. Cockayne syndrome: Review of 140 cases. Am. J. Med. Genet. 1992;42:68–84. doi: 10.1002/ajmg.1320420115. - DOI - PubMed
    1. Laugel V. Cockayne syndrome: The expanding clinical and mutational spectrum. Mech. Ageing Dev. 2013;134:161–170. doi: 10.1016/j.mad.2013.02.006. - DOI - PubMed
    1. Weidenheim K.M., Dickson D.W., Rapin I. Neuropathology of Cockayne syndrome: Evidence for impaired development, premature aging, and neurodegeneration. Mech. Ageing Dev. 2009;130:619–636. doi: 10.1016/j.mad.2009.07.006. - DOI - PubMed

Publication types

MeSH terms

LinkOut - more resources