. 2024 Mar 29;13(7):595.
doi: 10.3390/cells13070595.

Sustained Retinal Defocus Increases the Effect of Induced Myopia on the Retinal Astrocyte Template

Affiliations

Sustained Retinal Defocus Increases the Effect of Induced Myopia on the Retinal Astrocyte Template

Carol R Lin et al. Cells. .

Abstract

The aim of this article is to describe sustained myopic eye growth's effect on astrocyte cellular distribution and its association with inner retinal layer thicknesses. Astrocyte density and distribution, retinal nerve fiber layer (RNFL), ganglion cell layer, and inner plexiform layer (IPL) thicknesses were assessed using immunochemistry and spectral-domain optical coherence tomography on seventeen common marmoset retinas (Callithrix jacchus): six induced with myopia from 2 to 6 months of age (6-month-old myopes), three induced with myopia from 2 to 12 months of age (12-month-old myopes), five age-matched 6-month-old controls, and three age-matched 12-month-old controls. Untreated marmoset eyes grew normally, and both RNFL and IPL thicknesses did not change with age, with astrocyte numbers correlating to RNFL and IPL thicknesses in both control age groups. Myopic marmosets did not follow this trend and, instead, exhibited decreased astrocyte density, increased GFAP+ spatial coverage, and thinner RNFL and IPL, all of which worsened over time. Myopic changes in astrocyte density, GFAP+ spatial coverage and inner retinal layer thicknesses suggest astrocyte template reorganization during myopia development and progression which increased over time. Whether or not these changes are constructive or destructive to the retina still remains to be assessed.

Keywords: aging; astrocytes; marmoset; myopia; neurovascular unit.


Conflict of interest statement

The authors declare no conflicts of interest.

Figures

Figure 1
Figure 1
A whole marmoset retina’s superficial vasculature is seen, along with images of the astrocytes and astrocyte layers in the three retinal regions studied. The figure is modified from Lin et al. [17]. (A) A control marmoset’s retinal vasculature map [green; (ID: C16 Left)] is shown. Outlined in blue is the temporal region of the eye, with fovea location denoted by a yellow circle. The retinal vasculature shown is visualized using conjugated Isolectin-488, and consists of multiple images acquired at 4× magnification and stitched together using Photoshop. The peripapillary (Pp) and peripheral regions (Ph) quantified in this study are shown, as are the locations where the images were taken. Focal areas away from the center of the retina (optic nerve) to periphery are shown via the white boxes numbered 1–6. Inferior, superior, temporal, and nasal quadrants of the retina are also shown. Scale bar, 1000 μm. (B) An image of the temporal retina (left) is highlighted in blue, and visualized using isolectin (green). The fovea location is shown by the yellow circle. Numbers in the white boxes represent areas evaluated (1: parafoveal, 2: peripapillary, 3: periphery). Reconstructed images (right) from areas 1, 2, and 3 show the distribution of astrocytes (red) and the vasculature (green). The four vascular plexi, from the inner to outer retina, are the radial peripapillary capillary (RPC), superficial (SCP), intermediate (ICP), and deep (DCP) plexi. Scale bar, 20 µm. (CE) Images of representative retinal astrocytes (red) found in areas 1, 2, and 3. Scale bar, 50 µm. In area 1 (parafovea), astrocytes are distributed among two vascular layers, the RPC and SCP layers. In other areas (2, 3), astrocytes are found only in one layer, the superficial layer.
Figure 2
Figure 2
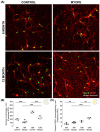
Myopic marmoset retinas exhibit decreased astrocyte density and increased GFAP+ spatial coverage in the parafoveal RPC layer retina. ** = p < 0.01, *** = p < 0.001. (A) Some representative images of control marmoset parafoveal RPC layer astrocytes (6-month control ID tag: H16 Right, 12-month control ID tag: X15 Right) and myopic marmoset parafoveal RPC layer astrocytes (6-month myope ID tag: P17 Right, 12-month myope ID tag: I19 Right). Astrocyte cell nuclei and spatial distribution were labeled with Sox9 (green) and GFAP (red) markers, respectively. (B) Analysis was performed for astrocyte density in the parafoveal RPC layer (6-month control n = 5, 6-month myopic n = 6, 12-month control n = 3, 12-month myopic n = 3). Data are shown as a box plot with SE as the box and SD for whiskers, with the yellow section in the pie chart indicating the region that was analyzed (parafoveal RPC layer) in (B,C). Significantly decreased parafoveal RPC layer astrocyte density was seen in both young and older myopic eyes (6-month p < 0.001; 12-month p < 0.001). (C) Increased GFAP+ spatial coverage was seen in the myopic parafoveal RPC layer of astrocytes (6-month p < 0.01), which was still significant in aged myopic retinas (12-month p < 0.01).
Figure 3
Figure 3
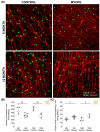
Myopic marmoset retinas exhibit decreased astrocyte density and increased GFAP+ spatial coverage in the parafoveal SCP layer retina. * = p < 0.05, *** = p < 0.001. (A) Some representative images of control marmoset parafoveal SCP layer astrocytes (6-month control ID tag: H16 Right, 12-month control ID tag: S15 Right) and myopic marmoset parafoveal RPC layer astrocytes (6-month myope ID tag: O17 Right, 12-month myope ID tag: I19 Right) are shown. Astrocyte cell nuclei and spatial distribution were labeled with Sox9 (green) and GFAP (red) markers, respectively. (B) Analysis was performed for astrocyte density in the parafoveal SCP layer (6-month control n = 5, 6-month myopic n = 6, 12-month control n = 3, 12-month myopic n = 3). Data are shown as a box plot with SE as the box and SD for whiskers, with the yellow section in the pie chart indicating the region that was analyzed (parafoveal SCP layer) in (B,C). Significantly decreased parafoveal SCP astrocyte density was identified in both young and older myopic eyes (6-month p < 0.001; 12-month p < 0.05). (C) Increased GFAP+ spatial coverage was seen in the older myopic parafoveal SCP layer of astrocytes (6-month p > 0.05, 12-month p < 0.05).
Figure 4
Figure 4
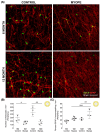
Myopic marmoset retinas exhibit decreased astrocyte density and increased GFAP+ spatial coverage in the peripapillary retina. * = p < 0.05, ** = p < 0.01. (A) Some representative images of control marmoset peripapillary astrocytes (6-month control ID tag: H16 Right, 12-month control ID tag: X15 Right) and myopic marmoset peripapillary astrocytes (6-month myope ID tag: O17 Right, 12-month myope ID tag: I19 Right) are shown. Astrocyte cell nuclei and spatial distribution were labeled with Sox9 (green) and GFAP (red) markers, respectively. (B) Analysis was performed for astrocyte density in the peripapillary region (6-month control n = 5, 6-month myopic n = 6, 12-month control n = 3, 12-month myopic n = 3). Data are shown as a box plot with SE as the box and SD for whiskers, with the yellow section in the pie chart indicating the region that was analyzed (peripapillary) in (B,C). Significantly decreased peripapillary astrocyte density was seen in both young and older myopic eyes (6-month p < 0.01; 12-month p < 0.01). (C) Increased GFAP+ spatial coverage was seen in the myopic peripapillary retina (6-month p < 0.05, 12-month p < 0.05).
Figure 5
Figure 5
Myopic marmoset retinas exhibit decreased astrocyte density and increased GFAP+ spatial coverage in the peripheral retina. * = p < 0.05, ** = p < 0.01, *** = p < 0.001. (A) Some representative images of control marmoset peripheral astrocytes (6-month control ID tag: H16 Right, 12-month control ID tag: X15 Right) and myopic marmoset peripheral astrocytes (6-month myope ID tag: P17 Right, 12-month myope ID tag: I19 Right) are shown. Astrocyte cell nuclei and spatial distribution were labeled with Sox9 (green) and GFAP (red) markers, respectively. (B) Analysis was performed for astrocyte density in the peripheral region (6-month control n = 5, 6-month myopic n = 6, 12-month control n = 3, 12-month myopic n = 3). Data are shown as a box plot with SE as the box and SD for whiskers, with the yellow section in the pie chart indicating the region that was analyzed (peripheral) in (B,C). Significantly decreased peripheral astrocyte density was identified in both young and older myopic eyes (6-month p < 0.05; 12-month p < 0.01). (C) Increased GFAP+ spatial coverage was seen in older myopic peripheral retinas (6-month p > 0.05, 12-month p < 0.01).
Figure 6
Figure 6
Myopic marmosets have thinner RNFL and IPL thicknesses, with no change to GCL thickness. * p < 0.05, ** p < 0.01. (A) Representative images of macular OCTs gathered from a 6-month-old control (top left), myope treated with negative lenses for four months (top right), 12-month-old control (bottom left), and myope treated with negative lenses for 10 months (bottom right). (B) Myopic RNFL was significantly thinner parafoveally, with effects exacerbated by age (6-month p < 0.01, 12-month p < 0.01). (C) The parafoveal myopic GCL thickness did not differ from that of the control parafoveal GCL thickness (6-month p > 0.05, 12-month p > 0.05). (D) The parafoveal IPL of older myopes was significantly thinner than that of age-matched controls (6-month p > 0.05, 12-month p < 0.05).

Similar articles

Cited by

References

    1. Saw S.M., Gazzard G., Shih-Yen E.C., Chua W.H. Myopia and associated pathological complications. Ophthalmic Physiol. Opt. 2005;25:381–391. doi: 10.1111/j.1475-1313.2005.00298.x. - DOI - PubMed
    1. Curtin B.J. The Myopias: Basic Science and Clinical Management. Harper & Row; Philadelphia, PA, USA: 1985.
    1. Holden B.A., Fricke T.R., Wilson D.A., Jong M., Naidoo K.S., Sankaridurg P., Wong T.Y., Naduvilath T.J., Resnikoff S. Global Prevalence of Myopia and High Myopia and Temporal Trends from 2000 through 2050. Ophthalmology. 2016;123:1036–1042. doi: 10.1016/j.ophtha.2016.01.006. - DOI - PubMed
    1. Flitcroft D.I., He M., Jonas J.B., Jong M., Naidoo K., Ohno-Matsui K., Rahi J., Resnikoff S., Vitale S., Yannuzzi L. IMI—Defining and Classifying Myopia: A Proposed Set of Standards for Clinical and Epidemiologic Studies. Investig. Ophthalmol. Vis. Sci. 2019;60:M20–M30. doi: 10.1167/iovs.18-25957. - DOI - PMC - PubMed
    1. Wong T.Y., Klein B.E., Klein R., Knudtson M., Lee K.E. Refractive errors, intraocular pressure, and glaucoma in a white population. Ophthalmology. 2003;110:211–217. doi: 10.1016/S0161-6420(02)01260-5. - DOI - PubMed

Publication types

LinkOut - more resources