. 2024 Mar 29;13(7):598.
doi: 10.3390/cells13070598.

The ZIKV NS5 Protein Aberrantly Alters the Tubulin Cytoskeleton, Induces the Accumulation of Autophagic p62 and Affects IFN Production: HDAC6 Has Emerged as an Anti-NS5/ZIKV Factor

Affiliations

The ZIKV NS5 Protein Aberrantly Alters the Tubulin Cytoskeleton, Induces the Accumulation of Autophagic p62 and Affects IFN Production: HDAC6 Has Emerged as an Anti-NS5/ZIKV Factor

Silvia Pérez-Yanes et al. Cells. .

Abstract

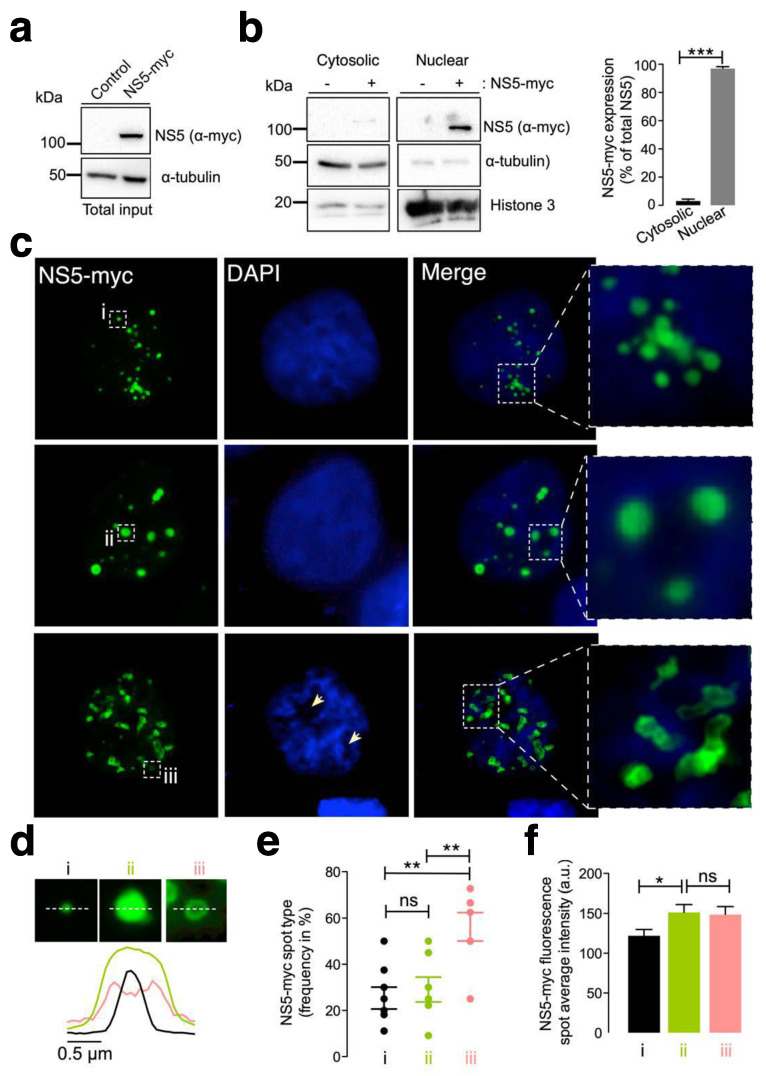
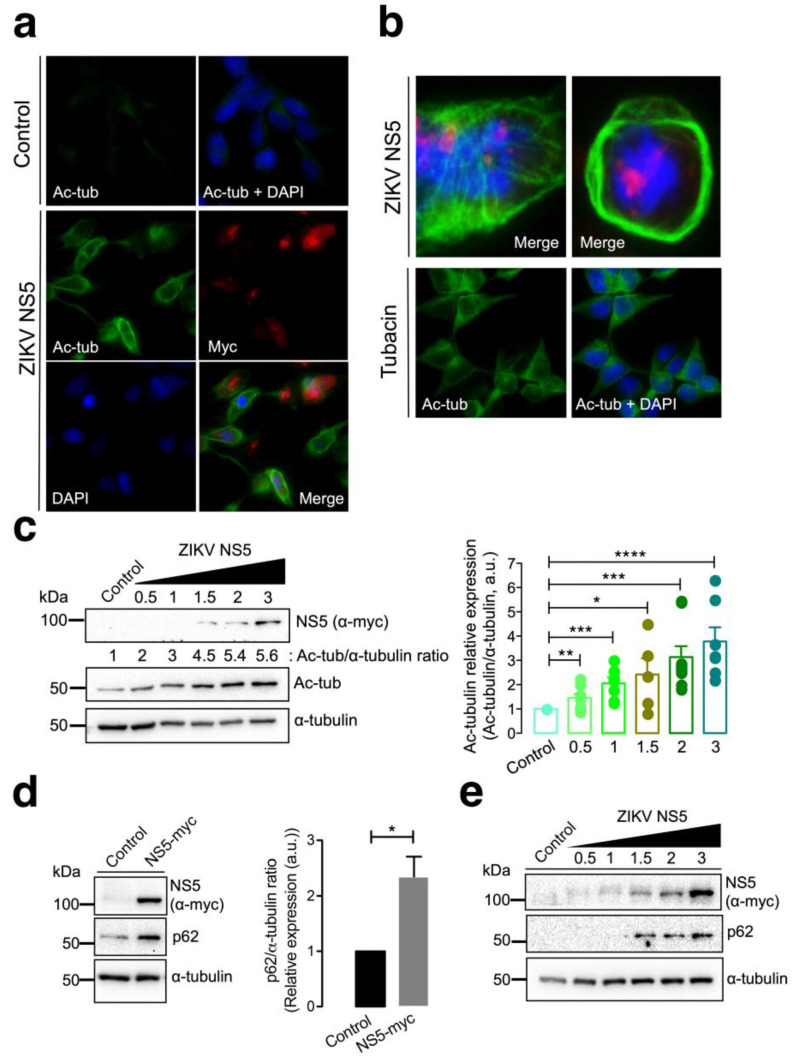
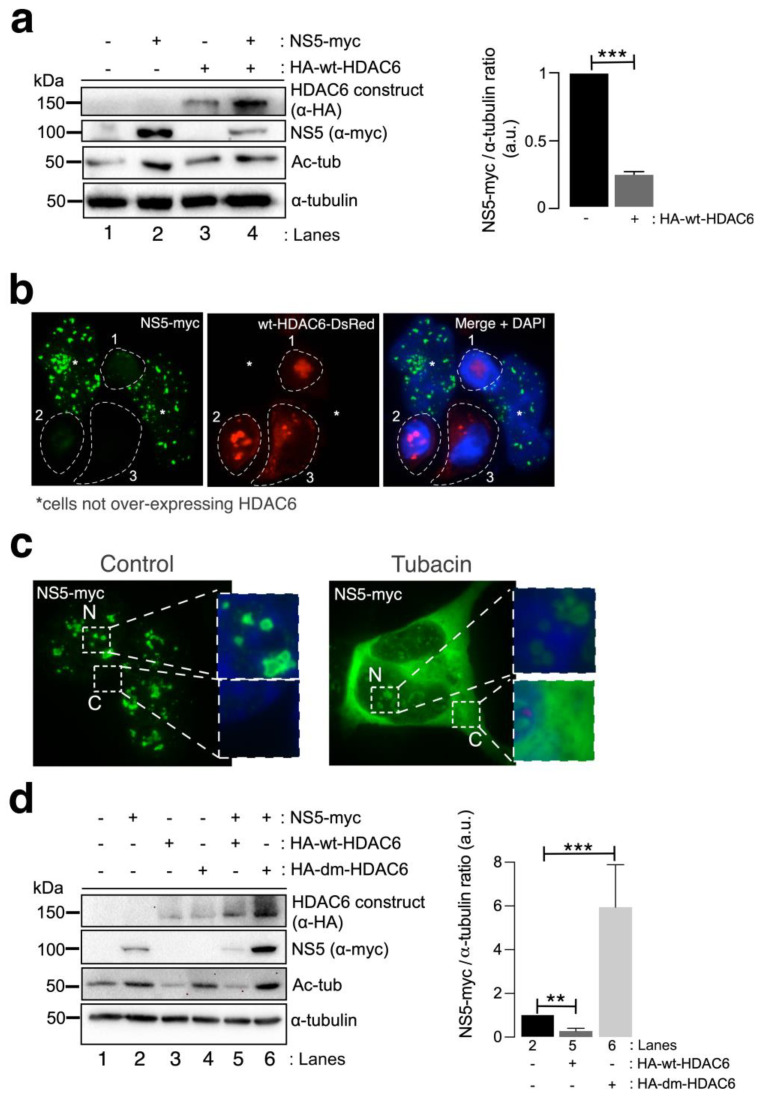
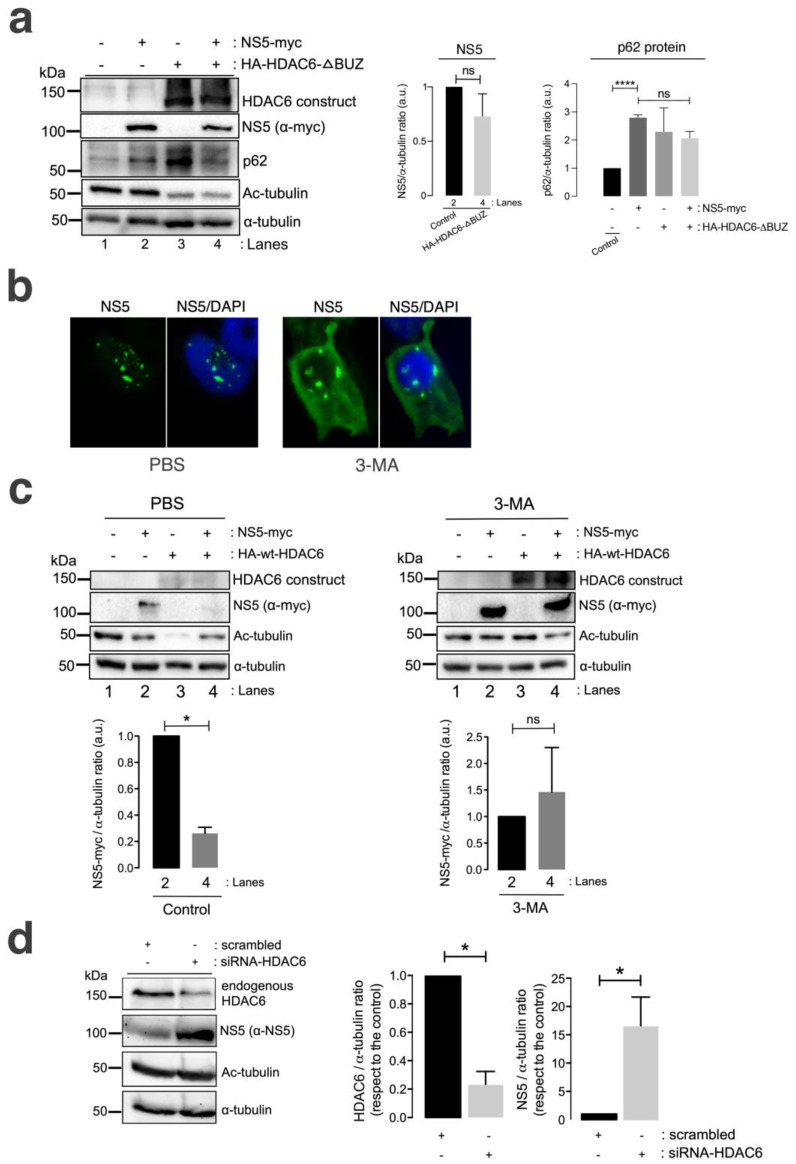
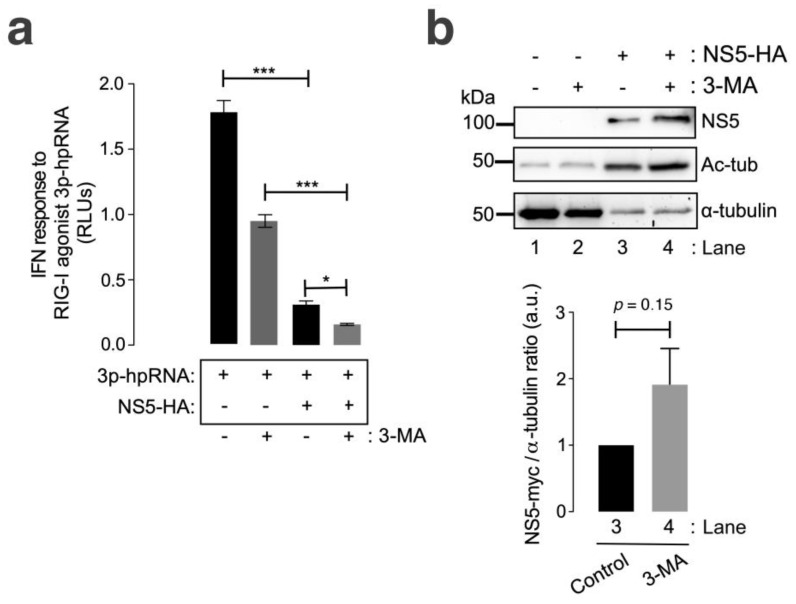
Zika virus (ZIKV) infection and pathogenesis are linked to the disruption of neurogenesis, congenital Zika syndrome and microcephaly by affecting neural progenitor cells. Nonstructural protein 5 (NS5) is the largest product encoded by ZIKV-RNA and is important for replication and immune evasion. Here, we studied the potential effects of NS5 on microtubules (MTs) and autophagy flux, together with the interplay of NS5 with histone deacetylase 6 (HDAC6). Fluorescence microscopy, biochemical cell-fractionation combined with the use of HDAC6 mutants, chemical inhibitors and RNA interference indicated that NS5 accumulates in nuclear structures and strongly promotes the acetylation of MTs that aberrantly reorganize in nested structures. Similarly, NS5 accumulates the p62 protein, an autophagic-flux marker. Therefore, NS5 alters events that are under the control of the autophagic tubulin-deacetylase HDAC6. HDAC6 appears to degrade NS5 by autophagy in a deacetylase- and BUZ domain-dependent manner and to control the cytoplasmic expression of NS5. Moreover, NS5 inhibits RNA-mediated RIG-I interferon (IFN) production, resulting in greater activity when autophagy is inhibited (i.e., effect correlated with NS5 stability). Therefore, it is conceivable that NS5 contributes to cell toxicity and pathogenesis, evading the IFN-immune response by overcoming HDAC6 functions. HDAC6 has emerged as an anti-ZIKV factor by targeting NS5.

Keywords: BUZ domain; HDAC6; MT acetylation; NS5; NS5 clearance; ZIKV; aberrant MTs; autophagic p62; inhibition of IFN production; tubulin deacetylase.


Conflict of interest statement

The authors declare no conflicts of interest. The funders had no role in the design of the study; in the collection, analyses, or interpretation of data; in the writing of the manuscript; or in the decision to publish the results.

Figures

Figure 1
Figure 1
Characterization of the ZIKV NS5 protein expression pattern. (a) Quantitative Western blot analysis of the C-terminal myc-tagged NS5 (NS5-myc) viral protein construct (1.5 µg cDNA) and total α-tubulin protein in a viral packaging HEK-293T cell model compared to those in control cells transfected with the pcDNATM 3.1(+) plasmid (1.5 µg cDNA). The α-tubulin protein was used as the control for total protein loading. A representative of two experiments is shown (see associated data in Figure S1A). (b) Left, Quantitative Western blot analysis of the cell fraction of HEK-293T cells overexpressing NS5-myc (1.5 µg cDNA) and its distribution. Histone 3 was used as the protein control for the nuclear fraction, whereas α-tubulin was used for the cytoplasmic fraction and total protein load. A representative of two experiments is shown (see associated data in Figure S1B). Right, histograms quantifying the distribution of nuclear and cytoplasmic NS5-myc in lysates from (b) experiments, normalized to total α-tubulin. NS5 is mostly found in the nucleus. The data are presented as the means ± S.E.M. of two independent experiments. (c) Immunofluorescence microscopy images of HEK-293T cells overexpressing NS5-myc (1.5 µg cDNA) and fixed at 48 h post transfection. The subcellular localization of NS5 was determined using a specific α-myc mAb (green). DAPI is a blue, fluorescent probe for DNA staining. Images were captured using a 100× objective and analysed with the MetaMorph program. NS5 is found in the nucleus and forms three types of structure: uniform punctate shapes ranging from one (type i) to several (type ii) micrometres in diameter, and spheroidal and ring-shaped shapes with longer sizes (type iii). Arrowheads denote the lack of DNA and NS5 colocalization. (d) Line scanning of the different structures containing the NS5 viral protein (α-myc mAb (green)) (type i, black lines; type ii, green lines; and type iii, pink lines). (e) Quantification of the frequency of the presence of different NS5 structures (type i, black dots; type ii, green dots; and type iii, pink dots) per cell and statistical analysis (n = 80 cells). (f) Average fluorescence intensity plot of NS5 spots in different structures (type i, black bar; type ii, green bar; and type iii, pink bar) per cell (n = 80 cells). In this figure, when indicated, the p values are *** p ≤ 0.001, ** p ≤ 0.01 and * p ≤ 0.05; ns indicates not statistically significant (p > 0.05). The p value is the comparison of the means between the two groups using the parametric Student’s t test.
Figure 2
Figure 2
Characterization of the effect of the ZIKV NS5 protein on microtubule stabilization and reorganization and on the accumulation of the autophagy marker p62. (a) Immunofluorescence microscopy analysis of the effect of NS5 on microtubules (MTs) in HEK-293T cells overexpressing NS5-myc (1.5 µg cDNA) compared to that in control cells transfected with the pcDNATM 3.1(+) plasmid (1.5 µg cDNA). In this representative experiment, cells were processed for immunostaining with antibodies against the acetylated Lys40 residue in α-tubulin (green) and/or NS5 (using an anti-myc mAb) (red). DAPI is a blue, fluorescent probe for DNA staining. Images were captured using a 40× objective and analysed with the MetaMorph program. (b) Immunofluorescence microscopy images showing the exacerbated nested structure of acetylated MTs promoted in cells overexpressing NS5 (1.5 µg cDNA) (images captured using a 100× objective). As a control for the acetylation of MTs, cells were treated with tubacin (1 μM), a specific inhibitor of the deacetylase activity of HDAC6. This image (captured using a 40× objective) also serves as a control for the NS5-mediated acetylation of MTs images presented in panel (a). In these representative experiments, cells were processed for immunostaining with antibodies against the acetylated Lys40 residue in α-tubulin (green) and/or NS5 (using an anti-myc mAb) (red). DAPI is a blue, fluorescent probe for DNA staining. Images were captured using a 100× or 40× objective, as indicated, and analysed with the MetaMorph program. (c) Quantitative Western blot analysis of the dose–response effect of NS5 overexpression on MT stabilization, as monitored by the acetylation of MTs at Lys40 α-tubulin residues. The α-tubulin protein was used as the loading control protein. A representative of nine independent experiments is shown (see associated data in Figure S2C). Histograms quantifying the amount of acetylated α-tubulin induced by NS5 in stabilized MTs from nine replicates of the experiment shown in panel (c). The data were normalized to the total α-tubulin protein. (d) Western blot analysis of the effect of the NS5 viral protein (1.5 µg cDNA) on the accumulation of the autophagic protein p62 in HEK-293T cells. NS5, p62 and total α-tubulin are shown. Histograms quantifying the amount of p62 stabilized by NS5 from the experiments are shown in panel (d). The data were normalized to the total α-tubulin protein. The data are presented as the means ± S.E.M. of three independent experiments (see associated data in Figure S2D). (e) Quantitative Western blot analysis of the dose–response effect of NS5 overexpression on the accumulation of the autophagic protein p62 in HEK-293T cells overexpressing NS5. NS5, p62 and total α-tubulin are shown. The data are presented as the means ± S.E.M. of four independent experiments (see associated data in Figure S2E). In panels (ce), when indicated, the p values are **** p ≤ 0.0001, *** p ≤ 0.001, ** p ≤ 0.01 and * p ≤ 0.1; ns indicates not statistically significant (p > 0.05). The p value is the comparison of the means between the two groups using the parametric Student’s t test.
Figure 3
Figure 3
HDAC6 targets the ZIKV NS5 protein in a deacetylase-dependent manner, regulating the expression of NS5 in the cytoplasm. (a) Quantitative Western blot analysis of HEK-293T cells overexpressing NS5-myc (lane 2), N-terminal HA-tagged wt-HDAC6 (HA-wt-HDAC6) (lane 3) or both constructs (lane 4) (1.5 µg cDNA) and comparison to control cells transfected with the pcDNATM 3.1(+) plasmid (1.5 µg cDNA) (lane 1). The negative effects of HA-wt-HDAC6 on NS5-myc expression (lane 4), the stabilization of acetylated MTs by NS5 (lane 2) and the deacetylase activity of HDAC6 on acetylated MTs (lanes 3 and 4) are shown. The α-tubulin protein was used as the loading control protein. A representative experiment of four is shown (see associated data in Figure S3A). Histograms quantifying the amount of NS5-myc expressed in the absence (corresponding to lane 2 in the left panel) or presence of overexpressed HDAC6 (corresponding to lane 4 in the left panel) normalized to total α-tubulin. The data are presented as the means ± S.E.M. of four independent experiments. (b) Immunofluorescence images showing NS5 labelling 48 h post transfection in cells cotransfected with HDAC6-DsRed (red), fixed and labelled with an α-myc antibody for NS5 detection (green). NS5 was detected only in cells not overexpressing wt-HDAC6-DsRed (white asterisks). The white dotted lanes indicate the cell perimeters of three cells (1–3) that expressed wt-HDAC6-DsRed in the field. DAPI is a blue, fluorescent probe for DNA staining. Images were captured using a 100× objective and analysed with the MetaMorph program. (c) Immunofluorescence microscopy analysis of NS5 cell distribution in cells treated or not treated (control) with tubacin (1 μM), a deacetylase inhibitor of HDAC6, in cells overexpressing NS5-myc (1.5 µg cDNA). The cells were processed for immunostaining with an anti-myc mAb (green). DAPI is a blue, fluorescent probe for DNA staining. Images were captured using a 100× objective and analysed with the MetaMorph program. (d) Quantitative Western blot analysis of the effect of functional (HA-wt-HDAC6) or deacetylase inactive (HA-dm-HDAC6) HDAC6 on the stability of the ZIKV NS5 protein (NS5-myc) in HEK-293T cells overexpressing the different constructs (1.5 µg cDNA per construct) and comparison with cells overexpressing either only NS5 or only HA-wt-HDAC6 or HA-dm-HDAC6. The levels of acetylated α-tubulin and total α-tubulin under the different experimental conditions are shown. A representative experiment of two is shown (see associated data in Figure S3D). Histograms quantifying the amount of NS5 detected in cells from the experiment (d). The data are presented as the means ± S.E.M. of two independent experiments. For the quantitative analysis of the Western blots, when indicated, the p values are *** p ≤ 0.001 and ** p ≤ 0.01. The p value is the comparison of the means between the two groups using the parametric Student’s t test.
Figure 4
Figure 4
HDAC6 promotes the autophagic clearance of the ZIKV NS5 protein. (a) Quantitative Western blot analysis of HEK-293T cells overexpressing NS5-myc (lane 2) or the N-terminal HA-tagged HDAC6 mutant lacking the C-terminal BUZ domain (HA-HDAC6-DBUZ) (lane 3) or both constructs (lane 4) (1.5 µg cDNA) and comparison to control cells transfected with the pcDNATM 3.1(+) plasmid (1.5 µg cDNA) (lane 1). The absence of a degradative effect of HA-HDAC6-DBUZ on NS5-myc expression (lane 4) and the deacetylation of MTs by HA-HDAC6-DBUZ, which is deacetylase active (lanes 3 and 4) are shown. NS5 could not stabilize acetylated MTs under these experimental conditions (lane 4). The α-tubulin protein was used as the loading control protein. A representative experiment of three is shown (see associated data in Figure S4A). Left histograms quantifying the amount of NS5-myc expressed in the absence (corresponding to lane 2 in the western blot panel) or presence of overexpressed HA-HDAC6-DBUZ (corresponding to lane 4 in the western blot panel), normalized to total α-tubulin. Right histograms quantifying the amount of p62 protein expressed in cells overexpressing NS5-myc, HA-HDAC6-DBUZ or both constructs (corresponding to lanes 2–4 in the western blot panel, respectively) and compared with that in control cells (corresponding to lane 1 in the western blot panel). These data are presented as the means ± S.E.M. of three independent experiments. (b) Immunofluorescence microscopy analysis of NS5 cell distribution in cells treated or not treated (control) with 3-MA (5 mM), an inhibitor of HDAC6-mediated aggresome formation and further autophagy clearance of targeted proteins, in cells overexpressing NS5-myc (1.5 µg cDNA). The cells were processed for immunostaining with an anti-myc mAb (green). DAPI is a blue, fluorescent probe for DNA staining. Images were captured using a 100x objective and analysed with the MetaMorph program. (c) Quantitative Western blot analysis of HEK-293T cells overexpressing NS5-myc (lane 2), the functional HA-HDAC6 construct (lane 3) or both constructs (lane 4) (1.5 µg cDNA), compared to control cells transfected with the pcDNATM 3.1(+) plasmid (1.5 µg cDNA) (lane 1) under control conditions (PBS-treated cells, vehicle for 3-MA) or cells treated with 3-MA (5 mM). The absence of a degradative effect exerted by HA-HDAC6 on NS5 in the presence of 3-MA (lane 4 in 3-MA-treated cells compared to lane 4 in PBS-treated cells) and the deacetylation of MTs by HA-HDAC6 are shown. The α-tubulin protein was used as the loading control protein. A representative experiment of 2 is shown (see associated data in Figure S4C). Histograms quantifying the amount of NS5-myc expressed in the absence (lane 2) or presence of overexpressed HA-HDAC6 (lane 4), normalized to total α-tubulin, in both PBS- and 3-MA-treated cells are shown. The data are presented as the means ± S.E.M. of 2 independent experiments. (d) Quantitative Western blot analysis of the effect of siRNA-mediated knockdown of endogenous HDAC6 (siRNA-HDAC6, 25 pmol/well) on the level of NS5 protein expression in HEK-293T cells overexpressing NS5-myc and compared to that in control and scrambled (1 µM)-treated cells. A representative experiment of four is shown (see associated data in Figure S4D). Histograms quantifying the amount of endogenous HDAC6 and NS5 detected in cells treated with siRNA-HDAC6 or scrambled oligos, normalized to total α-tubulin. The data are presented as the means ± S.E.M. of four independent experiments. For quantitative analysis of Western blots, when indicated, the p values are **** p ≤ 0.0001 and * p ≤ 0.1; ns indicates not statistically significant (p > 0.05). The p value is the comparison of the means between the two groups using the parametric Student’s t test.
Figure 5
Figure 5
The ZIKV NS5 protein inhibits RNA-triggered RIG-I-mediated IFN production, and this effect is enhanced by autophagy inhibition. (a) Quantitative assay of the inhibitory effect of NS5 on RNA-triggered RIG-I-mediated IFN production in HEK-LuciaTM RIG-I cells expressing NS5 (1.5 µg cDNA) and treated with 3p-hpRNA (100 nM), an RNA-specific RIG-I agonist, for 24 h before the IFN-I response was quantified by QUANTI-Luc. The data obtained from control cells transfected with the pcDNATM 3.1(+) plasmid (1.5 µg cDNA) and treated with 3p-hpRNA (100 nM) are shown. The effect of 3-MA (5 mM) on the NS5-mediated inhibition of 3p-hpRNA-triggered RIG-I-mediated IFN production is shown. The data are presented as the means ± S.E.M. of two independent experiments (n = 6). (b) Quantitative Western blot analysis of the effect of 3-MA treatment on HEK-Lucia cells overexpressing NS5-myc (1.5 µg cDNA). This biochemical analysis corresponds to the cells shown in panel (a) for RNA-mediated RIG-I IFN production. Lanes 1 and 2 represent control cells transfected with the pcDNATM 3.1(+) plasmid (1.5 µg cDNA) and treated with PBS (vehicle for 3-MA) or 3-MA (5 mM), respectively. Lanes 3 and 4 represent cells overexpressing NS5 (NS5-HA plasmid, 1.5 µg cDNA) and treated with PBS or 3-MA (5 mM), respectively. The stabilization effect of 3-MA on NS5 (lane 4 in 3-MA-treated cells compared to lane 3 in PBS-treated cells) and the NS5-mediated acetylation of MTs are shown. The α-tubulin protein was used as the loading control protein. A representative experiment of two is shown (see associated data in Figure S5B). Histograms quantifying the amount of NS5-HA expressed, normalized to total α-tubulin, in both control (PBS)- and 3-MA-treated cells from the top Western blot experiments. The data are presented as the means ± S.E.M. of two independent experiments. In (a), the p values are *** p ≤ 0.001 and * p ≤ 0.1, and in (b), the p value is 0.15. The p value is the comparison of the means between the two groups using the parametric Student’s t test.

Similar articles

Cited by

References

    1. Marchette N.J., Garcia R., Rudnick A. Isolation of Zika virus from Aedes aegypti mosquitoes in Malaysia. Am. J. Trop. Med. Hyg. 1969;18:411–415. doi: 10.4269/ajtmh.1969.18.411. - DOI - PubMed
    1. Kuno G., Chang G.J. Full-length sequencing and genomic characterization of Bagaza, Kedougou, and Zika viruses. Arch. Virol. 2007;152:687–696. doi: 10.1007/s00705-006-0903-z. - DOI - PubMed
    1. Mayer S.V., Tesh R.B., Vasilakis N. The emergence of arthropod-borne viral diseases: A global prospective on dengue, chikungunya and zika fevers. Acta Trop. 2017;166:155–163. doi: 10.1016/j.actatropica.2016.11.020. - DOI - PMC - PubMed
    1. Diallo D., Sall A.A., Diagne C.T., Faye O., Faye O., Ba Y., Hanley K.A., Buenemann M., Weaver S.C., Diallo M. Zika virus emergence in mosquitoes in southeastern Senegal, 2011. PLoS ONE. 2014;9:e109442. doi: 10.1371/journal.pone.0109442. - DOI - PMC - PubMed
    1. Faye O., Faye O., Diallo D., Diallo M., Weidmann M., Sall A.A. Quantitative real-time PCR detection of Zika virus and evaluation with field-caught mosquitoes. Virol. J. 2013;10:311. doi: 10.1186/1743-422X-10-311. - DOI - PMC - PubMed

Publication types