

Leflunomide Treatment Does Not Protect Neural Cells following Oxygen-Glucose Deprivation (OGD) In Vitro
- PMID: 38607070
- PMCID: PMC11011260
- DOI: 10.3390/cells13070631
Leflunomide Treatment Does Not Protect Neural Cells following Oxygen-Glucose Deprivation (OGD) In Vitro
Abstract
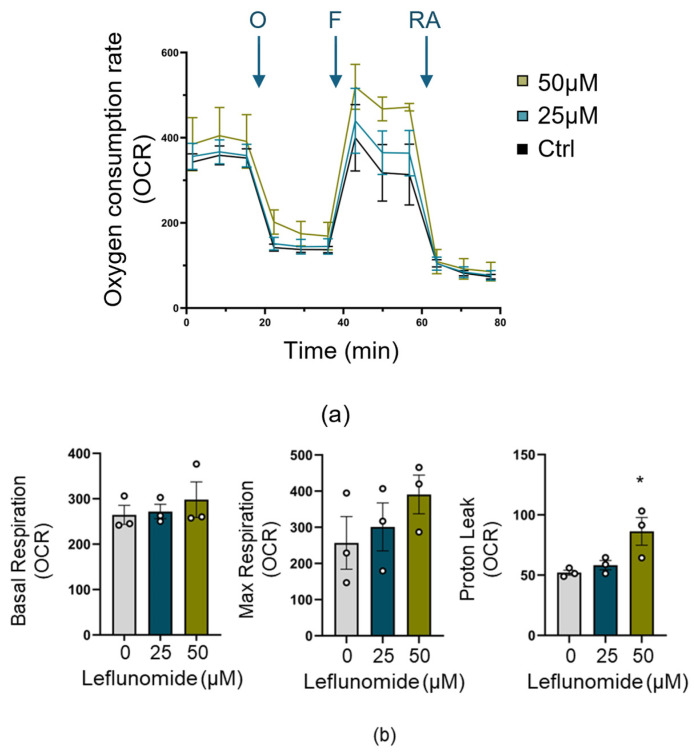
Neonatal hypoxia-ischemia (HI) affects 2-3 per 1000 live births in developed countries and up to 26 per 1000 live births in developing countries. It is estimated that of the 750,000 infants experiencing a hypoxic-ischemic event during birth per year, more than 400,000 will be severely affected. As treatment options are limited, rapidly identifying new therapeutic avenues is critical, and repurposing drugs already in clinical use offers a fast-track route to clinic. One emerging avenue for therapeutic intervention in neonatal HI is to target mitochondrial dysfunction, which occurs early in the development of brain injury. Mitochondrial dynamics are particularly affected, with mitochondrial fragmentation occurring at the expense of the pro-fusion protein Optic Atrophy (OPA)1. OPA1, together with mitofusins (MFN)1/2, are required for membrane fusion, and therefore, protecting their function may also safeguard mitochondrial dynamics. Leflunomide, an FDA-approved immunosuppressant, was recently identified as an activator of MFN2 with partial effects on OPA1 expression. We, therefore, treated C17.2 cells with Leflunomide before or after oxygen-glucose deprivation, an in vitro mimic of HI, to determine its efficacy as a neuroprotection and inhibitor of mitochondrial dysfunction. Leflunomide increased baseline OPA1 but not MFN2 expression in C17.2 cells. However, Leflunomide was unable to promote cell survival following OGD. Equally, there was no obvious effect on mitochondrial morphology or bioenergetics. These data align with studies suggesting that the tissue and mitochondrial protein profile of the target cell/tissue are critical for taking advantage of the therapeutic actions of Leflunomide.
Keywords: Leflunomide; OPA1; hypoxia-ischemia; mitochondria; mitofusins; neonatal; oxygen-glucose deprivation.
Conflict of interest statement
The authors declare no conflict of interest. The funders had no role in the design of the study, in the collection, analyses, or interpretation of data, in the writing of the manuscript, or in the decision to publish the results.
Figures


Similar articles
-
Mitochondrial Optic Atrophy (OPA) 1 Processing Is Altered in Response to Neonatal Hypoxic-Ischemic Brain Injury.Int J Mol Sci. 2015 Sep 17;16(9):22509-26. doi: 10.3390/ijms160922509. Int J Mol Sci. 2015. PMID: 26393574 Free PMC article.
-
Inhibition of ERK downregulates autophagy via mitigating mitochondrial fragmentation to protect SH-SY5Y cells from OGD/R injury.Cell Commun Signal. 2023 Aug 14;21(1):204. doi: 10.1186/s12964-023-01211-3. Cell Commun Signal. 2023. PMID: 37580749 Free PMC article.
-
Mitochondrial dynamics associated with oxygen-glucose deprivation in rat primary neuronal cultures.PLoS One. 2013 May 2;8(5):e63206. doi: 10.1371/journal.pone.0063206. Print 2013. PLoS One. 2013. PMID: 23658809 Free PMC article.
-
Mitochondrial dynamics in the neonatal brain - a potential target following injury?Biosci Rep. 2022 Mar 31;42(3):BSR20211696. doi: 10.1042/BSR20211696. Biosci Rep. 2022. PMID: 35319070 Free PMC article. Review.
-
Mitochondrial dynamics, mitophagy and biogenesis in neonatal hypoxic-ischaemic brain injury.FEBS Lett. 2018 Mar;592(5):812-830. doi: 10.1002/1873-3468.12943. Epub 2017 Dec 25. FEBS Lett. 2018. PMID: 29265370 Review.
Cited by
-
Cocaine Differentially Affects Mitochondrial Function Depending on Exposure Time.Int J Mol Sci. 2025 Feb 27;26(5):2131. doi: 10.3390/ijms26052131. Int J Mol Sci. 2025. PMID: 40076756 Free PMC article.
References
-
- Gale C., Statnikov Y., Jawad S., Uthaya S.N., Modi N. Neonatal brain injuries in England: Population-based incidence derived from routinely recorded clinical data held in the National Neonatal Research Database. Arch. Dis. Child.-Fetal Neonatal Ed. 2018;103:F301–F306. doi: 10.1136/archdischild-2017-313707. - DOI - PMC - PubMed
-
- Krishnan V., Kumar V., Variane G.F.T., Carlo W.A., Bhutta Z.A., Sizonenko S., Hansen A., Shankaran S., Thayyil S., Newborn Brain Society G., et al. Need for more evidence in the prevention and management of perinatal asphyxia and neonatal encephalopathy in low and middle-income countries: A call for action. Semin. Fetal Neonatal Med. 2021;26:101271. doi: 10.1016/j.siny.2021.101271. - DOI - PMC - PubMed
Publication types
MeSH terms
Substances
Grants and funding
LinkOut - more resources
Full Text Sources
Medical
Research Materials
