. 2024 Apr 4;13(7):632.
doi: 10.3390/cells13070632.

A Novel Approach for Glioblastoma Treatment by Combining Apoptosis Inducers (TMZ, MTX, and Cytarabine) with E.V.A. (Eltanexor, Venetoclax, and A1210477) Inhibiting XPO1, Bcl-2, and Mcl-1

Affiliations

A Novel Approach for Glioblastoma Treatment by Combining Apoptosis Inducers (TMZ, MTX, and Cytarabine) with E.V.A. (Eltanexor, Venetoclax, and A1210477) Inhibiting XPO1, Bcl-2, and Mcl-1

Kai Zhao et al. Cells. .

Abstract

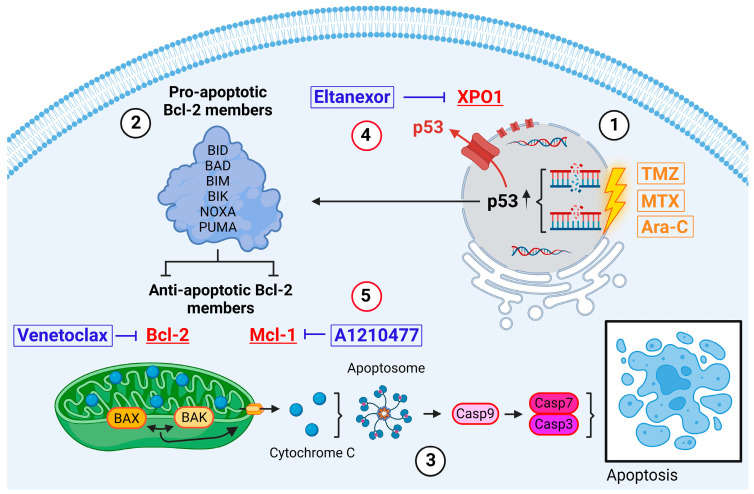
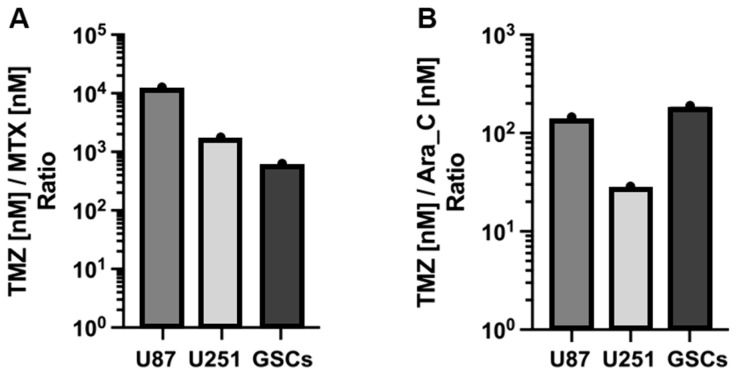
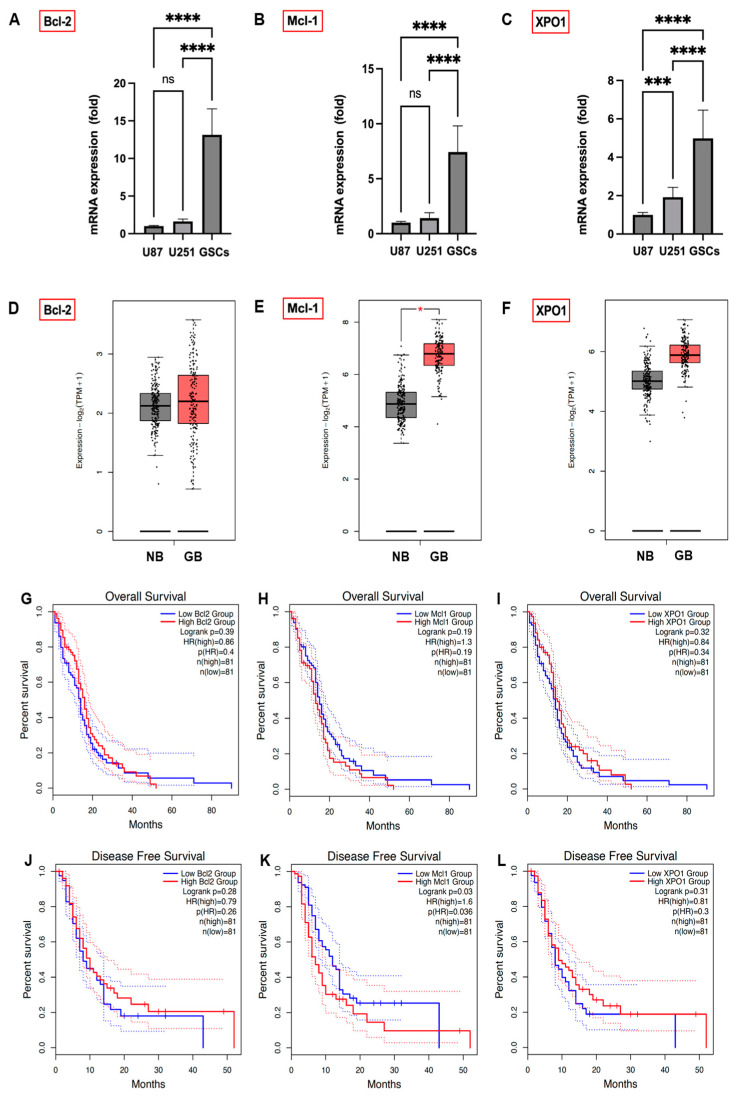
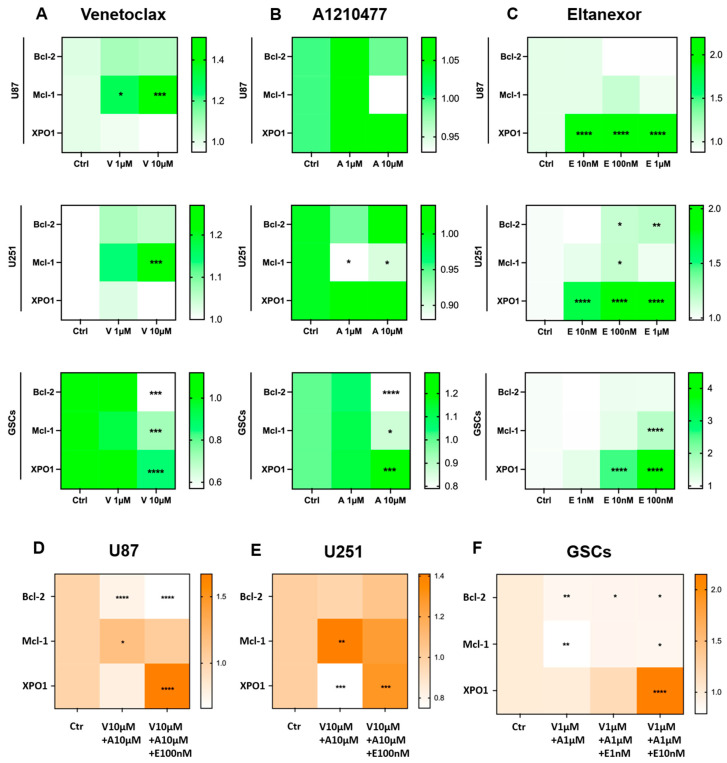
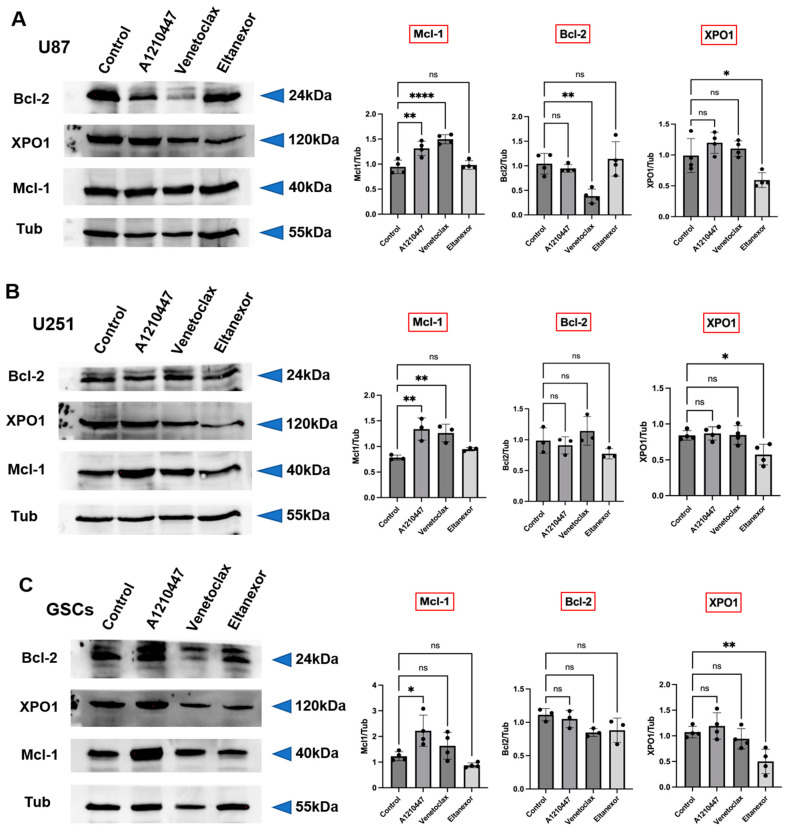
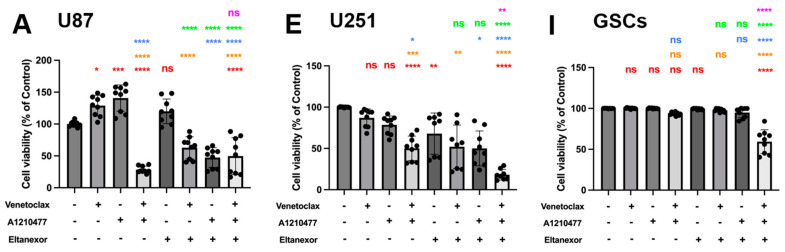
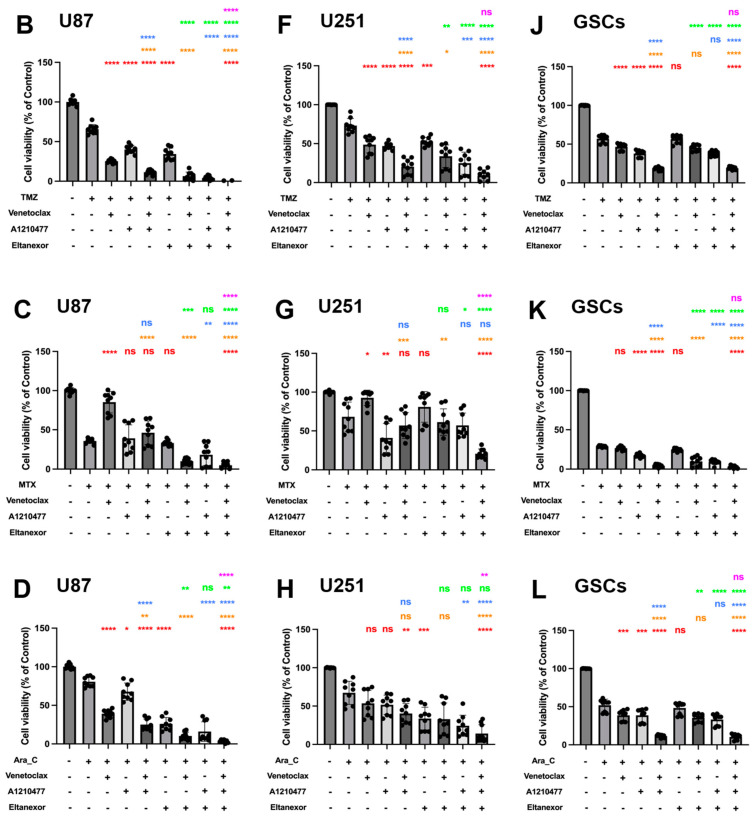
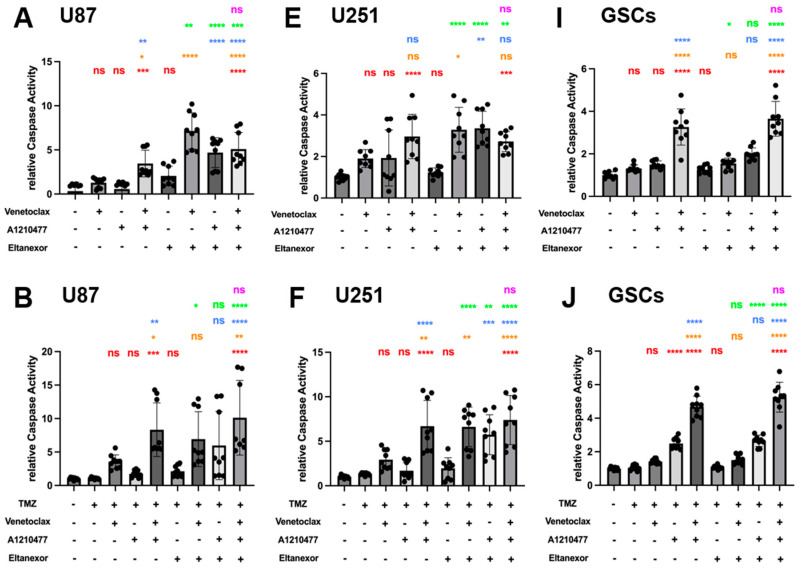
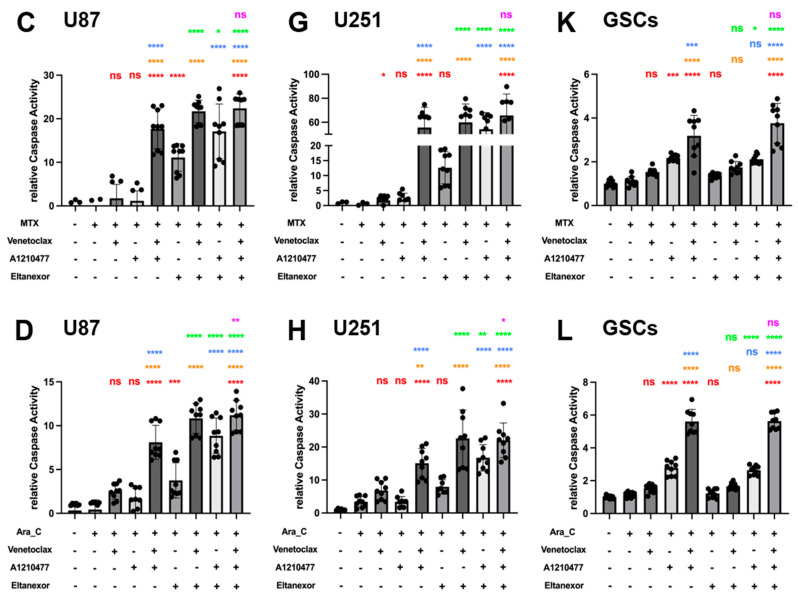
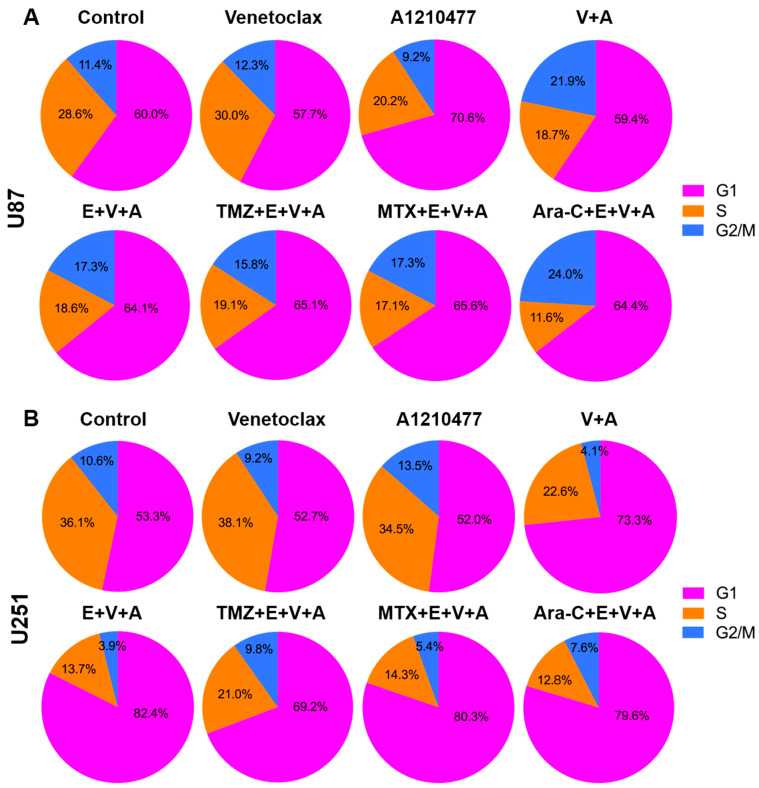
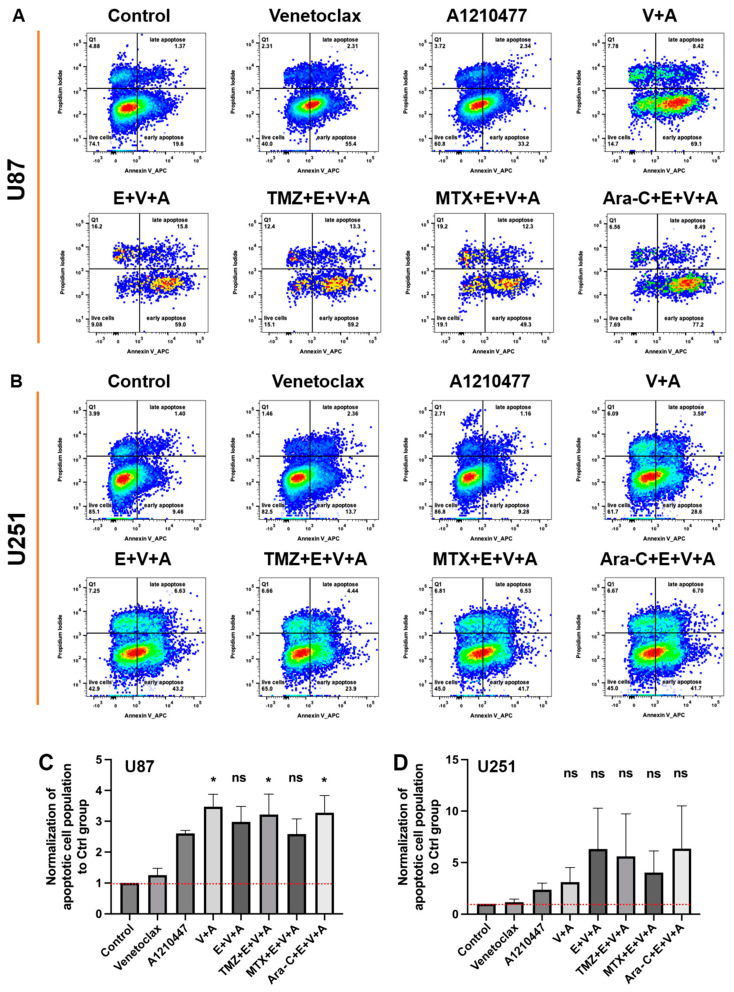
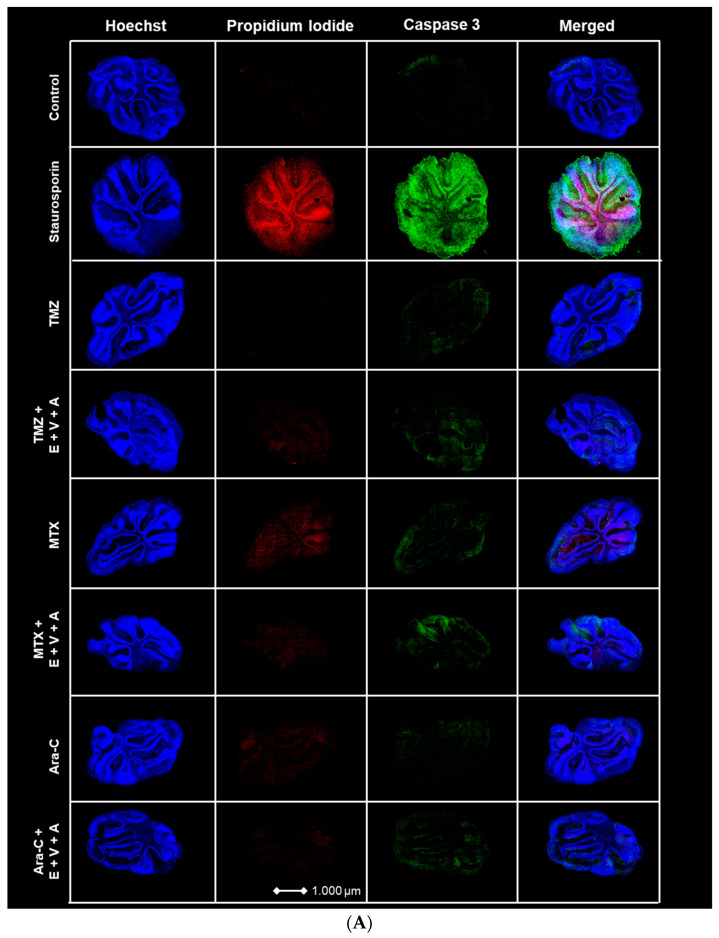
Adjuvant treatment for Glioblastoma Grade 4 with Temozolomide (TMZ) inevitably fails due to therapeutic resistance, necessitating new approaches. Apoptosis induction in GB cells is inefficient, due to an excess of anti-apoptotic XPO1/Bcl-2-family proteins. We assessed TMZ, Methotrexate (MTX), and Cytarabine (Ara-C) (apoptosis inducers) combined with XPO1/Bcl-2/Mcl-1-inhibitors (apoptosis rescue) in GB cell lines and primary GB stem-like cells (GSCs). Using CellTiter-Glo® and Caspase-3 activity assays, we generated dose-response curves and analyzed the gene and protein regulation of anti-apoptotic proteins via PCR and Western blots. Optimal drug combinations were examined for their impact on the cell cycle and apoptosis induction via FACS analysis, paralleled by the assessment of potential toxicity in healthy mouse brain slices. Ara-C and MTX proved to be 150- to 10,000-fold more potent in inducing apoptosis than TMZ. In response to inhibitors Eltanexor (XPO1; E), Venetoclax (Bcl-2; V), and A1210477 (Mcl-1; A), genes encoding for the corresponding proteins were upregulated in a compensatory manner. TMZ, MTX, and Ara-C combined with E, V, and A evidenced highly lethal effects when combined. As no significant cell death induction in mouse brain slices was observed, we conclude that this drug combination is effective in vitro and expected to have low side effects in vivo.

Keywords: Ara-C; Bcl-2; MTX; Mcl-1; SINE; TMZ; XPO1; cytarabine; eltanexor; glioblastoma; methotrexate; temozolomide; venetoclax.


Conflict of interest statement

The authors declare no conflicts of interest. The funders had no role in the design of the study, in the collection, analyses, or interpretation of data, in the writing of the manuscript, or in the decision to publish the results.

Figures

Figure 1
Figure 1
Intrinsic pathway of apoptosis exemplified in GB cells. Induced via, i.a., intrinsic stress, DNA damage, hypoxia (direct induction via TMZ, MTX, or Ara-C) [13]. Created with BioRender.com.
Figure 2
Figure 2
Histogram of the ratio of TMZ to MTX (A) and to Ara-C (B) based on IC50 values in Table 1, respectively. All cells are significantly more resistant to TMZ in comparison to MTX and Ara-C. E.g.: MTX:TMZ ≙ approx. 1:10,000 in U87; Ara-C:TMZ ≙ approx. 1:180 in GSCs.
Figure 3
Figure 3
mRNA expression of Bcl-2 (A), Mcl-1 (B), and XPO1 (C) in GB cell lines U87 and U251 and patient-derived GSCs, quantified by qPCR, with U87 cell expression normalized to 1. Data were acquired from three independent experiments performed in triplicates and are presented as mean ± SD. One-way ANOVA with consecutive post hoc test (Tukey) was used for analysis; *** p < 0.001, **** p < 0.0001, ns: not significant. The association between Bcl-2, Mcl-1, and XPO1 gene expression in GB patients and their prognostic outcomes. The expression status of Bcl-2 (D), Mcl-1 ((E); * p < 0.05), and XPO1 (F) in clinical GB tumor tissue compared to normal brains was analyzed from the TCGA and GTEx databases. The GEPIA 2 database was used to analyze OS and DFS with a median group cutoff for either high (red) or low (blue) gene expression of Bcl-2 (G,J), Mcl-1 (H,K) and XPO1 (I,L) in GB patients.
Figure 4
Figure 4
Modifications in Bcl-2, Mcl-1, and XPO1 gene expression at the transcriptional level after treatment with Venetoclax (A), A1210477 (B), and Eltanexor (C), alone or in combination (DF) in U87 and U251 cell-lines (12h of treatment) and GSCs (48h of treatment). Data are based on 3 independent experiments, utilizing qPCR for quantification. The heatmaps were generated from mean expression data. * p < 0.05; ** p < 0.01; *** p < 0.001; **** p < 0.001.
Figure 5
Figure 5
Modifications in Bcl-2, Mcl-1, and XPO1 protein level after treatment with Venetoclax (10 µM), A1210477 (10 µM), and Eltanexor (100 nM) in U87 (A) and U251 (B) cells, as well as GSCs (C). Western blot analyses depict the protein induction post-treatment with indicated drugs. Quantitative assessments of blots were obtained from three to four independent experiments relative to the control group. Data are presented as mean ± SD. One-way ANOVA with consecutive post hoc test (Tukey) was performed for statistical evaluation. * p < 0.05; ** p < 0.01; **** p < 0.001, ns: not significant.
Figure 6
Figure 6
Cell viability of combinatorial treatment with TMZ, MTX, and Ara-C and E., V., and A., assessed via CellTiter-Glo 3D. The left panel represents the quantification of cell viability for U87 cells (AD); (TMZ 750 µM, MTX 55 nM, Ara-C 8.5 µM). The middle panel (EH) represents the quantification of cell viability for U251 cells (TMZ 100 µM, MTX 30 nM, Ara-C 2.5 µM). Both cell lines have been treated with drugs for 3 or 5 days, and the concentration of E., V., and A. were the same (V. 10 µM, A. 10 µM, E. 100 nM). The right panel (IL) represents the quantification of cell viability for GSCs after 10 days of treatment (TMZ 20 µM, MTX 55 nM, Ara-C 500 nM., V. 1 µM, A. 1 µM, E. 10 nM,). Histograms are shown in relation to DMSO-control. (A,E,I) Red: comparison to control; Orange: comparison to V.; Blue: comparison to A.; Green: comparison to E.; Purple: comparison to V.+A. (BD,FH,JL) Red: comparison to chemo-drug; Orange: comparison to chemo-drug+V.; Blue: comparison to chemo-drug+A.; Green: comparison to chemo-drug+E.; Purple: comparison to chemo-drug+V.+A. Results were obtained from three independent experiments performed in triplicates, and data are presented as mean ± SD. One-way ANOVA with consecutive post hoc test (Tukey) was used to analyze; * p < 0.05; ** p < 0.01; *** p < 0.001, **** p < 0.001, ns: not significant.
Figure 6
Figure 6
Cell viability of combinatorial treatment with TMZ, MTX, and Ara-C and E., V., and A., assessed via CellTiter-Glo 3D. The left panel represents the quantification of cell viability for U87 cells (AD); (TMZ 750 µM, MTX 55 nM, Ara-C 8.5 µM). The middle panel (EH) represents the quantification of cell viability for U251 cells (TMZ 100 µM, MTX 30 nM, Ara-C 2.5 µM). Both cell lines have been treated with drugs for 3 or 5 days, and the concentration of E., V., and A. were the same (V. 10 µM, A. 10 µM, E. 100 nM). The right panel (IL) represents the quantification of cell viability for GSCs after 10 days of treatment (TMZ 20 µM, MTX 55 nM, Ara-C 500 nM., V. 1 µM, A. 1 µM, E. 10 nM,). Histograms are shown in relation to DMSO-control. (A,E,I) Red: comparison to control; Orange: comparison to V.; Blue: comparison to A.; Green: comparison to E.; Purple: comparison to V.+A. (BD,FH,JL) Red: comparison to chemo-drug; Orange: comparison to chemo-drug+V.; Blue: comparison to chemo-drug+A.; Green: comparison to chemo-drug+E.; Purple: comparison to chemo-drug+V.+A. Results were obtained from three independent experiments performed in triplicates, and data are presented as mean ± SD. One-way ANOVA with consecutive post hoc test (Tukey) was used to analyze; * p < 0.05; ** p < 0.01; *** p < 0.001, **** p < 0.001, ns: not significant.
Figure 7
Figure 7
Chemo drugs (TMZ, MTX, and Ara-C) combined with E., V., and A. induced apoptosis in U87 and U251 GB cell lines, as well as GSCs, evaluated via Caspase GLO assays for Caspase 3/7 activity. Treatments were applied for 24 h in U87 (AD) and U251 cells (EH), and 48h in GSCs (IL), consistent with Figure 6. (A,E,I) Red: comparison to control; Orange: comparison to V.; Blue: comparison to A.; Green: comparison to E.; Purple: comparison to V.+A. (BD,FH,JL) Red: comparison to chemo-drug; Orange: comparison to chemo-drug+V.; Blue: comparison to chemo-drug+A.; Green: comparison to chemo-drug+E.; Purple: comparison to chemo-drug+V.+A. Results were obtained from three independent experiments, data are presented as mean ± SD. One-way ANOVA with consecutive post hoc test (Tukey) was used to analyze; * p < 0.05; ** p < 0.01; *** p < 0.001, **** p < 0.001, ns: not significant.
Figure 7
Figure 7
Chemo drugs (TMZ, MTX, and Ara-C) combined with E., V., and A. induced apoptosis in U87 and U251 GB cell lines, as well as GSCs, evaluated via Caspase GLO assays for Caspase 3/7 activity. Treatments were applied for 24 h in U87 (AD) and U251 cells (EH), and 48h in GSCs (IL), consistent with Figure 6. (A,E,I) Red: comparison to control; Orange: comparison to V.; Blue: comparison to A.; Green: comparison to E.; Purple: comparison to V.+A. (BD,FH,JL) Red: comparison to chemo-drug; Orange: comparison to chemo-drug+V.; Blue: comparison to chemo-drug+A.; Green: comparison to chemo-drug+E.; Purple: comparison to chemo-drug+V.+A. Results were obtained from three independent experiments, data are presented as mean ± SD. One-way ANOVA with consecutive post hoc test (Tukey) was used to analyze; * p < 0.05; ** p < 0.01; *** p < 0.001, **** p < 0.001, ns: not significant.
Figure 8
Figure 8
Cell cycle analysis was conducted using flow cytometry after propidium iodide staining, with cells treated as described in Figure 6 for 24 h. Pie charts depict the distribution across cell cycle phases (G1, S, G2) in U87 (A) and U251 (B) cells. Data shown are based on one representative experiment of three independent replications.
Figure 9
Figure 9
Apoptosis in U87 (A) and U251 (B) cells was assessed post-treatment with Venetoclax, A1210477 (individually as well as combined), and chemotherapeutic drugs TMZ, MTX, and Ara-C combined with E.+V.+A., using the same concentrations as in Figure 6 for 24 h, via FACS analysis of Annexin V stainings. Quantitative analysis of Annexin V staining from three independent experiments post-treatment in U87 (C) and U251 (D) cells is presented as mean ± SEM. One-way ANOVA with consecutive post hoc test (Tukey) was used to analyze the data; * p < 0.05; ns: not significant.
Figure 10
Figure 10
(A) Apoptosis and dead cell staining of brain slice culture with propidium iodide (dead cells; red), and Caspase 3 (apoptotic cells; green) post-treatment with either TMZ, MTX, and Ara-C and in combination with E.+V.+A. Staining with Hoechst indicates cell nuclei (blue). The left panel consists of merged images from Hoechst-, PI-, and Caspase 3 staining. Staurosporine was used as positive control for induction of apoptosis. (B) Quantification of morphological image data from Figure 10A. Dotted red line indicates the threshold of the control group. Staurosporine was used for positive control. Numbers of PI+ cells/mm2 are shown in logarithmic scale. One cerebellar slice per treatment was analyzed.
Figure 10
Figure 10
(A) Apoptosis and dead cell staining of brain slice culture with propidium iodide (dead cells; red), and Caspase 3 (apoptotic cells; green) post-treatment with either TMZ, MTX, and Ara-C and in combination with E.+V.+A. Staining with Hoechst indicates cell nuclei (blue). The left panel consists of merged images from Hoechst-, PI-, and Caspase 3 staining. Staurosporine was used as positive control for induction of apoptosis. (B) Quantification of morphological image data from Figure 10A. Dotted red line indicates the threshold of the control group. Staurosporine was used for positive control. Numbers of PI+ cells/mm2 are shown in logarithmic scale. One cerebellar slice per treatment was analyzed.

Similar articles

Cited by

References

    1. Goodenberger M.L., Jenkins R.B. Genetics of adult glioma. Cancer Genet. 2012;205:613–621. doi: 10.1016/j.cancergen.2012.10.009. - DOI - PubMed
    1. King J.L., Benhabbour S.R. Glioblastoma Multiforme-A Look at the Past and a Glance at the Future. Pharmaceutics. 2021;13:1053. doi: 10.3390/pharmaceutics13071053. - DOI - PMC - PubMed
    1. Helseth R., Helseth E., Johannesen T.B., Langberg C.W., Lote K., Rønning P., Scheie D., Vik A., Meling T.R. Overall survival, prognostic factors, and repeated surgery in a consecutive series of 516 patients with glioblastoma multiforme. Acta Neurol. Scand. 2010;122:159–167. doi: 10.1111/j.1600-0404.2010.01350.x. - DOI - PubMed
    1. Mohammed S., Dinesan M., Ajayakumar T. Survival and quality of life analysis in glioblastoma multiforme with adjuvant chemoradiotherapy: A retrospective study. Rep. Pract. Oncol. Radiother. 2022;27:1026–1036. doi: 10.5603/RPOR.a2022.0113. - DOI - PMC - PubMed
    1. Ohgaki H. Epidemiology of brain tumors. Methods Mol. Biol. 2009;472:323–342. doi: 10.1007/978-1-60327-492-0_14. - DOI - PubMed

Publication types