. 2024 Apr 5;13(7):637.
doi: 10.3390/cells13070637.

GDF-15 Suppresses Puromycin Aminonucleoside-Induced Podocyte Injury by Reducing Endoplasmic Reticulum Stress and Glomerular Inflammation

Affiliations

GDF-15 Suppresses Puromycin Aminonucleoside-Induced Podocyte Injury by Reducing Endoplasmic Reticulum Stress and Glomerular Inflammation

Ekaterina von Rauchhaupt et al. Cells. .

Abstract

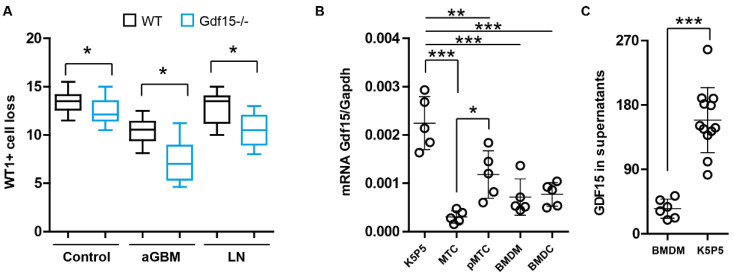
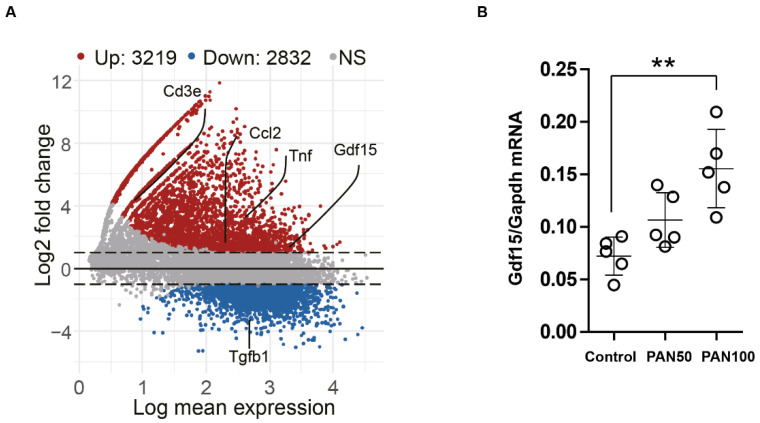
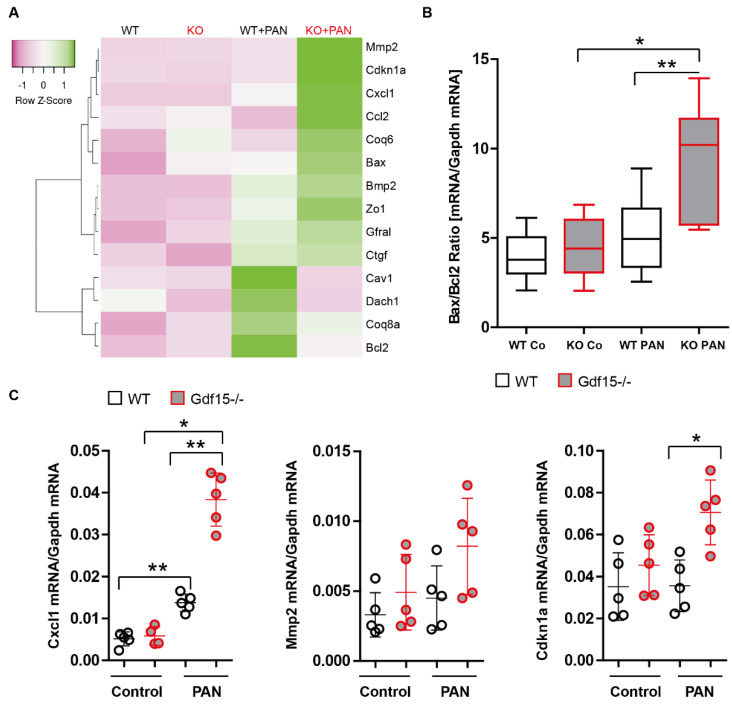
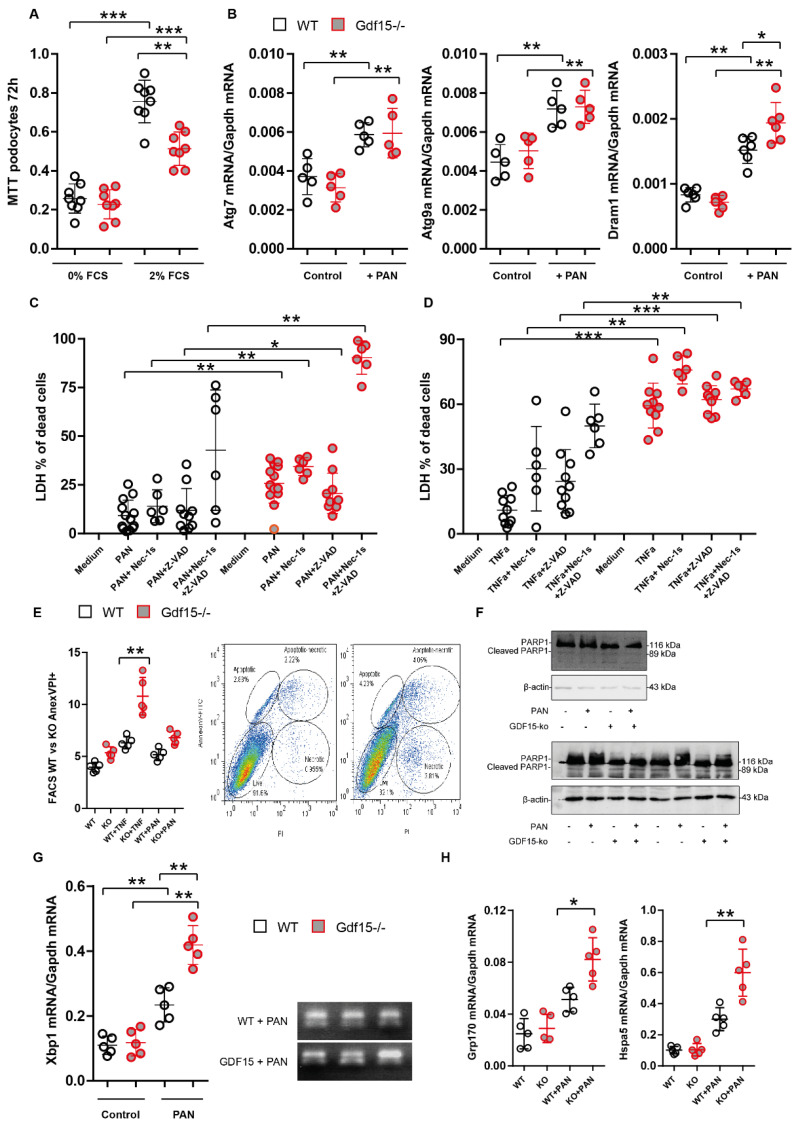
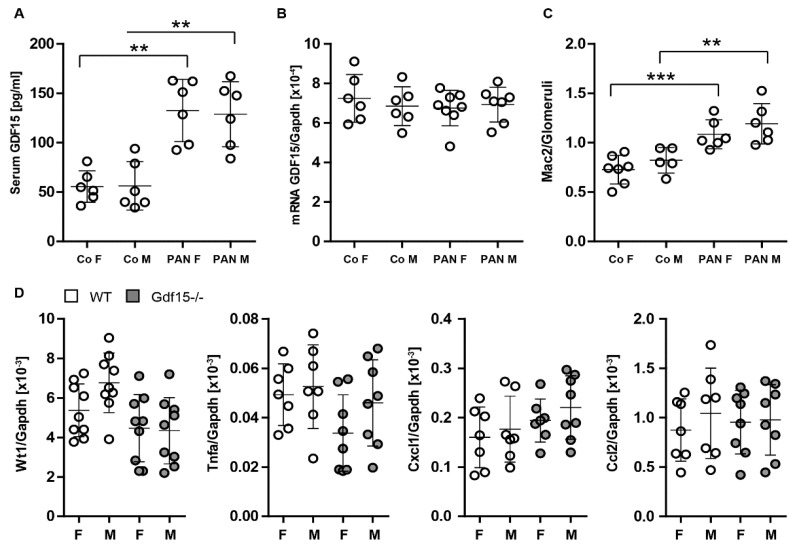
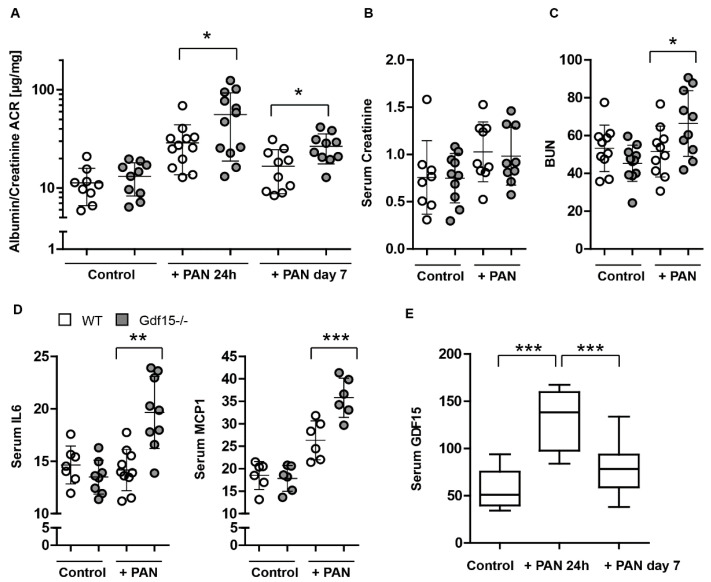
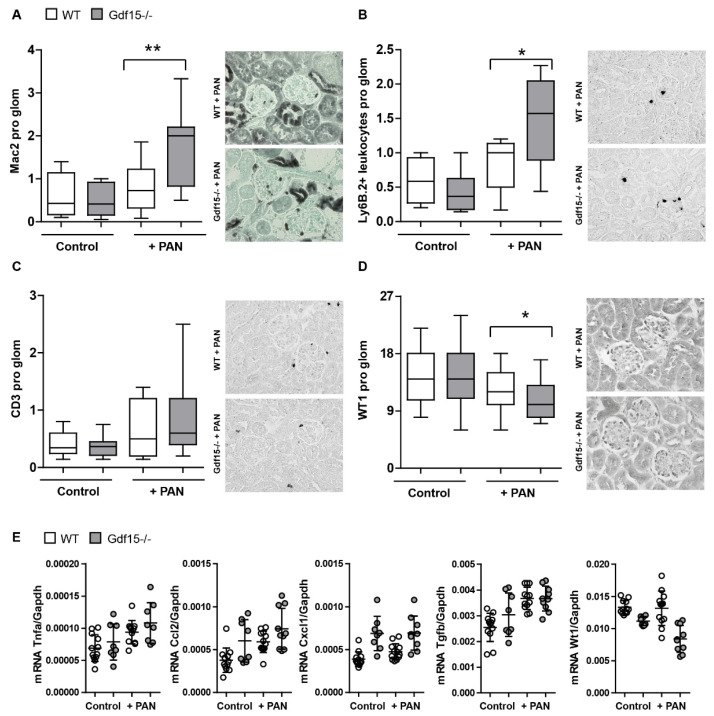
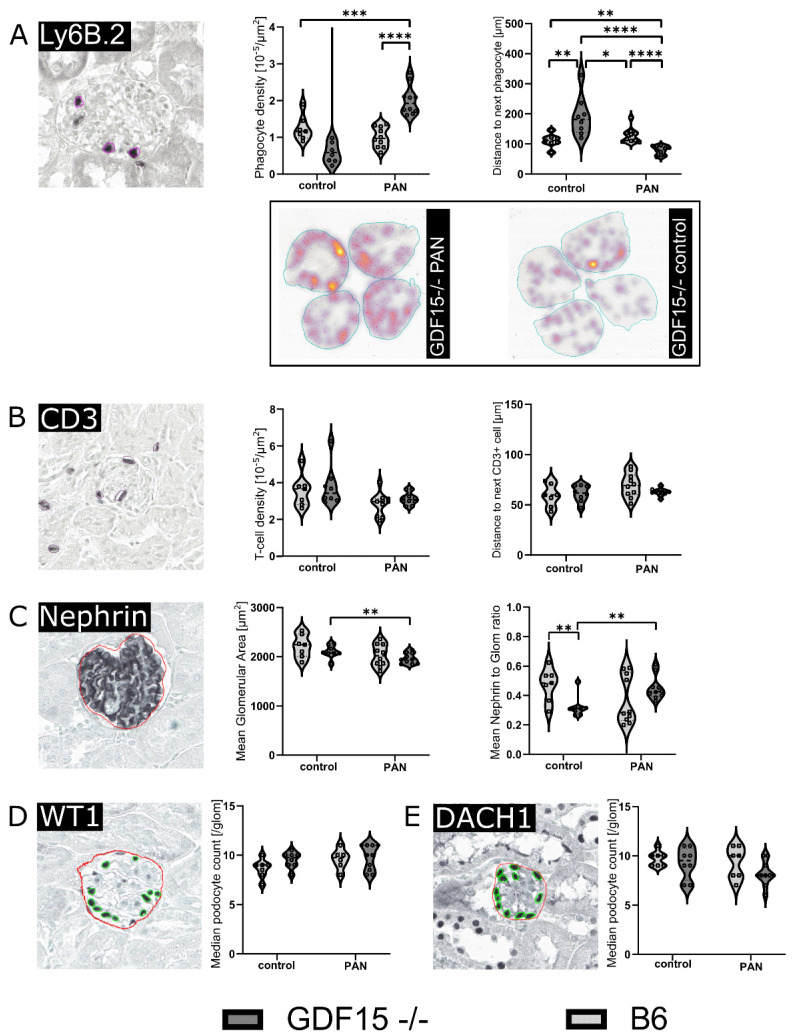
GDF15, also known as MIC1, is a member of the TGF-beta superfamily. Previous studies reported elevated serum levels of GDF15 in patients with kidney disorder, and its association with kidney disease progression, while other studies identified GDF15 to have protective effects. To investigate the potential protective role of GDF15 on podocytes, we first performed in vitro studies using a Gdf15-deficient podocyte cell line. The lack of GDF15 intensified puromycin aminonucleoside (PAN)-triggered endoplasmic reticulum stress and induced cell death in cultivated podocytes. This was evidenced by elevated expressions of Xbp1 and ER-associated chaperones, alongside AnnexinV/PI staining and LDH release. Additionally, we subjected mice to nephrotoxic PAN treatment. Our observations revealed a noteworthy increase in both GDF15 expression and secretion subsequent to PAN administration. Gdf15 knockout mice displayed a moderate loss of WT1+ cells (podocytes) in the glomeruli compared to wild-type controls. However, this finding could not be substantiated through digital evaluation. The parameters of kidney function, including serum BUN, creatinine, and albumin-creatinine ratio (ACR), were increased in Gdf15 knockout mice as compared to wild-type mice upon PAN treatment. This was associated with an increase in the number of glomerular macrophages, neutrophils, inflammatory cytokines, and chemokines in Gdf15-deficient mice. In summary, our findings unveil a novel renoprotective effect of GDF15 during kidney injury and inflammation by promoting podocyte survival and regulating endoplasmic reticulum stress in podocytes, and, subsequently, the infiltration of inflammatory cells via paracrine effects on surrounding glomerular cells.

Keywords: GDF15; endoplasmic reticulum stress; glomerular inflammation; podocytes; podocytopathies.


Conflict of interest statement

The authors declare no conflicts of interest. The funders had no role in the design of the study; in the collection, analyses, or interpretation of data; in the writing of the manuscript; or in the decision to publish the results.

Figures

Figure 1
Figure 1
GDF15 expression in podocytes and their loss during kidney injury. (A): Kidneys of 6-month-old C57BL/6 and Gdf15-/- female mice (control), C57BL/6lpr and Gdf15-/-lpr (LN, lupus nephritis), and anti-glomerular basement membrane (anti-GBM) glomerulonephritis model were stained with antibodies against WT1 and pathological changes and the number of WT1+ cells (podocytes) quantified. Data are shown as box–whiskers plots or mean ± SD; * p < 0.05. (B): We isolated total RNA from various cell types such as podocytes (K5P5 cell line), mouse renal proximal tubular epithelial cells (MTCs, also known as MRPTEpiC), primary mouse renal tubular cells (pMTCs), bone-marrow-derived macrophages (BMDMs), and bone-marrow-derived dendritic cells (BMDCs) for qPCR analysis of Gdf15 transcript. Data are presented as mean ± SD; * p < 0.05; ** p < 0.01; and *** p < 0.001. (C): GDF15 protein levels were determined in BMDMs and K5P5 podocytes supernatants using ELISA. Data are presented as mean ± SD; *** p < 0.001.
Figure 2
Figure 2
PAN induce Gdf15 expression in podocytes. (A): MA plots were created to display the shrink log2-fold change of genes for PAN-induced podocytes injury. Genes with differential expression and an adjusted p-value lower than 0.05 are identified by the colors red (high expression in PAN group) or blue. (B): Total mRNA of Gfd15 from K5P5 podocytes stimulated with 50 or 100 µg/mL PAN for 24 h were analyzed with qPCR analysis. Data are presented as mean ± SD; ** p < 0.01.
Figure 3
Figure 3
GDF15 controls the activation of podocytes upon PAN stimulation. We generated a knockout of GDF15 in podocytes using CRISPR/Cas9 technology. The specific gRNA was designed based on the DNA sequence of mouse Gdf15 gene. The gRNA guide Cas9 cuts exon1 and disrupts the function of GDF15. Single cells were selected with cell sorting (GFP+). RT-PCR screening of single clones identified several KO clones. (A): GDF15 knockout or control (empty vector) cells were incubated for 18 h in the presence of 50 µg/mL of PAN. Total RNA was collected to quantify the gene expression levels by RT-PCR. Single clone RT-PCR results are presented in form of a heatmap. A heatmap shows altered genes from expression analysis of pre-selected transcripts. Genes indicated in green are upregulated and genes indicated in pink are downregulated to highlight differences between the samples. The rows are Z-Score scaled. The information about a single gene expression across the samples (controls and PAN) is given but the expression levels of gene X to gene Y cannot be concluded. Several genes that displayed significantly different expression between genotypes in the preliminary experiment were selected for real-time RT-qPCR validation. (B) Bax/Bcl2 (n > 6 per group) and (C) Cxcl1, Mmp2, and Cdkn1. Data are presented as mean ± SD; * p < 0.05; ** p < 0.01.
Figure 4
Figure 4
GDF15 protects from cell stress and cell death. (A): The metabolic activity of podocytes in the presence or absence of 2% FCS was evaluated by MTT assay after 72 h. The graphs represent a representative experiment (from three independent experiments) performed in a single run. (B): RNA was isolated from podocytes for RT-PCR analysis of autophagy-related genes. (C): Podocytes were untreated or exposed to PAN in the presence or absence of various cell death inhibitors for 24 h. Viability was evaluated by LDH assay. (D): Podocytes were untreated or exposed to TNFα and various cell death inhibitors for 24 h. Viability was evaluated by LDH assay. (E): Representative images of flow cytometry using Annexin V-FITC and PI double-stained cells. Cell apoptosis rates upon 50 µg/mL PAN and 500 ng/mL TNFα are presented as mean ± SD for at least three independent samples. The image of flow cytometry reading serves as a representation of the flow cytometry data and visualize the distribution of cells. (F): Protein expression levels of PARP1 protein forms were detected using Western blot analysis. (G): RNA was isolated from wild-type and knockout podocytes for RT-PCR analysis of Xbp1 spliced version. Data are presented as mean ± SD; * p < 0.05; ** p < 0.01; and *** p < 0.001. (H): RNA was isolated from wild-type and knockout podocytes for RT-PCR analysis of Xbp1-dependent ER chaperones. Data are presented as mean ± SD; * p < 0.05; and ** p < 0.01.
Figure 5
Figure 5
GDF15 expression in female (F) and male (M) mice during kidney injury. (A): We analyzed serum to quantify the levels of GDF15 protein. GDF15 serum protein (A) and Gdf15 kidney transcript (B) signatures did not differ in the male and female samples. (C): Kidneys of C57BL/6 male and female mice were stained with antibodies against Mac2; (D): RNA was isolated from C57BL/6 mice. Real-time PCR analysis represents relative expression of indicated genes. Data are presented as means ± SD; ** p < 0.01 *** p < 0.001.
Figure 6
Figure 6
GDF15 protects mice from PAN-induced kidney injury. (AC): Kidney function parameters including albumin/creatinine ratio ACR (A) were measured in the serum from 6-week-old WT and Gdf15-deficient mice 24 h and 7 days after PAN injection. Serum creatinine (B) and BUN (C) were measured in the serum from 6-week-old WT and Gdf15-deficient mice 7 days after PAN injection. (D): Serum IL-6 and MCP1 concentrations were measured on day 7 by ELISA. (E): GDF15 concentrations were measured after 24 h and on day 7 by ELISA. Data are presented as mean ± SD; * p < 0.05; ** p < 0.01; and *** p < 0.001.
Figure 7
Figure 7
GDF15 reduces glomerular immune cell infiltration in PAN-induced kidney injury in mice. (A): Kidney sections from control and Gdf15-deficient mice were stained for (A) Mac-1+ glomerular macrophages, (B) Ly6B.2+ leukocytes, and (C) CD3+ T cells. The number of infiltrating cells was assessed in at least 20 glomeruli per kidney (n = 10 animals per group). (D): Kidneys were stained with the antibody against WT1. Podocytes were quantified by counting. The number of WT1+ cells (podocytes) was assessed in at least 20 glomeruli per kidney (n = 10 animals per group). Data are shown as box–whiskers plots ± SD. * p < 0.05, ** p < 0.01. (E): Relative mRNA expression of indicated genes from renal cortex were tested by RT-PCR.
Figure 8
Figure 8
Deep-learning-assisted whole-slide kidney morphometry. Single-cell and glomerular analysis using Ly6B.2, CD3, Nephrin, and WT1 immunohistochemistry staining. (A): Leukocytes (Ly6B.2+ cells) invade the whole kidney in Gdf15-deficient mice after PAN-induced injury indicated by leukocyte density and distribution analysis. Representative whole-slide neutrophil heatmap images of Gdf15-/- mice with PAN treatment and no treatment (control) are shown. (B): Kidney sections from Gdf15-deficient (n = 7–10 as indicated by dots within the violin diagram) and WT (n = 7–10 as indicated by dots within the violin diagram) mice with and without (control) PAN injection were stained for CD3 and the CD3+ T-cell abundance and distribution quantified. (CE): Mean glomerular area (framed) and mean nephrin to glom ratio (C), mean WT1+ podocyte (D), and DACH1+ podocyte numbers (E) in the glomerulus were analyzed. Morphometric results were obtained using a deep-learning-assisted segmentation approach in whole-slide images. Data are shown as violin-plots ± SD. * p < 0.05, ** p < 0.01, *** p < 0.001, and **** p < 0.0001. Each dot represents one representative kidney slide of one animal.

Similar articles

Cited by

References

    1. Vivarelli M., Massella L., Ruggiero B., Emma F. Minimal Change Disease. Clin. J. Am. Soc. Nephrol. 2017;12:332–345. doi: 10.2215/CJN.05000516. - DOI - PMC - PubMed
    1. Kopp J.B., Anders H.-J., Susztak K., Podestà M.A., Remuzzi G., Hildebrandt F., Romagnani P. Podocytopathies. Nat. Rev. Dis. Primers. 2020;6:68. doi: 10.1038/s41572-020-0196-7. - DOI - PMC - PubMed
    1. Singh L., Singh G., Dinda A.K. Understanding Podocytopathy and Its Relevance to Clinical Nephrology. Indian J. Nephrol. 2015;25:1–7. doi: 10.4103/0971-4065.134531. - DOI - PMC - PubMed
    1. Sieber J., Lindenmeyer M.T., Kampe K., Campbell K.N., Cohen C.D., Hopfer H., Mundel P., Jehle A.W. Regulation of Podocyte Survival and Endoplasmic Reticulum Stress by Fatty Acids. Am. J. Physiol. Ren. Physiol. 2010;299:F821–F829. doi: 10.1152/ajprenal.00196.2010. - DOI - PMC - PubMed
    1. Inagi R., Nangaku M., Onogi H., Ueyama H., Kitao Y., Nakazato K., Ogawa S., Kurokawa K., Couser W.G., Miyata T. Involvement of Endoplasmic Reticulum (ER) Stress in Podocyte Injury Induced by Excessive Protein Accumulation. Kidney Int. 2005;68:2639–2650. doi: 10.1111/j.1523-1755.2005.00736.x. - DOI - PubMed

Publication types