. 2024 Apr 5;13(7):640.
doi: 10.3390/cells13070640.

ZO-1 Regulates Hippo-Independent YAP Activity and Cell Proliferation via a GEF-H1- and TBK1-Regulated Signalling Network

Affiliations

ZO-1 Regulates Hippo-Independent YAP Activity and Cell Proliferation via a GEF-H1- and TBK1-Regulated Signalling Network

Alexis J Haas et al. Cells. .

Abstract

Tight junctions are a barrier-forming cell-cell adhesion complex and have been proposed to regulate cell proliferation. However, the underlying mechanisms are not well understood. Here, we used cells deficient in the junction scaffold ZO-1 alone or together with its paralog ZO-2, which disrupts the junctional barrier. We found that ZO-1 knockout increased cell proliferation, induced loss of cell density-dependent proliferation control, and promoted apoptosis and necrosis. These phenotypes were enhanced by double ZO-1/ZO-2 knockout. Increased proliferation was dependent on two transcriptional regulators: YAP and ZONAB. ZO-1 knockout stimulated YAP nuclear translocation and activity without changes in Hippo-dependent phosphorylation. Knockout promoted TANK-binding kinase 1 (TBK1) activation and increased expression of the RhoA activator GEF-H1. Knockdown of ZO-3, another paralog interacting with ZO1, was sufficient to induce GEF-H1 expression and YAP activity. GEF-H1, TBK1, and mechanotransduction at focal adhesions were found to cooperate to activate YAP/TEAD in ZO-1-deficient cells. Thus, ZO-1 controled cell proliferation and Hippo-independent YAP activity by activating a GEF-H1- and TBK1-regulated mechanosensitive signalling network.

Keywords: GEF-H1; TBK1; YAP; ZO-3; ZONAB; cytoskeleton; focal adhesions; myosin; tight junctions; transcription.


Conflict of interest statement

The authors declare no conflicts of interest.

Figures
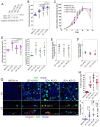
Figure 1
Figure 1
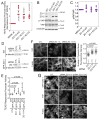
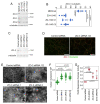
ZO-1 knockout induces cell proliferation and cell death. (A) Expression of ZO-1, ZO-2, and α-tubulin in control and knockout MDCK cells. (B) Cell proliferation was analysed in control and knockout MDCK cells by measuring cell numbers. Shown are values derived from day 6 of proliferation assays. (C) Control and knockout MDCK cells were grown over 11 days and cell numbers were analysed at the indicated timepoints. (D) Necrosis and apoptosis were measured in control and knockout MDCK cells as indicated. Shown are values derived from day 6 of proliferation assays. (E) Cyclin D1 promoter activity was measured by reporter gene assay. (F) Transcriptional activity of β-catenin/TCF was analysed by reporter gene assay. (GI) Cells grown on filters for 6 days after confluence were immunostained for cingulin and Ki67, and nuclei were labelled with Hoechst dye. Confocal xy (G, top panel) and xz (G, lower panel) sections were acquired. The percentage of Ki67-positive cells (H) and mitotic indexes (I) were determined from xy sections. Quantifications show individual determinations, averages, standard deviations, and p-values derived from two-tailed t-tests comparing the knockout to wild-type cells. Magnification bars, 20 µm.
Figure 2
Figure 2
ZO-1 knockout stimulates YAP activation. (A) Wild-type (wt) and knockout MDCK cells were assayed for YAP/TEAD activity with a TEAD reporter gene assay. (B) Expression of ZO-1, ZO-2, YAP, α-tubulin, and levels of YAP phosphorylation were analysed by immunoblotting in wild-type and knockout MDCK cells. (C) Densitometry was used to quantify the ratio of phosphorylated YAP divided by total YAP as a measure for YAP phosphorylation. (DG) Transfection of two different canine ZO-1-specific siRNAs (siRNA ZO-1 A and siRNA ZO-1 C) into wild-type and mouse GFP-tagged ZO-1 MDCK cells, followed by analysis through immunoblotting (D), TEAD reporter gene assay (E) or immunofluorescence with antibodies specific for YAP (F, wild-type MDCK cells; G, mouse GFP-ZO-1-expressing MDCK cells). The graph in panel F shows nuclear-to-cytosolic YAP measured in individual cells treated with ZO-1-specific siRNAs. Quantifications show individual determinations, averages, standard deviations, and p-values derived from two-tailed t-tests comparing the knockout to wild-type cells (A) or comparing control with ZO-1 siRNAs (E). The graph in panel (F) shows individual cells analysed, medians, interquartile ranges, and p-values derived from Wilcoxon tests. Magnification bars, 20 µm.
Figure 3
Figure 3
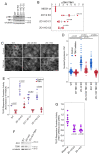
TBK1 promotes YAP activation. (A,B) Phosphorylation of TBK1 as a measure for its activation state was measured by immunoblotting. Immunoblots were analysed by densitometry followed by calculating ratios of phosphorylated/total TBK1. Values were normalized to wild-type MDCK cells. Shown are individual determinations, means, standard, and p-values derived from t-tests comparing to a test mean of 1. (C,D) Nuclear accumulation of YAP was visualized by immunofluorescence and quantified by measuring nuclear-to-cytoplasmic ratios. Shown are data points reflecting individual cells, medians, and interquartile ranges, and p-values derived from Steel–Dwass tests. (E) TEAD-responsive reporter gene assays were performed in control and knockout MDCK cells either treated with solvent or a TBK1 inhibitor. Shown are individual determinations, standard deviations, and p-values derived from t-tests comparing the indicated data pairs. (F) Knockdown of TBK1 in ZO-1 knockout MDCK cells was analysed by immunoblotting. (G) TEAD-responsive reporter gene assays were performed in control and knockout MDCK cells either treated with control or TBK1 siRNAs, and ratios were calculated. Shown are individual determinations, means, standard deviations, and p-values derived from t-tests comparing the indicated datasets to a test mean of 1. Magnification bar, 20 µm.
Figure 4
Figure 4
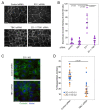
Depletion of TBK1 in ZO-1-deficient cells promotes TJ formation. (A,B) MDCK cells were transfected with siRNAs as in Figure 2G. The cells were then plated on Matrigel-coated coverslips and fixed processed for immunofluorescence after 2 days. Shown is staining for occludin. Panel (B) shows a quantification of TJ formation based on discontinuities in the occludin staining. Data points reflect images that were derived from two independent experiments (shown are also medians and interquartile ranges; p-values derived from Wilcoxon tests of the indicated data pairs). (C,D) ZO-1 KO cells were transfected with TBK1 siRNA and then plated, fixed, and processed as the cells in panel A. Shown is staining for occludin (green) and nuclei (blue). As occludin staining is weaker and discontinuous in ZO-1 KO cells, TJ formation was quantified by counting absent and present junctional segments. Shown are data derived from the two ZO-1 KO clones (blue dots, clone 1; orange dots, clone 2) and median and interquartile ranges for the pooled data (data points are derived from images collected from two independent experiments for each clone; p-values derived from Wilcoxon tests). Magnification bars, 20 µm.
Figure 5
Figure 5
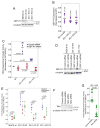
ZO-1 knockout induces GEF-H1 expression. (A,B) Wild-type and knockout MDCK cells were analysed by immunoblotting, and GEF-H1 expression was quantified using densitometry. (C,D) Cells were transfected with control or GEF-H1-targeting siRNAs and then analysed by TEAD reporter gene assay (C) or immunoblotting (D). (E) Control and knockout MDCK cells were treated for 16 h with inhibitors of myosin (Blebbistatin) or Arp2/3 (CK666) prior to analysis by TEAD reporter gene assay. (F,G) MDCK cells were transfected with control or talin targeting siRNAs and then analysed by immunoblotting (F) or TEAD reporter gene assay (G). Quantifications show individual determinations, averages, standard deviations, and p-values derived from two-tailed t-tests comparing the knockdowns to a theoretical mean of 1 (A) or the indicated data pairs (C,E,G).
Figure 6
Figure 6
ZO-1 knockout-induced cell proliferation is YAP-, ZONAB-, and GEF-H1-dependent. Wild-type and knockout cell lines were transfected with the indicated siRNAs and then analysed by immunoblotting (A,C), by measuring cell numbers ((B), 6 days of proliferation), with a TEAD-responsive (D) or ZONAB-responsive (E) promoter assay. In panel B, values from wildtype cells are shown in blue, values from ZO-1/2 KO cells in red, and values from ZO-1 KO cells in green. Panels D and E show results obtained from ZO-1 KO cells normalized to control siRNA-transfected wild-type MDCK cells. Note that ZONAB functions as a transcriptional repressor in this assay; hence, reduced values indicate activation and increased values indicate the inhibition of ZONAB. Quantifications show individual determinations, averages, standard deviations, and p-values derived from two-tailed t-tests comparing the indicated pairs (if no paring is indicated, the p-value is for a comparison between the respective knockdown with control siRNA values of the same cell line).
Figure 7
Figure 7
ZO-1 knockout reduces ZO-3 and ZO-3 depletion stimulates YAP. (A,B) Wild-type and knockout MDCK cells analysed by immunoblotting followed by densitometry for expression of ZO-3. Shown are individual determinations, means, standard deviations, and p-values derived from two-tailed t-tests comparing the knockout cell lines with wild-type cells. (CG) MDCK cells were transfected with control or ZO-3-specific siRNAs as indicated and were then analysed by immunoblotting (C), immunofluorescence for the two TJ proteins ZO-1 and occludin (D), and immunofluorescence of YAP (E,F); quantification shows individual cells analysed, medians, interquartile ranges, and p-values from Wilcoxon tests, as well as the TEAD-responsive promoter assay (G); shown are individual determinations, means, standard deviations, and p-values from t-tests comparing knockdown to the control siRNAs. Magnification bars, 20 µm.
Figure 8
Figure 8
Depletion of ZO-3 stimulates GEF-H1 expression and phosphorylation of MLC2. MDCK cells were transfected with control or ZO-3 siRNAs (if not indicated, a pool of ZO-3 siRNAs was used) and then analysed by immunoblotting to determine GEF-H1 expression levels (A,B); shown are individual determinations, medians, interquartile ranges, and p-values derived from a signed-rank test, compared with a test median of 1, by immunoblotting to measure MLC2 phosphorylation (C,D); shown are individual determinations, means, standard deviations, and p-values derived from t-tests comparing knockdown to control siRNA datasets or immunofluorescence to visualize the distribution of phosphorylated MLC2 (E); shown are images from focal planes along the base of the cells showing the increase in basal actomyosin, or by immunoblotting as indicated (F). (G,H) Ratios of phosphorylated to total YAP (G) and TBK1 (H) were determined by densitometry of immunoblots. Shown are individual data points, means, and standard deviations. No statistically significant differences were observed by t-tests. Magnification bars, 20 µm.

References

    1. Venhuizen J.H., Jacobs F.J.C., Span P.N., Zegers M.M. P120 and E-cadherin: Double-edged swords in tumor metastasis. Semin. Cancer Biol. 2020;60:107–120. doi: 10.1016/j.semcancer.2019.07.020. - DOI - PubMed
    1. McCrea P.D., Gottardi C.J. Beyond beta-catenin: Prospects for a larger catenin network in the nucleus. Nat. Rev. Mol. Cell Biol. 2016;17:55–64. doi: 10.1038/nrm.2015.3. - DOI - PMC - PubMed
    1. Balda M.S., Matter K. Tight junctions. Curr. Biol. 2023;33:R1135–R1140. doi: 10.1016/j.cub.2023.09.027. - DOI - PubMed
    1. Balda M.S., Matter K. The tight junction protein ZO-1 and an interacting transcription factor regulate ErbB-2 expression. EMBO J. 2000;19:2024–2033. doi: 10.1093/emboj/19.9.2024. - DOI - PMC - PubMed
    1. Balda M.S., Garrett M.D., Matter K. The ZO-1–associated Y-box factor ZONAB regulates epithelial cell proliferation and cell density. J. Cell Biol. 2003;160:423–432. doi: 10.1083/jcb.200210020. - DOI - PMC - PubMed

Publication types

Substances

LinkOut - more resources