. 2024 Jun 3;221(6):e20221988.
doi: 10.1084/jem.20221988. Epub 2024 Apr 12.

Self-regulating CAR-T cells modulate cytokine release syndrome in adoptive T-cell therapy

Affiliations

Self-regulating CAR-T cells modulate cytokine release syndrome in adoptive T-cell therapy

Meng-Yin Lin et al. J Exp Med. .

Abstract

Cytokine release syndrome (CRS) is a frequently observed side effect of chimeric antigen receptor (CAR)-T cell therapy. Here, we report self-regulating T cells that reduce CRS severity by secreting inhibitors of cytokines associated with CRS. With a humanized NSG-SGM3 mouse model, we show reduced CRS-related toxicity in mice treated with CAR-T cells secreting tocilizumab-derived single-chain variable fragment (Toci), yielding a safety profile superior to that of single-dose systemic tocilizumab administration. Unexpectedly, Toci-secreting CD19 CAR-T cells exhibit superior in vivo antitumor efficacy compared with conventional CD19 CAR-T cells. scRNA-seq analysis of immune cells recovered from tumor-bearing humanized mice revealed treatment with Toci-secreting CD19 CAR-T cells enriches for cytotoxic T cells while retaining memory T-cell phenotype, suggesting Toci secretion not only reduces toxicity but also significantly alters the overall T-cell composition. This approach of engineering T cells to self-regulate inflammatory cytokine production is a clinically compatible strategy with the potential to simultaneously enhance safety and efficacy of CAR-T cell therapy for cancer.


Conflict of interest statement

Disclosures: M.-Y. Lin and Y.Y. Chen are inventors of a patent (US 11,701,384) whose value may be affected by the publication of this work. Y.Y. Chen holds several patent applications in the area of CAR-T cell therapy. Y.Y. Chen is a founder of, holds equity in, and receives consulting fees from ImmPACT Bio. Y.Y. Chen is a member of the scientific advisory board of and holds equity in Catamaran Bio, Notch Therapeutics, Pluto Immunotherapeutics, Prime Medicine, Sonoma Biotherapeutics, and Waypoint Bio. No other disclosures were reported.

Figures

Figure 1.
Figure 1.
T cells can be engineered to modulate cytokine signaling. (A and B) Schematic of CRS regulation by CAR-T cells engineered to secrete cytokine modulators. Generated with BioRender. (A) Uncontrolled CAR-T cell activation may lead to immune overstimulation and result in CRS. (B) Self-regulating CAR-T cells secrete scFvs or antagonist proteins that block cytokine signaling, thus preventing immune overstimulation. (C–G) Cytokine- and cytokine-receptor–binding scFvs bind their intended targets. (C) Toci blocks IL-6–induced STAT3 signaling in primary human CD4+ T cells. T cells were coincubated with Toci for 3 h and then treated with or without 4 ng/ml human IL-6 protein for 30 min. Cell lysates were analyzed by western blot and probed for phosphorylated STAT3 (pSTAT3) and GAPDH. (D) Toci inhibits IL-6 signaling in IL-6 reporter HEK-Blue cells. IL-6 reporter HEK-Blue cells transfected with plasmids encoding the transduction marker EGFRt orToci were stimulated with the indicated concentration of IL-6 for 24 h. The amount of STAT3-induced SEAP secretion by the HEK-Blue cells was quantified by spectrophotometer. Triplicate wells were separately seeded, transfected, stimulated with IL-6, and quantified. Statistical significance was determined by two-way ANOVA corrected for multiple comparisons using Tukey’s method. (E) Adalimumab- and certolizumab-based scFvs block TNF-α–induced NF-κB signaling. NFκB-EGFP reporter Jurkat cells were incubated with indicated concentrations of TNF-α scFvs overnight before stimulation with 10 ng/ml of TNF-α. EGFP expression induced by NFκB signaling was quantified by flow cytometry, with percent EGFP+ and EGFP MFI shown. Triplicate wells were seeded, treated with the indicated scFvs, and quantified. Statistical significance was determined by two-tailed Student’s t tests comparing each condition against the “TNF-α only” control with correction for multiple comparisons using the two-stage step-up procedure by Benjamini, Krieger, and Yekutieli for false discovery rate < 1.00%. (F and G) Adalimumab- and certolizumab-based scFvs block TNF-α binding (F) and emapalumab-based scFv blocks IFN-γ binding (G). CD19 CAR-T cells were cocultured with Raji cells and donor-matched immune cells (monocytes, macrophages, and dendritic cells) to stimulate cytokine secretion. Addition of scFvs concentrated from HEK293T supernatant binds specific cytokines and blocks their detection by Cytometric Bead Array assay. Triplicate wells were separately seeded, treated with scFvs, and quantified. Pairwise comparisons against the no-scFv control were performed using Welch’s t test, with multiple-comparison correction by the Holm–Sidak method using a significance threshold of 0.05. In panels D–G, means of triplicates are shown with error bars indicating ± 1 standard deviation (SD). Statistical significance levels for all panels: *P < 0.05, **P < 0.01, ***P < 0.001, ****P < 0.0001. The experiments in panels C–E were each performed once. Experiments shown in F and G were performed twice using two different healthy donors’ cells; data from one representative donor are shown. Source data are available for this figure: SourceData F1.
Figure S1.
Figure S1.
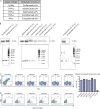
Characterization of cytokine-modulating constructs. (A) scFvs were derived from antibodies reported to bind IL-6Rα, TNF-α, or IFN-γ. (B) The light chain (VL) and heavy chain (VH) was ordered in either VL-VH or VH-VL orientation for each scFv, and fused to the murine kappa chain signal sequence plus an N-terminal FLAG tag (tocilizumab) or c-Myc tag (all other scFvs). HEK293T cells were transfected with plasmids encoding each scFv construct, and culture supernatant was collected 2 days after transfection and analyzed by western blot. The presence of secreted scFv was detected by FLAG (tocilizumab) or c-Myc staining. Full gels are shown below images of zoomed-in bands. Red arrows indicate the relevant lanes in the emapalumab gel; other lanes show samples irrelevant to this study. (C) CAR expression was detected by surface antibody staining for the HA tag. (D) Cytokine modulator expression was detected by intracellular staining for the c-Myc or FLAG tag. Experiments in B–D were each performed once. Source data are available for this figure: SourceData FS1.
Figure 2.
Figure 2.
Cytokine-modulating scFvs can be efficiently coexpressed with CD19 CAR in primary human T cells. (A and B) Schematic of CAR constructs coexpressed with cytokine-modulating scFvs and proteins. Each scFv was fused to a murine kappa signal sequence (s.s.) for secretion and an N-terminal c-Myc or FLAG tag to enable detection by western blots. EGFRt and IL-1Ra are fused to the native EGFR and native IL-1Ra s.s., respectively. CARs are fused to the GM-CSF s.s. and an N-terminal HA tag. (C) scFvs and IL-1Ra are efficiently secreted by CAR-T cells. Primary human T cells were retrovirally transduced with constructs depicted in A and B, and culture supernatants were analyzed by western blot. Full gel images are available in online source data. (D) Recombinant IL-1Ra inhibits IL-1 signaling. IL-1 reporter HEK-Blue cells were transfected with plasmids encoding the indicated constructs and stimulated with 10 ng/ml IL-1β for 24 h. The amount of IL-1-induced SEAP secretion by the HEK-Blue cells was quantified by spectrophotometer. Triplicate wells were separately seeded, transfected, treated with IL-1β, and quantified. Statistical significance was determined by one-way ANOVA for comparisons against the untransfected condition using Dunnett’s correction for multiple comparisons (****P < 0.0001). (E and F) Coexpression of cytokine modulator does not compromise CAR expression or CAR-T cell ex vivo expansion. (E) CAR surface expression was measured by anti-HA antibody staining and flow cytometry (****P < 0.0001). (F) CAR-T cell expansion by day 14 of ex vivo cell culture is unaffected by cytokine modulator expression. Data from three different donors are shown. Statistical significance was determined by linear regression analysis with CAR-EGFRt as the reference group, with donor included as covariate to account for donor correlation. There was no statistically significant difference across different CAR-expressing constructs in panels E and F. In panels D–F, means of triplicates are shown with error bars indicating ± 1 SD. The experiments in panels C and D were each performed once. Panels E and F show data from three different donors, each evaluated with triplicate samples once. Source data are available for this figure: SourceData F2.
Figure 3.
Figure 3.
Secretion of cytokine-modulating scFv does not compromise on-target cytotoxicity by CAR-T cells. (A) CAR-T cells with and without cytokine modulator secretion exhibit similar cytotoxicity and proliferation response to repeated antigen stimulation. CD19 CAR-T cells or EGFRt-transduced control T cells were stimulated with fresh CD19+, EGFP+ Raji tumor cells every 2 days. Viable EGFP+ tumor cells and viable EGFRt+ or HA+ (CAR+) T cells were quantified by flow cytometry. Two independent experiments using two different donors’ cells were performed with triplicate samples; data from one representative donor are shown. (B) Mock-transduced, CAR-EGFRt, and CAR-Toci cells were coincubated with CD19+, ffLuc-expressing Raji, Ramos, NALM6, and K562 cells at the indicated E:T ratios for 48 h. Viable target cells were quantified by bioluminescence measurement, and percent lysis was calculated by normalizing to the signal from wells treated with mock-transduced T cells. Each coincubation condition was performed in triplicates, with two independent experiments performed using two different donors’ cells. Statistical significance was determined by two-way ANOVA analysis applied to each donor’s CAR-EGFRt and CAR-Toci samples. Significance levels are shown for the effects of CAR construct type, adjusted for E:T ratio in the statistical model: *P < 0.05, ***P < 0.001, ****P < 0.0001. In all figure panels, means of triplicates are shown with error bars indicating ± 1 SD.
Figure 4.
Figure 4.
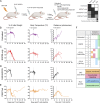
Humanized NSG-SGM3 mice exhibit CRS-related toxicity upon CD19 CAR-T cell transfer. (A) Schematic of the humanized NSG-SGM3 mouse model with Raji xenograft and CD19 CAR-T cell therapy. Generated with BioRender. The table summarizes potential sources of toxicity that may be observed for each treatment group. (B–E) Pilot study demonstrates CAR-induced toxicity in NSG-SGM3 mouse model. Weight, temperature, and tumor radiance of Raji tumor-bearing mice without treatment (B; n = 2), with T cells expressing EGFRt only (C; n = 4), with T cells expressing CD19 CAR and EGFRt (D; n = 4), or with T cells expressing CD19 CAR and tocilizumab scFv (E; n = 4). Each trace represents an individual mouse. Weight and temperature were measured at least once daily, and the end of each weight and temperature trace indicates the end point of the mouse. Bioluminescence imaging frequency was limited to no more than once weekly starting 2 days after T-cell injection due to animal welfare concerns for mice experiencing severe toxicity; thus the end of each radiance trace indicates last data point available but does not necessarily correlate with the end point. (F) Mice treated with different T cells exhibit divergent phenotypes at the endpoint, with CAR-EGFRt T cells inducing symptoms consistent with CRS. This study was performed once.
Figure 5.
Figure 5.
CAR-T cells secreting IL-6Rα and IL-1R inhibitors reduce CRS-related toxicity and extend survival. NSG-SGM3 mice were humanized as described in Fig. 4 A, engrafted with 10 × 106 Raji lymphoma cells, and treated with 8 × 10⁶ T cells expressing the indicated construct (n = 3 for untreated; n = 6 for all other treatment groups). (A and B) Mice treated with CD19 CAR-expressing T cells experienced rapid (A) weight loss and (B) temperature drop after T-cell injection, but secretion of Toci or IL-1Ra reduced weight loss and almost completely prevented temperature drop. Each trace represents an individual mouse. Green dashed lines represent the baseline level (100% initial weight or 38°C body temperature). Red dashed lines indicate substantial weight loss (85% initial weight) or temperature drop (36°C). (C) Tumor progression was quantified by bioluminescence imaging. Each trace represents an individual mouse. Weight, temperature, and tumor radiance were measured as described in Fig. 3. (D) Kaplan–Meier curve for overall survival. Statistical significance was determined by log-rank (Mantel-Cox) test with the Holm–Sidak correction for multiple comparisons against the CAR-EGFRt group (*P < 0.05). This study was performed once.
Figure 6.
Figure 6.
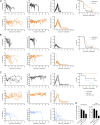
CD19 CAR-T cells that co-express Toci consistently result in extended survival in humanized NSG-SGM3 model for CRS. The humanized mouse study was repeated three additional times to compare T cells expressing CD19 CAR (CAR-EGFRt) or CD19 CAR plus Toci (CAR-Toci). Each experiment used fetal HSPCs from a different donor, as well as CAR-T cells from a different adult healthy donor. (A–C) Several Raji tumor doses were tested: (A) 4.5 × 10⁶, (B) 5.0 × 10⁶, and (C) 10 × 106. Mice were treated with 8 × 10⁶ CAR-T cells in every study. Weight, temperature, and radiance data are shown for each study. Each trace represents an individual mouse. Survival data are shown in Kaplan–Meier curves, with statistical significance determined by log-rank (Mantel-Cox) test against the CAR-EGFRt group (P values shown in figure). Holm–Sidak correction for multiple comparisons was applied in C, which did not yield statistical significance. (D) CD19 CAR expression level of cells used in the study shown in C, as detected by surface staining of pre-infusion T-cell suspensions for the CAR’s N-terminal HA tag. Prior to injection, T-cell cultures were diluted with donor-matched untransduced T cells so that each treatment group had the same percent CAR positivity as measured by HA staining. For A, n = 9 mice in CAR-EGFGRt group and n = 10 mice in CAR-Toci group. For B, n = 10 in both groups. For C, n = 4 in CAR-EGFGRt and n = 5 in both CAR-Toci and CAR-Toci-IL1Ra groups. Experiments in this figure were each performed once.
Figure 7.
Figure 7.
Tocilizumab scFv secretion enables superior toxicity control compared to single-dose systemic tocilizumab antibody administration. NSG-SGM3 mice were humanized as described in Fig. 4 A, engrafted with 10 × 106 Raji lymphoma cells, and treated with 8 × 10⁶ T cells expressing either CAR-EGFRt (n = 12) or CAR-Toci (n = 6). Half (n = 6) of the mice treated with CAR-EGFRt cells were given a single 8 mg/kg dose of tocilizumab via tail-vein injection 2 days after T-cell injection. (A) Weight of individual mice in each treatment group normalized to weight on the day of T-cell injection. Weights were measured twice daily, with jaggedness corresponding to natural daily weight fluctuations. Red arrow indicates time of tocilizumab injection. (B) Rectal temperature of individual mice. (C) Tumor radiance as quantified by bioluminescence imaging. Each trace in A–C corresponds to an individual mouse. (D) Kaplan–Meier curve for overall survival. Statistical significance was determined by log-rank (Mantel-Cox) test with the Holm–Sidak correction for multiple comparisons against the CAR-Toci group (**P < 0.01). (E) Cytokine levels in peripheral blood collected on days −4, 1, 6, and 16 relative to the time of T-cell injection. Red dotted lines indicate the limit of detection (LOD), and data points with values below the LOD are plotted on the LOD line. Means are shown with error bars indicating ± 1 SD. Statistical significance was determined by Welch’s ANOVA with Dunnett’s T3 multiple comparisons test. Statistical significance levels for all panels: *P < 0.05, **P < 0.01, ***P < 0.001, ****P < 0.0001. This study was performed twice with two different donors’ cells; data from one donor are shown.
Figure 8.
Figure 8.
CAR-T cells secreting tocilizumab scFvs show superior anti-tumor efficacy in in vivo stress test against lymphoma xenograft. (A) Schematic of the Raji lymphoma xenograft model in non-humanized NSG mice. Generated with BioRender. (B) Kaplan–Meier curve for overall survival (n = 6 in each treatment group). Statistical significance was determined by log-rank (Mantel-Cox) test with the Holm–Sidak correction for multiple comparisons against the CAR-EGFRt group (**P < 0.01). (C) Tumor progression was quantified by bioluminescence imaging. Each trace represents an individual mouse. This study was performed once. (D) CD4 and CD8 expression distributions among T cells engineered to express CAR with and without cytokine modulators showed little variation based on construct identity. Thawed cell stocks were surface stained with anti-CD4 and anti-CD8 antibodies and analyzed by flow cytometry. Donor 246’s Tnm cells were used on two separate occasions to generate CAR-T cells (batch 1 and batch 2). No cryopreserved stocks were available for CAR-Toci cells from batch 2 for this analysis. Data from three independent experiments are shown; each test condition was performed with triplicate samples.
Figure 9.
Figure 9.
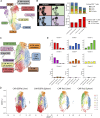
CAR-T cells secreting tocilizumab scFvs promote the enrichment of cytotoxic T cells with memory signatures in vivo. (A) Pooled scRNA-seq data from the livers and spleens of mice treated with either CAR-EGFRt or CAR-Toci T cells were visualized via UMAP. (B) UMAP split by sample (left) and quantification of cluster frequencies (right) reveal CAR-EGFRt samples are dominated by T cells actively undergoing cell cycling, whereas CAR-Toci samples are enriched in cytotoxic T cells that exhibit signatures of memory phenotypes. (C) Reclustering of scRNA-seq data after regression of cell-cycle features. (D) Reclustered UMAP split by sample. (E) Sample composition by cluster. This study was performed once.
Figure S2.
Figure S2.
Cluster characterization by top genes and lineage T-cell markers. (A) Heatmap of top genes in each cluster stratified by average log2(fold change). (B) Average and percent expression of manually curated lineage T-cell markers within each cluster. (C) Clusters 3 and 6 are enriched for CAR-Toci samples.
Figure S3.
Figure S3.
Heterogeneous expression of memory and activation markers in CD8+ clusters. Density plots generated using the Nebulosa R package reveal pockets of memory and activation marker expression within CD8+ T-cell clusters.
Figure S4.
Figure S4.
Cluster characterization by top genes and lineage T-cell markers following regression of cell-cycle features. (A) Heatmap of top genes in each cluster stratified by average log2(fold change). (B) Average and percent expression of manually curated lineage T-cell markers within each cluster.
Figure 10.
Figure 10.
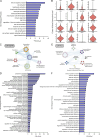
Analysis of cell-cycle-regressed scRNA-seq data. (A) Biological Process GO analysis for cluster 1 reveals strong T-cell activation profile. (B) Expression level for activation, exhaustion, and antigen-presentation genes in cluster 0. Expression levels are log-transformed and normalized to total cell transcript content. (C) Pathway network analysis on genes conserved across all clusters for CAR-EGFRt samples. (D) Significance levels for Biological Process GO pathways for CAR-EGFRt samples. (E) Pathway network analysis on genes conserved across all clusters for CAR-Toci samples. (F) Significance levels for Biological Process GO pathways for CAR-Toci samples. The pathways shown in D and F are represented as nodes in CAR-EGFRt and CAR-Toci pathway networks visualized in C and E, respectively. Significance values in D and F were adjusted via g:Profiler’s g:SCS algorithm and thresholded for padj < 10−10. This study was performed once.
Figure S5.
Figure S5.
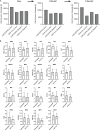
CAR-EGFRt and CAR-Toci expression did not significantly alter T-cell count in vivo. (A) Cell counts in scRNA-seq samples. The first filter was applied automatically by the CellRanger alignment software to remove noisy datapoints (i.e., those likely to represent background signal rather than biologically meaningful cell data). The second filter was applied manually according to Seurat vignette instructions to remove low-quality data points (i.e., those with aberrant total or mitochondrial transcriptional content). (B) Complete blood count analysis on retro-orbital blood obtained from humanized mice. Blood samples were collected from mice in the experiment shown in Fig. 6 C, 1 day after T-cell injection. RBC: red blood cell count; HCT: hematocrit or relative volume of erythrocytes; HB: hemoglobin concentration; PLT: platelet count; PCT: platelet hematocrit; RETIC: reticulocyte percentage; MCV: mean corpuscular (erythrocyte) volume; MCHC: mean corpuscular hemoglobin concentration; WBC: white blood cell count; LY: lymphocyte percentage; MO: monocyte percentage; BA: basophil percentage; EO: eosinophil percentage; NE: neutrophil percentage; RDW: red blood (erythrocyte volume) distribution width; PDW: platelet distribution width; RSD: red blood (erythrocyte volume) standard distribution; MPV: mean platelet volume; and MCH: mean corpuscular hemoglobin.

References

    1. Abramson, J.S., Palomba M.L., Gordon L.I., Lunning M.A., Wang M., Arnason J., Mehta A., Purev E., Maloney D.G., Andreadis C., et al. . 2020. Lisocabtagene maraleucel for patients with relapsed or refractory large B-cell lymphomas (TRANSCEND NHL 001): A multicentre seamless design study. Lancet. 396:839–852. 10.1016/S0140-6736(20)31366-0 - DOI - PubMed
    1. Alcantara, M., Houillier C., Blonski M., Rubio M.T., Willems L., Rascalou A.W., Le Garff-Tavernier M., Maloum K., Bravetti C., Souchet L., et al. . 2022. CAR T-cell therapy in primary central nervous system lymphoma: The clinical experience of the French LOC network. Blood. 139:792–796. 10.1182/blood.2021012932 - DOI - PMC - PubMed
    1. Alizadeh, D., Wong R.A., Yang X., Wang D., Pecoraro J.R., Kuo C.F., Aguilar B., Qi Y., Ann D.K., Starr R., et al. . 2019. IL15 enhances CAR-T cell antitumor activity by reducing mTORC1 activity and preserving their stem cell memory phenotype. Cancer Immunol. Res. 7:759–772. 10.1158/2326-6066.CIR-18-0466 - DOI - PMC - PubMed
    1. Alquicira-Hernandez, J., and Powell J.E.. 2021. Nebulosa recovers single-cell gene expression signals by kernel density estimation. Bioinformatics. 37:2485–2487. 10.1093/bioinformatics/btab003 - DOI - PubMed
    1. Baeuerle, P.A., Ding J., Patel E., Thorausch N., Horton H., Gierut J., Scarfo I., Choudhary R., Kiner O., Krishnamurthy J., et al. . 2019. Synthetic TRuC receptors engaging the complete T cell receptor for potent anti-tumor response. Nat. Commun. 10:2087. 10.1038/s41467-019-10097-0 - DOI - PMC - PubMed