. 2024 Jun 25;8(12):3140-3153.
doi: 10.1182/bloodadvances.2023012073.

Postinfusion PD-1+ CD8+ CAR T cells identify patients responsive to CD19 CAR T-cell therapy in non-Hodgkin lymphoma

Affiliations

Postinfusion PD-1+ CD8+ CAR T cells identify patients responsive to CD19 CAR T-cell therapy in non-Hodgkin lymphoma

Nathan Denlinger et al. Blood Adv. .

Abstract

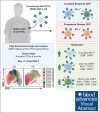
Chimeric antigen receptor (CAR) T-cell therapy has revolutionized treatment for relapsed/refractory B-cell non-Hodgkin lymphoma (NHL). Robust biomarkers and a complete understanding of CAR T-cell function in the postinfusion phase remain limited. Here, we used a 37-color spectral flow cytometry panel to perform high dimensional single-cell analysis of postinfusion samples in 26 patients treated with CD28 costimulatory domain containing commercial CAR T cells for NHL and focused on computationally gated CD8+ CAR T cells. We found that the presence of postinfusion Programmed cell death protein 1 (PD-1)+ CD8+ CAR T cells at the day 14 time point highly correlated with the ability to achieve complete response (CR) by 6 months. Further analysis identified multiple subtypes of CD8+ PD-1+ CAR T cells, including PD-1+ T cell factor 1 (TCF1)+ stem-like CAR T cells and PD-1+ T-cell immunoglobulin and mucin-domain containing-3 (TIM3)+ effector-like CAR T cells that correlated with improved clinical outcomes such as response and progression-free survival. Additionally, we identified a subset of PD-1+ CD8+ CAR+ T cells with effector-like function that was increased in patients who achieved a CR and was associated with grade 3 or higher immune effector cell-associated neurotoxicity syndrome. Here, we identified robust biomarkers of response to CD28 CAR T cells and highlight the importance of PD-1 positivity in CD8+ CAR T cells after infusion in achieving CR.


Conflict of interest statement

Conflict-of-interest disclosures: T.J.V receives research funding from MorphoSys, Incyte, Genmab, AbbVie, Recordati, Viracta Therapeutics, and AstraZeneca; and has consulted for Novartis and Recordati. A.S.K. receives research funding from AstraZeneca and BeiGene; and consults for AbbVie, AstraZeneca, BeiGene, Bristol Myers Squibb (BMS), Kite, a Gilead Company, Janssen, and Loxo@Lilly. D.A.B. receives research funding from Novartis, Nurix Therapeutics, Kite, a Gilead Company, and Incyte; and has consulted for Novartis, Nurix Therapeutics, ADC Therapeutics, and Kite, a Gilead Company. Y.S. has received research funding from BMS, Celgene, TG Therapeutics, BeiGene, AbbVie, and Genmab. J.C.R receives research funding from Merck, Corvus Pharmaceuticals, and Kymera Therapeutics; and consults for Acrotech Biopharma, and Kyowa Kirin. W.H. receives research funding from Incyte. B.C. received research funding from Genentech, Acerta, Millenium, and BMS. S.J. received research funding from Kite, a Gilead Company and BMS; and serves on advisory boards for Kite, a Gilead Company, BMS, Caribou Biosciences, and CRISPR Therapeutics. The remaining authors declare no competing financial interests.

Figures
None
Graphical abstract
Figure 1.
Figure 1.
Differentially abundant CD8+ CAR+ T-cell clusters in CR and PD cohorts. PBMCs from the day-14 post-CAR-T time point were analyzed via spectral flow cytometry. (A) Representative 2-dimensional flow cytometry plot showing gating strategy for CAR19+ CD8+ CAR-Ts. Healthy donor samples were used as negative controls. Percentages of CD3+ T cells as well as CAR19+ CD8+ T cells are indicated. (B) Box plot of CAR19+ CD8+ cells as a percent of live CD45+ CD3+ lymphocytes in CR vs PD cohorts (left); absolute number of CAR19+ CD8+ lymphocytes in CR vs PD cohorts (right). (C) Contour UMAP plots of CAR19+ CD8+ T cells in CR vs PD cohorts. (D) UMAP dot plot of CAR19+ CD8+ T cells from the total cohort (n = 26). (E) UMAP of CAR19+ CD8+ T cells in CR vs PD cohorts with clusters increased in CR colored blue (clusters 7, 8, 9, 11, 12, and 13) and clusters increased in PD colored red (clusters 2, 3, and 4). (F) Box plots showing combined clusters percentages of CAR19+ CD8+ cells. Combined clusters 7, 8, 9, 11, 12, and 13 in CR vs PD (left). Combined clusters 2, 3, and 4 in CR vs PD (right). Box plots in panels B and F show quartiles with bands at the median; whiskers indicate 1.5 interquartile range; all observations overlaid as dots. P values are from linear regression analysis; ∗P < .05, ∗∗P < .01; ∗∗∗P < .001.
Figure 2.
Figure 2.
PD-1+ CD8+ CAR+ T-cell clusters are increased in the CR cohort. (A) Clustered heat map showing key marker expressions on differentially abundant CAR+ CD8+ clusters. Clusters 8 and 9: PD-1+ TCF1+. Clusters 7 and 13: PD-1+ TCF1low TOX. Clusters 11 and 12: PD-1+ TIM3+ T-bet+ GZMB+. Clusters 2, 3, and 4: PD-1 T-bet+ GZMB+. Color scale was determined by median normalization of each individual marker with blue representing low expression, white representing median expression, and red representing high expression. (B) Box plots of clusters in CR vs PD cohorts. Cluster abundance was reported as a percentage of CAR+ CD8+ T cells. (C) UMAP of CAR+CD8+ T cells in CR vs PD cohorts, colored by cluster. (D) Expression plots of phenotypical and functional markers present on CAR+ CD8+ T cells. Expression of markers on individual cells were overlaid onto the UMAP space in CR (top) vs PD (bottom) cohorts. Box plots show quartiles with bands at the median; whiskers indicate 1.5 interquartile range; all observations overlaid as dots. P values are from linear regression analysis; ∗P < .05, ∗∗P < .01; ∗∗∗P < .001.
Figure 3.
Figure 3.
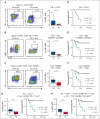
Key postinfusion PD-1+ CAR+ CD8+ T-cell populations correlate with clinical outcomes. 2D flow plot analysis was performed on spectral flow cytometry data from day-14 post-CAR-T samples. (A) Representative 2D flow cytometry plots showing individual patient PD-1 and TCF1 expression in CAR+ CD8+ T cells and corresponding box plot quantification in CR vs PD cohorts. (B) Representative 2D flow cytometry plots showing individual patient EOMES and CD45RO expression in CAR+ CD8+ PD-1+ TOX T cells and corresponding box plot quantification in CR vs PD cohorts. (C) Representative 2D flow cytometry plots showing individual patient PD-1 and TIM3 expression in CAR+ CD8+ T-bet+ GZMB+ T cells and corresponding box plot quantification in CR vs PD cohorts. (D, E, F) Kaplan-Meier (KM) analysis was used to generate PFS curves stratified by high vs low percent of CD8+ CAR-T populations. (D) KM analysis of PFS for patients with high (>4%) or low (<4%) percent of this cell type; high group, n = 6; low group, n = 20. (E) KM analysis of PFS for patients with high (>4.7%) or low (<4.7%) percent of this cell type; high group, n = 13; low group, n = 13. (F) KM analysis of PFS for patients with high (>12%) or low (<12%) percent of this cell type; high group, n = 17; low group, n = 9. (G) Box plot of the combination of PD-1+ TCF1+ cells and PD-1+ TIM3+ T-bet+ GZMB+ cells in CR vs PD (left). KM analysis of PFS for patients with high (>24%) or low (<24%) percent of this combination of cell types (right); high group, n = 13; low group, n = 13. (H) Box plot of the combination of PD-1+ TCF1+ cells, PD-1+ TOX EOMES+ CD45RO+ cells, and PD-1+ TIM3+ T-bet+ GZMB+ cells in CR vs PD (left). KM analysis of PFS for patients with high (>25%) or low (<25%) percent of this combination of cell types (right); high group, n = 15; low group, n = 11. For all KM curves, the x-axis was time in days from date of CAR-T infusion. Dotted lines on box plots indicate separation lines between high and low percentages of CAR-Ts in each population and were selected based on optimal response separation between cohorts. Because clinical outcomes were known during patient stratification, P values need to be interpreted with caution. Box plots in panels A, B, and C show quartiles with bands at the median; whiskers indicate 1.5 interquartile range; all observations overlaid as dots. P values are from linear regression analysis (cell type % changes) and log-rank tests (PFS); ∗P < .05, ∗∗P < .01; ∗∗∗P < .001. Pt, patient.
Figure 4.
Figure 4.
PD-1 expression on postinfusion CD8+ CAR-Ts correlates with improved clinical outcomes. (A) Individual patient PD-1 expression on CAR+ CD8+ T cells was plotted in the UMAP space; CR (top) vs PD (bottom). (B) Individual patient pre- and post-CAR-T infusion 18F-fluorodeoxyglucose–positron emission tomography (PET) scans. Preinfusion PETs were performed within 30 days of CAR-T infusion; red arrows point to site of preinfusion lymphoma lesions. Postinfusion PETs were performed 30 to 60 days after CAR-T infusion; red arrows point to areas of resolution or progression of lymphoma. (C) Representative 2D flow cytometry plot showing PD-1 expression in CR vs PD cohorts (top). Box plot showing percentages of PD-1+ CAR+ CD8+ T cells in CR vs PD cohorts (bottom left). KM analysis of PFS for patients with high (>57.5%) or low (<57.5%) percent of PD-1+ CD8+ CAR-Ts (bottom right); high group, n = 12; low group, n = 14. x-axis is time in days from date of CAR-T infusion. Dotted lines on box plots indicate separation lines between high and low percentages of CAR-Ts and were selected based on optimal response separation between cohorts. Because clinical outcomes were known during patient stratification, P values should be interpreted with caution. Box plots show quartiles with bands at the median; whiskers indicate 1.5 interquartile range; all observations overlaid as dots. P values are from linear regression analysis (cell type % changes) and log-rank test (PFS); ∗P < .05, ∗∗P < .01; ∗∗∗P < .001. Pt, Patient.
Figure 5.
Figure 5.
Higher quantities of PD1+ TIM3+ effector-like CD8+ CAR-Ts correlate with severe ICANS in CR. Patients who achieved CR (n = 16) were separated into a severe ICANS (grade 3-4) cohort (n = 4) and a no/nonsevere ICANS (grade 0-2) cohort (n = 12). (A) Day-14 postinfusion PBMCs were analyzed by spectral flow cytometry and dimensional reduction. Individual patient UMAPs of CAR+ CD8+ T-cell clusters in ICANS (left) vs no/nonsevere ICANS cohorts (right) are shown, colored by cluster. Largest cross sectional tumor diameter before CAR-T infusion is listed underneath patient identifying numbers. Box plots in panels B and C compare characteristics in severe ICANS vs no/nonsevere ICANS cohorts. (B) Combined clusters 11 and 12, reported as a percent of CAR+ CD8+ T cells. (C) PD-1+ TIM3+ T-bet+ GZMB+ cells quantified by 2D flow analysis, reported as a percentage of CAR+ CD8+ cells. Box plots show quartiles with bands at the median; whiskers indicate 1.5 interquartile range; all observations overlaid as dots. P values are from linear regression analysis; ∗P < .05, ∗∗P < .01; ∗∗∗P < .001. Pt, Patient.

References

    1. Neelapu SS, Locke FL, Bartlett NL, et al. Axicabtagene ciloleucel CAR T-cell therapy in refractory large B-cell lymphoma. N Engl J Med. 2017;377(26):2531–2544. - PMC - PubMed
    1. Schuster SJ, Bishop MR, Tam CS, et al. Tisagenlecleucel in adult relapsed or refractory diffuse large B-cell lymphoma. N Engl J Med. 2019;380(1):45–56. - PubMed
    1. Abramson JS, Palomba ML, Gordon LI, et al. Lisocabtagene maraleucel for patients with relapsed or refractory large B-cell lymphomas (TRANSCEND NHL 001): a multicentre seamless design study. Lancet. 2020;396(10254):839–852. - PubMed
    1. Locke FL, Miklos DB, Jacobson CA, et al. Axicabtagene ciloleucel as second-line therapy for large B-cell lymphoma. N Engl J Med. 2022;386(7):640–654. - PubMed
    1. Kamdar M, Solomon SR, Arnason J, et al. Lisocabtagene maraleucel versus standard of care with salvage chemotherapy followed by autologous stem cell transplantation as second-line treatment in patients with relapsed or refractory large B-cell lymphoma (TRANSFORM): results from an interim analysis of an open-label, randomised, phase 3 trial. Lancet. 2022;399(10343):2294–2308. - PubMed

Publication types