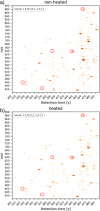
Python workflow for the selection and identification of marker peptides-proof-of-principle study with heated milk
- PMID: 38607384
- PMCID: PMC11106092
- DOI: 10.1007/s00216-024-05286-w
Python workflow for the selection and identification of marker peptides-proof-of-principle study with heated milk
Abstract
The analysis of almost holistic food profiles has developed considerably over the last years. This has also led to larger amounts of data and the ability to obtain more information about health-beneficial and adverse constituents in food than ever before. Especially in the field of proteomics, software is used for evaluation, and these do not provide specific approaches for unique monitoring questions. An additional and more comprehensive way of evaluation can be done with the programming language Python. It offers broad possibilities by a large ecosystem for mass spectrometric data analysis, but needs to be tailored for specific sets of features, the research questions behind. It also offers the applicability of various machine-learning approaches. The aim of the present study was to develop an algorithm for selecting and identifying potential marker peptides from mass spectrometric data. The workflow is divided into three steps: (I) feature engineering, (II) chemometric data analysis, and (III) feature identification. The first step is the transformation of the mass spectrometric data into a structure, which enables the application of existing data analysis packages in Python. The second step is the data analysis for selecting single features. These features are further processed in the third step, which is the feature identification. The data used exemplarily in this proof-of-principle approach was from a study on the influence of a heat treatment on the milk proteome/peptidome.
Keywords: Chemometrics; Feature identification; Mass spectrometry; Processed milk; Proteomics; Python.
© 2024. The Author(s).
Conflict of interest statement
The authors declare no competing interests.
Figures


Similar articles
-
Marker Peptides for Indicating the Spoilage of Milk-Sample Preparation and Chemometric Approaches for Yielding Potential Peptides in a Raw Milk Model.Foods. 2024 Oct 18;13(20):3315. doi: 10.3390/foods13203315. Foods. 2024. PMID: 39456376 Free PMC article.
-
PeptidePicker: a scientific workflow with web interface for selecting appropriate peptides for targeted proteomics experiments.J Proteomics. 2014 Jun 25;106:151-61. doi: 10.1016/j.jprot.2014.04.018. Epub 2014 Apr 22. J Proteomics. 2014. PMID: 24769191
-
The Shelf Life of Milk-A Novel Concept for the Identification of Marker Peptides Using Multivariate Analysis.Foods. 2024 Mar 8;13(6):831. doi: 10.3390/foods13060831. Foods. 2024. PMID: 38540821 Free PMC article.
-
Peptidomics as a tool for characterizing bioactive milk peptides.Food Chem. 2017 Sep 1;230:91-98. doi: 10.1016/j.foodchem.2017.03.016. Epub 2017 Mar 8. Food Chem. 2017. PMID: 28407976 Review.
-
Methods and Algorithms for Quantitative Proteomics by Mass Spectrometry.Methods Mol Biol. 2020;2051:161-197. doi: 10.1007/978-1-4939-9744-2_7. Methods Mol Biol. 2020. PMID: 31552629 Review.
Cited by
-
Accumulated seizure burden predicts neurodevelopmental outcome at 36 months of age in patients with tuberous sclerosis complex.Epilepsia. 2025 Jan;66(1):117-133. doi: 10.1111/epi.18172. Epub 2024 Oct 29. Epilepsia. 2025. PMID: 39470995 Free PMC article.
-
Marker Peptides for Indicating the Spoilage of Milk-Sample Preparation and Chemometric Approaches for Yielding Potential Peptides in a Raw Milk Model.Foods. 2024 Oct 18;13(20):3315. doi: 10.3390/foods13203315. Foods. 2024. PMID: 39456376 Free PMC article.
References
-
- Mannila H (1996) Data mining: machine learning, statistics, and databases. In: Proceedings - 8th International Conference on Scientific and Statistical Data Base Management, SSDBM 1996. IEEE, pp 2–8.
-
- Hibbert DB. Vocabulary of concepts and terms in chemometrics (IUPAC Recommendations 2016) Pure Appl Chem. 2016;88:407–443. doi: 10.1515/pac-2015-0605. - DOI
MeSH terms
LinkOut - more resources
Full Text Sources

