

Differential mitochondrial bioenergetics and cellular resilience in astrocytes, hepatocytes, and fibroblasts from aging baboons
- PMID: 38607532
- PMCID: PMC11335705
- DOI: 10.1007/s11357-024-01155-7
Differential mitochondrial bioenergetics and cellular resilience in astrocytes, hepatocytes, and fibroblasts from aging baboons
Abstract
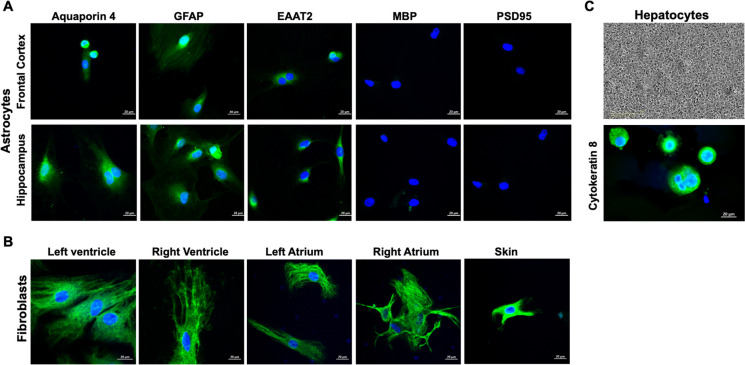
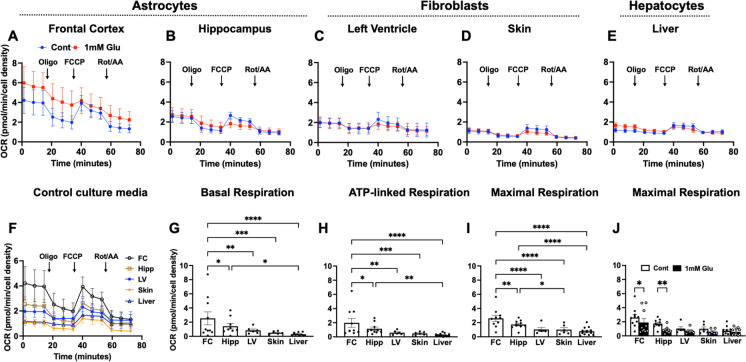
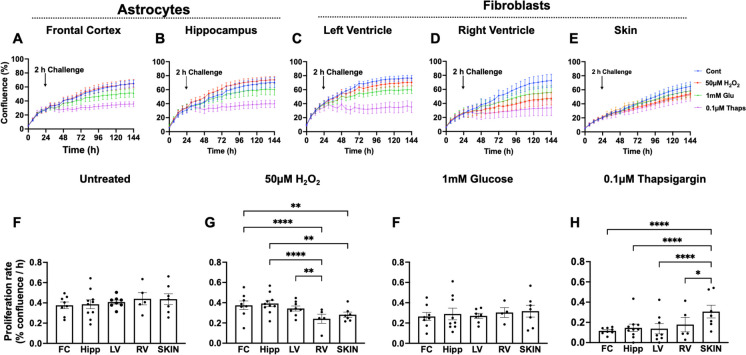
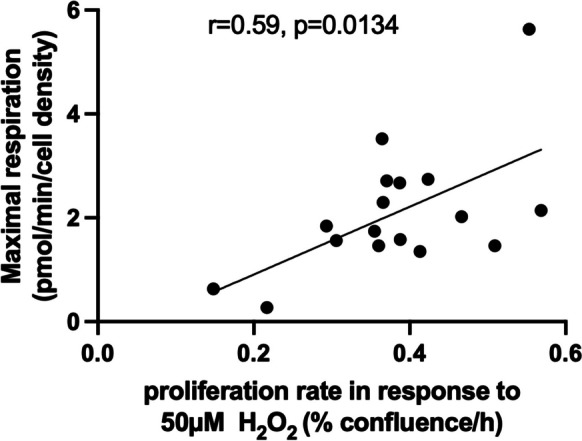
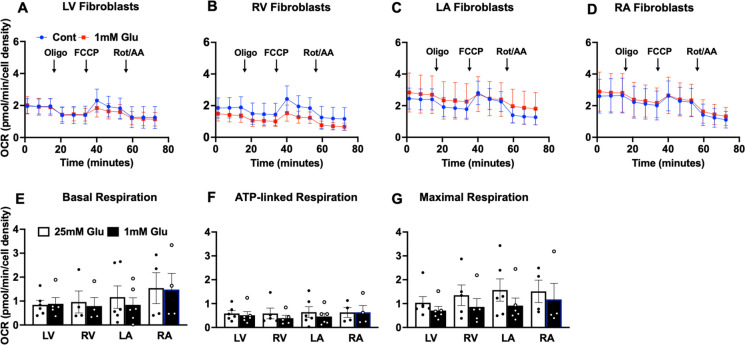
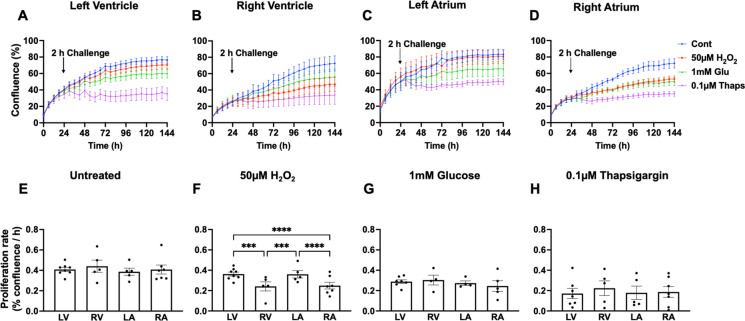
Biological resilience, broadly defined as the ability to recover from an acute challenge and return to homeostasis, is of growing importance to the biology of aging. At the cellular level, there is variability across tissue types in resilience and these differences are likely to contribute to tissue aging rate disparities. However, there are challenges in addressing these cell-type differences at regional, tissue, and subject level. To address this question, we established primary cells from aged male and female baboons between 13.3 and 17.8 years spanning across different tissues, tissue regions, and cell types including (1) fibroblasts from skin and from the heart separated into the left ventricle (LV), right ventricle (RV), left atrium (LA), and right atrium (RA); (2) astrocytes from the prefrontal cortex and hippocampus; and (3) hepatocytes. Primary cells were characterized by their cell surface markers and their cellular respiration was assessed with Seahorse XFe96. Cellular resilience was assessed by modifying a live-cell imaging approach; we previously reported that monitors proliferation of dividing cells following response and recovery to oxidative (50 µM-H2O2), metabolic (1 mM-glucose), and proteostasis (0.1 µM-thapsigargin) stress. We noted significant differences even among similar cell types that are dependent on tissue source and the diversity in cellular response is stressor-specific. For example, astrocytes had a higher oxygen consumption rate and exhibited greater resilience to oxidative stress (OS) than both fibroblasts and hepatocytes. RV and RA fibroblasts were less resilient to OS compared with LV and LA, respectively. Skin fibroblasts were less impacted by proteostasis stress compared to astrocytes and cardiac fibroblasts. Future studies will test the functional relationship of these outcomes to the age and developmental status of donors as potential predictive markers.
Keywords: Astrocytes; Baboons; Bioenergetics; Fibroblasts; Hepatocytes; Resilience.
© 2024. This is a U.S. Government work and not under copyright protection in the US; foreign copyright protection may apply.
Conflict of interest statement
The authors declare no competing interest.
Figures
Update of
-
Differential mitochondrial bioenergetics and cellular resilience in astrocytes, hepatocytes, and fibroblasts from aging baboons.bioRxiv [Preprint]. 2024 Feb 9:2024.02.06.579010. doi: 10.1101/2024.02.06.579010. bioRxiv. 2024. Update in: Geroscience. 2024 Oct;46(5):4443-4459. doi: 10.1007/s11357-024-01155-7. PMID: 38370705 Free PMC article. Updated. Preprint.
Similar articles
-
Perinatal maternal undernutrition in baboons modulates hepatic mitochondrial function but not metabolites in aging offspring.bioRxiv [Preprint]. 2024 May 5:2024.05.02.592246. doi: 10.1101/2024.05.02.592246. bioRxiv. 2024. PMID: 38746316 Free PMC article. Preprint.
-
Differential mitochondrial bioenergetics and cellular resilience in astrocytes, hepatocytes, and fibroblasts from aging baboons.bioRxiv [Preprint]. 2024 Feb 9:2024.02.06.579010. doi: 10.1101/2024.02.06.579010. bioRxiv. 2024. Update in: Geroscience. 2024 Oct;46(5):4443-4459. doi: 10.1007/s11357-024-01155-7. PMID: 38370705 Free PMC article. Updated. Preprint.
-
Age and sex modify cellular proliferation responses to oxidative stress and glucocorticoid challenges in baboon cells.Geroscience. 2021 Aug;43(4):2067-2085. doi: 10.1007/s11357-021-00395-1. Epub 2021 Jun 5. Geroscience. 2021. PMID: 34089175 Free PMC article.
-
Respiratory function decline and DNA mutation in mitochondria, oxidative stress and altered gene expression during aging.Chang Gung Med J. 2009 Mar-Apr;32(2):113-32. Chang Gung Med J. 2009. PMID: 19403001 Review.
-
The evolving role of the NAD+/nicotinamide metabolome in skin homeostasis, cellular bioenergetics, and aging.DNA Repair (Amst). 2014 Nov;23:59-63. doi: 10.1016/j.dnarep.2014.04.005. Epub 2014 Apr 30. DNA Repair (Amst). 2014. PMID: 24794404 Review.
Cited by
-
Primary Cell Culture as a Model System for Evolutionary Molecular Physiology.Int J Mol Sci. 2024 Jul 19;25(14):7905. doi: 10.3390/ijms25147905. Int J Mol Sci. 2024. PMID: 39063147 Free PMC article. Review.
-
Perinatal maternal undernutrition in baboons modulates hepatic mitochondrial function but not metabolites in aging offspring.bioRxiv [Preprint]. 2024 May 5:2024.05.02.592246. doi: 10.1101/2024.05.02.592246. bioRxiv. 2024. PMID: 38746316 Free PMC article. Preprint.
-
Nutrition and Aging Biology: Summary of a Research Centers Collaborative Network Workshop and Research Needs.Curr Dev Nutr. 2025 Jun 18;9(7):107485. doi: 10.1016/j.cdnut.2025.107485. eCollection 2025 Jul. Curr Dev Nutr. 2025. PMID: 40697195 Free PMC article.
References
-
- Tran NM, Shekhar K, Whitney IE, Jacobi A, Benhar I, Hong G, Yan W, Adiconis X, Arnold ME, Lee JM, Levin JZ, Lin D, Wang C, Lieber CM, Regev A, He Z, Sanes JR. Single-cell profiles of retinal ganglion cells differing in resilience to injury reveal neuroprotective genes. Neuron. 2019;104(6):1039-1055.e12. 10.1016/j.neuron. 10.1016/j.neuron - DOI - PMC - PubMed
-
- Nie C, Li Y, Li R, Yan Y, Zhang D, Li T, Li Z, Sun Y, Zhen H, Ding J, Wan Z, Gong J, Shi Y, Huang Z, Wu Y, Cai K, Zong Y, Wang Z, Wang R, Jian M, Jin X, Wang J, Yang H, Han JJ, Zhang X, Franceschi C, Kennedy BK, Xu X. Distinct biological ages of organs and systems identified from a multi-omics study. Cell Rep. 2022;38(10):110459. 10.1016/j.celrep.2022.110459. 10.1016/j.celrep.2022.110459 - DOI - PubMed
MeSH terms
Grants and funding
LinkOut - more resources
Full Text Sources
Medical
